




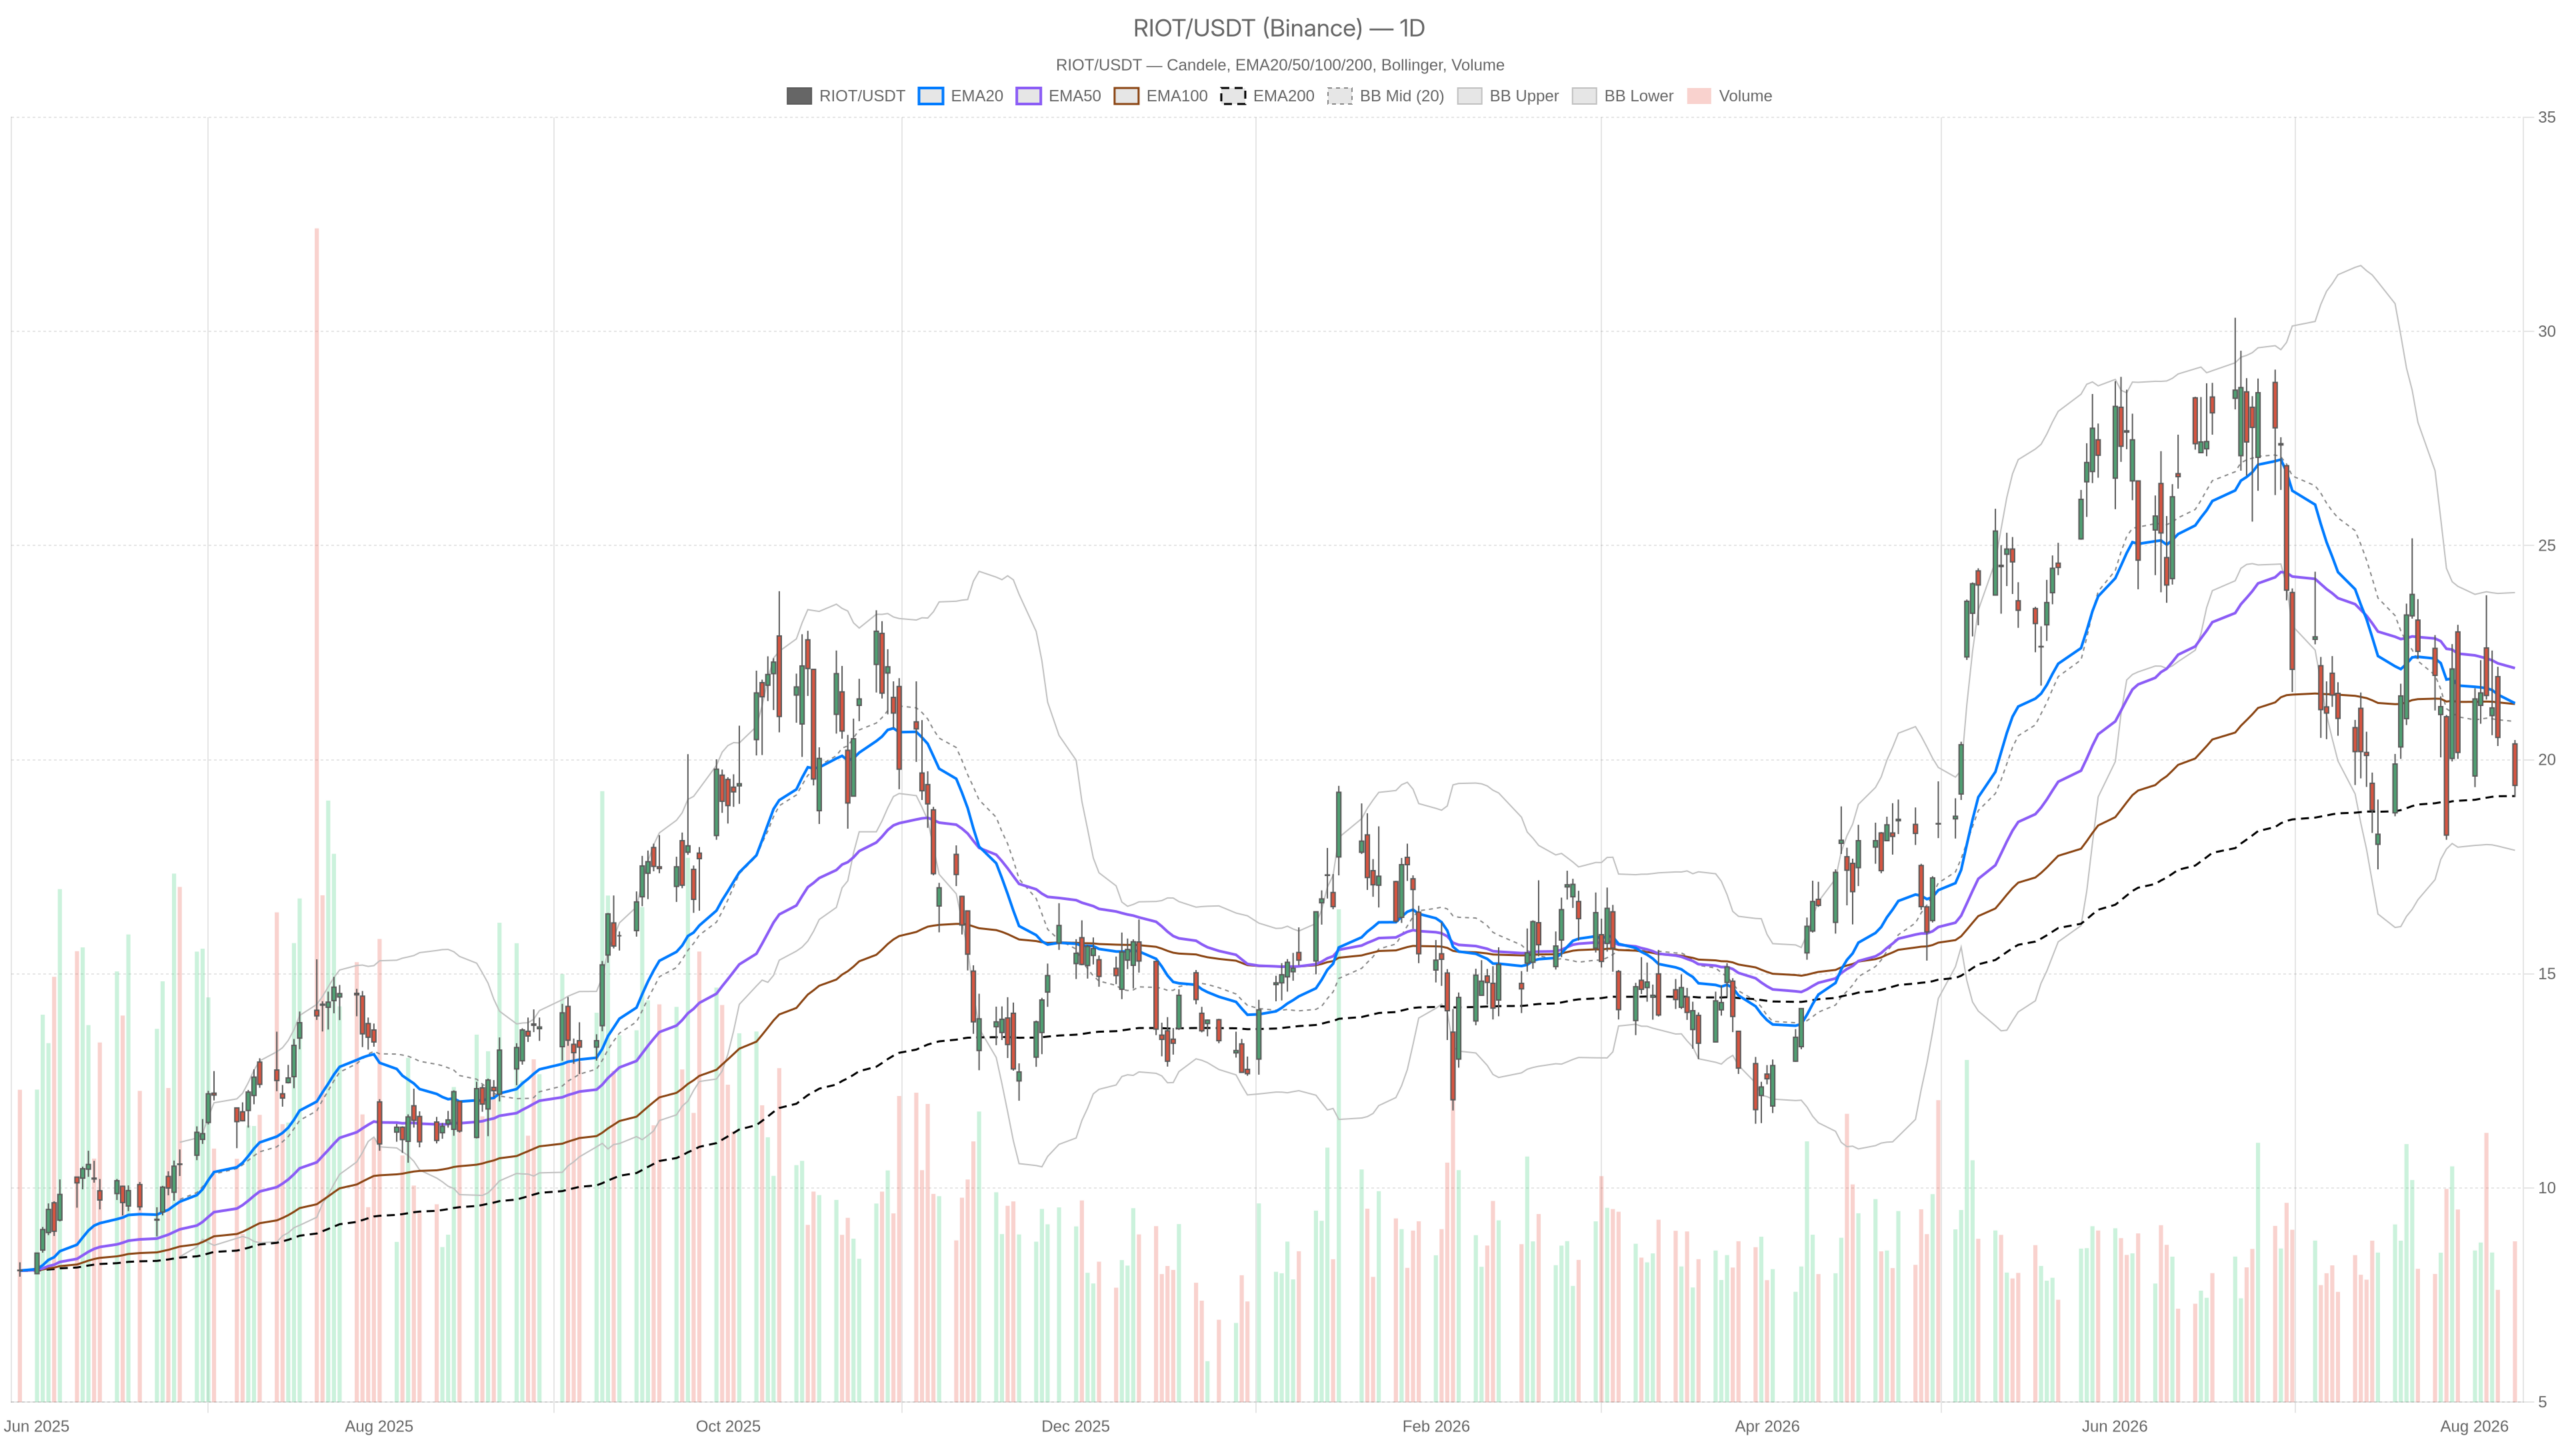
Riot Platforms, Inc. stock presents a split picture. The daily chart, at Monday’s close of $19.40, shows weeks of bleeding lower. Yet a $9.1 billion AI lease deal with Anthropic and a revenue beat landed after hours. Shares surged. The charts have not caught up.
Summary
Key takeaways
- Riot Platforms stock closed at $19.40 on Monday, holding just above the 200-day EMA at $19.15.
- A $9.1 billion, 20-year AI lease deal with Anthropic was announced after hours, alongside a second-quarter revenue beat.
- Daily momentum is softening but not broken: RSI at 41.75 and MACD showing early stabilization signals.
- The hourly chart remains bearish, with price below all three key moving averages.
- Daily ATR at $2.29 implies the stock can move more than 10% in a single session.
Daily bias: neutral regime, but the trend layers are stacked against price
The daily chart is neutral. Price at $19.40 holds above the 200-day EMA but trades below both shorter-term moving averages. The close sits beneath the 20-day EMA at 21.32 and the 50-day EMA at 22.14. Those two averages are descending in sequence above spot. That is the classic footprint of a stock working off an earlier advance, not one building a base with momentum behind it.
The 200-day EMA at 19.15, however, changes the tone. Price is still holding just above it. That single level is the dividing line between an orderly pullback and a genuine trend break. Monday’s session tested the idea, printing a low of 19.13 before closing at 19.40. Buyers defended the zone, if only barely.
Momentum and volatility: soft pressure, not breakdown
Momentum is soft rather than broken. Daily RSI at 41.75 sits below the midpoint, confirming sellers still hold the initiative. Yet it is nowhere near oversold, which leaves room in both directions. Meanwhile, the daily MACD line at -0.72 has edged above its signal at -0.75. That produced a slim positive histogram of 0.03. It is not a trend reversal. It is the first hint that downside pressure is losing intensity.
Volatility gives the range some shape. The daily Bollinger mid-band at 20.89 caps the recovery attempts, with the upper band at 23.90 and the lower at 17.89. Price is drifting in the lower half of that envelope. Daily ATR at 2.29 is the number that matters most here. On a sub-20 share price, that is a very wide expected daily swing. It explains why both scenarios below can resolve quickly.
The hourly chart weakens the case for an immediate turn
The hourly chart is bearish. Price at 19.37 sits beneath all three key moving averages in descending order. The close is under the 20-hour EMA at 20.34, the 50 at 20.92, and the 200 at 21.95. Every layer of short-term trend sits above price. Rallies into 20.30–20.90 would meet supply before they meet buyers.
Hourly RSI at 32.48 pushes into stretched territory without confirming exhaustion. In contrast to the daily, the hourly MACD is still deteriorating. The line at -0.59 sits under the signal at -0.45, with the histogram at -0.14. Selling momentum on the intraday clock was accelerating into the close, not fading.
This is the core conflict. The daily is neutral and stabilising near its 200-day EMA. The hourly is actively bearish and has not yet produced a higher low. Until those two align, any bullish reaction risks being a news-driven gap rather than a structural turn. Hourly ATR at 0.47 also warns that intraday swings are large enough to shake out poorly placed positioning.
15m execution context
The 15-minute chart shows compression rather than direction. Price is consolidating in a tight range near 19.37. The session was compressed between 19.37 and 19.73. Bollinger bands are tight, with the mid at 19.44, the upper at 19.72 and the lower at 19.16. ATR at 0.19 confirms compression. Notably, the 15m MACD histogram has turned positive at 0.06. The line at -0.20 now sits above the signal at -0.26. RSI recovered to 41.42.
Short-term sellers are pausing. Even so, price remains under the 15m EMA20 at 19.54 and EMA50 at 20.05. For timing purposes, reclaiming 19.54 then 19.61 is the first requirement before anything constructive can be argued.
Bullish scenario for Riot Platforms, Inc. stock
The bullish case requires reclaiming $19.66, the daily pivot, to flip the balance point in favor of buyers. The bull case leans on the fundamental catalyst plus the pivot map. Daily pivot sits at 19.66 with R1 at 20.20. A sustained move through 19.66 would flip the daily balance point, and 20.20 becomes the next test. Above that, the hourly EMA cluster at 20.34 and 20.92 is the real battleground, followed by the daily Bollinger mid at 20.89.
Supporting evidence would include the daily MACD histogram continuing to expand positively, RSI reclaiming 50, and the hourly averages flattening rather than falling. The revenue beat and reiterated Citizens rating anchor the move. The scale of the 20-year lease gives it weight that pure technical bounces lack.
Bearish scenario and what invalidates the bulls
The bearish case activates on a close below $19.13. That would break the 200-day EMA and open the path to $17.89. The bearish path is simple. Daily S1 at 18.87 sits just below the 200-day EMA at 19.15. A decisive close under 19.13, Monday’s low, would break the last remaining trend support. That would open the lower Bollinger band at 17.89.
On the other hand, the bullish case does not need a full collapse to fail. A rejection at 19.66 or 20.20, followed by a lower high on the hourly chart, would suggest the news pop was absorbed by supply. The hourly pivots at 19.49 and 19.25 are the tight markers to watch, given how compressed the 15m range has become.
Positioning into an event-heavy tape
Volatility, not direction, is the most reliable expectation for Riot Platforms, Inc. stock. Daily ATR of $2.29 implies double-digit percentage swings are normal. The stock is caught between a heavy technical structure and a genuinely material catalyst. Overall, the daily is neutral, the hourly is bearish, and the 15-minute chart is merely coiled. With a CPI print on the macro calendar and retail sentiment already soft on broader indices, event risk is layered on top of stock-specific news.
Until $19.66 is reclaimed or $19.13 gives way, the chart is best treated as unresolved rather than trending. A daily ATR of 2.29 against a 19.40 price means the market can travel more than 10% in a session without anything unusual happening. Both scenarios remain live. The gap between the technical structure and the fundamental catalyst has yet to close.
FAQ
What is the daily bias for Riot Platforms stock?
The daily chart is neutral. Price at $19.40 holds above the 200-day EMA at $19.15 but trades below the 20-day EMA at $21.32 and the 50-day EMA at $22.14. Momentum is soft but not broken, with RSI at 41.75.
What is the key catalyst for RIOT stock?
A $9.1 billion, 20-year AI lease deal, reportedly with Anthropic, was announced after Monday’s close. A second-quarter revenue beat accompanied the news. Shares surged in after-hours trading.
What are the key levels to watch for Riot Platforms, Inc. stock?
On the upside, $19.66 (daily pivot) is the first hurdle, followed by $20.20 (R1) and the hourly EMA cluster at $20.34–$20.92. On the downside, $19.13 (Monday’s low) and the 200-day EMA at $19.15 are critical. A break below opens $17.89.
Is the technical outlook bullish or bearish for Riot Platforms?
The outlook is unresolved. The daily chart is neutral and stabilizing near the 200-day EMA. The hourly chart is actively bearish. Until $19.66 is reclaimed or $19.13 gives way, the chart lacks a clear directional bias.
Disclaimer: This article is for informational purposes only and does not constitute financial advice, an investment recommendation, or a solicitation to buy or sell any financial instrument or cryptocurrency. The analysis provided is not indicative of future results. Investing in crypto assets and financial markets carries a high risk of capital loss. Always do your own research (DYOR) and consult a qualified financial advisor before making any decision.
Article produced with the assistance of artificial intelligence and reviewed by the editorial team.
