




Hims & Hers Health, Inc. stock faces a post-earnings reset after a $86.3 million net loss triggered a 6% after-hours drop. The daily chart, previously neutral near 31.77, is now being repriced by a fresh catalyst. The medium-term structure remains contested.
Summary
Key takeaways
- Hims & Hers Health, Inc. stock closed at 31.77 on August 10 before falling 6% after hours on a Q2 net loss of $86.3 million.
- Second-quarter revenue exceeded $753 million, up nearly 40% year over year, with close to 3 million subscribers globally.
- Management raised the 2026 revenue outlook to $3.1–$3.3 billion and guided Q3 revenue to $880–$900 million.
- Key technical levels: resistance at 32.41 (above the 200-day EMA at 32.32), support at 31.02, and secondary support at the 50-day EMA of 30.71.
- Daily ATR of 2.94 signals that wide, unforgiving moves remain the dominant variable for this stock.
Daily structure defines a range, not a trend
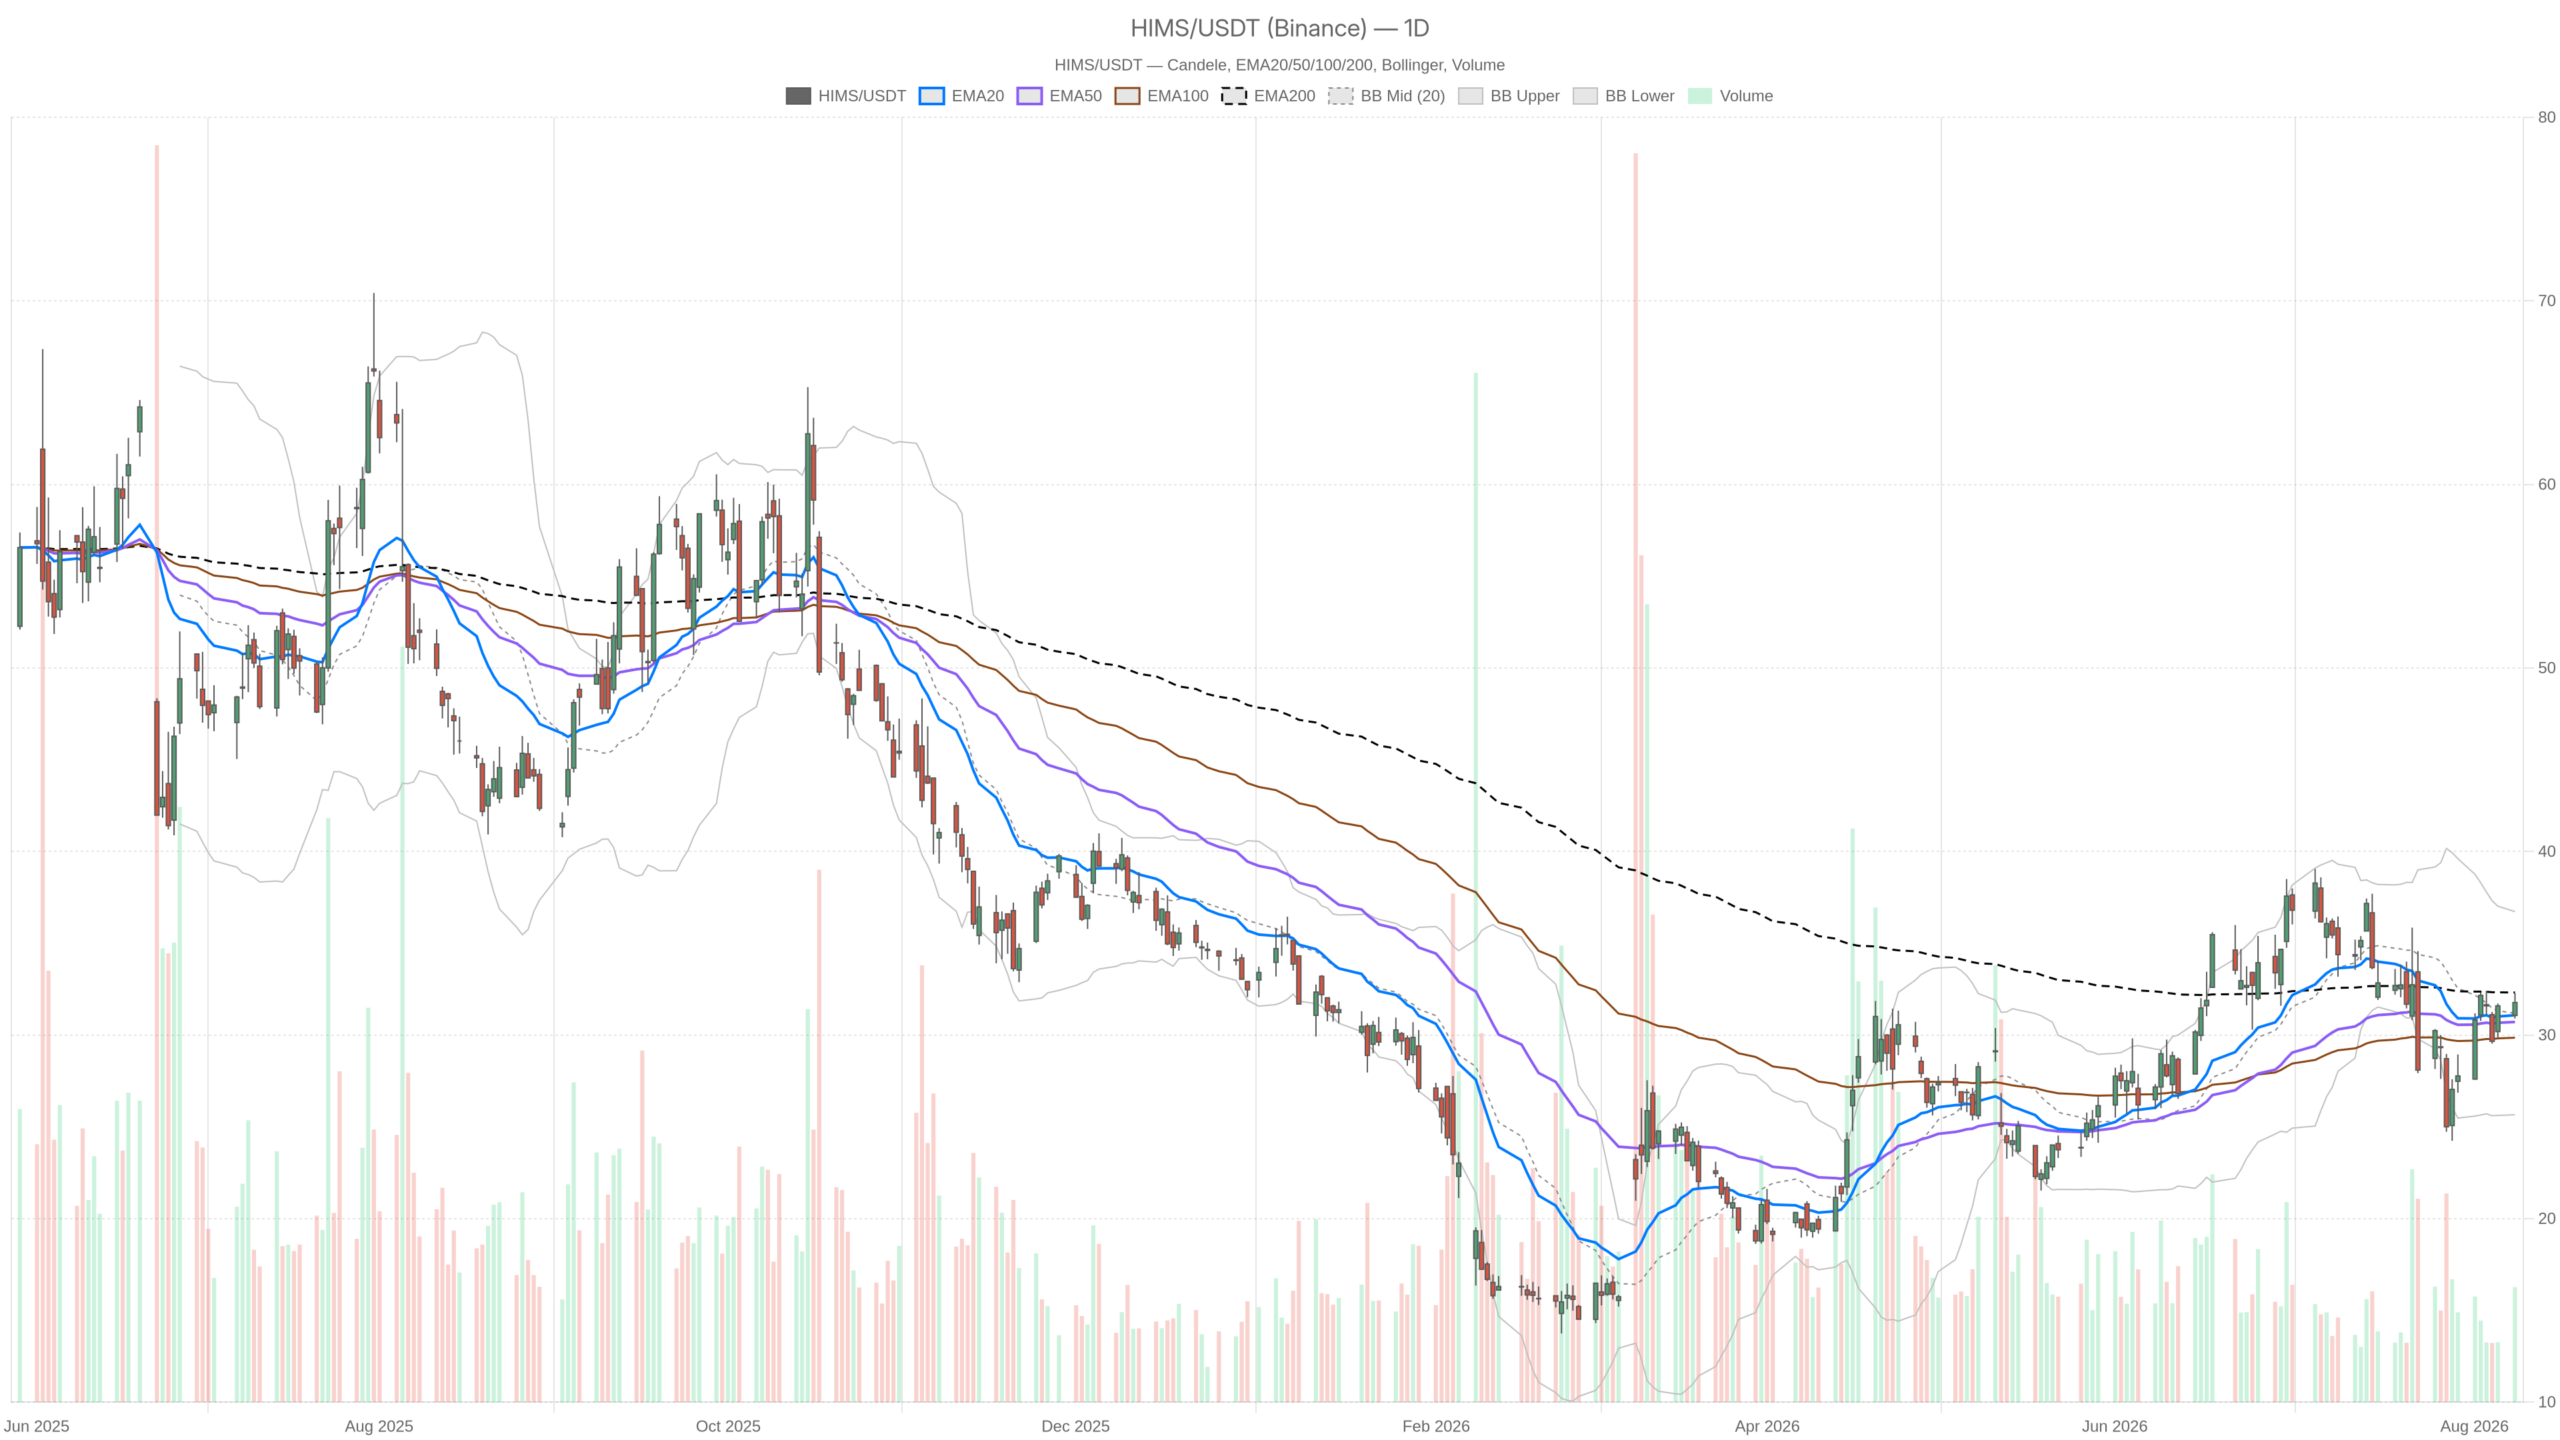
The daily chart shows Hims & Hers Health, Inc. stock trapped between short-term recovery and longer-term damage. Price sits above the 20-day EMA at 31.08 and the 50-day EMA at 30.71. However, it remains below the critical 200-day EMA at 32.32. That configuration defines a stock caught between two competing timeframes. Buyers control the near term. Sellers still own the trend line that matters most.
Meanwhile, RSI at 51.44 reinforces the stalemate. There is no exhaustion, no oversold stress, and no momentum thrust. The MACD line at -0.43 sits below zero but above its signal at -0.56, with a positive histogram of 0.14. Momentum was improving from a weak base, typical of a bottoming attempt rather than an established uptrend.
Bollinger Bands add further context. The mid-band at 31.19 acted as a magnet, with the upper band at 36.72 and the lower at 25.66. That wide envelope means volatility has room to expand in either direction without technically breaking anything.
Notably, daily ATR of 2.94 is the number to respect. Roughly three points of average daily range on a stock near 31.77 is significant. A 6% after-hours move, while sharp, is not structurally abnormal for this name. It fits inside the volatility profile the market has already been pricing.
Key levels on the Hims & Hers Health, Inc. stock chart
The immediate battle lines for Hims & Hers Health, Inc. stock are clear: resistance at 32.41, support at 31.02. The 200-day EMA at 32.32 serves as the true trend-deciding threshold. Daily pivots frame the contest, with the pivot point standing at 31.65.
The 32.41 area is doubly important because it sits just above the 200-day EMA at 32.32. Reclaiming that zone would be the first genuine trend signal in weeks.
On the downside, 31.02 is the first real shelf, closely tracking the 20-day EMA. Below that, the 50-day EMA at 30.71 becomes the line separating a routine post-earnings shakeout from a deeper unwind of the recovery attempt.
The 1H chart was constructive before the catalyst
Before earnings, the hourly chart showed short-term buyers in control. Price held above all key hourly moving averages in a constructive stacking pattern. Specifically, price at 31.79 sat above the 20-hour EMA at 31.38, the 50-hour EMA at 30.79, and the 200-hour EMA at 31.29.
Meanwhile, hourly RSI at 59.99 sat just under the 60 threshold—firm but not stretched. At the same time, the hourly MACD was positive at 0.37 against a 0.34 signal, with a thin histogram of 0.03. Positive, yes, but flattening. Momentum was fading into resistance rather than accelerating through it.
In terms of volatility, hourly Bollinger Bands placed the upper boundary at 32.66 and the lower at 29.54, with the mid at 31.10. Price was in the upper half but had not tagged the top. Notably, hourly ATR of 0.54 confirms that intraday swings were compressing before the release. Compression ahead of an event usually resolves violently, and that is exactly what happened after the bell.
15m execution context: a tight coil losing its lift
The 15-minute chart revealed a bullish regime that was already tiring. Momentum was fading and a tight coil was poised for a violent post-earnings breakout. Price at 31.79 hovered right at the 20-period EMA of 31.75, above the 50 at 31.51 and well above the 200 at 30.54.
However, the MACD had already rolled slightly negative. The line sat at 0.07 below a 0.10 signal, with a histogram of -0.03. The short-term bid was losing its lift right at the edge of the event.
At the same time, the 15-minute Bollinger range was extremely narrow, spanning 31.57 to 32.05 around a 31.81 mid. ATR of just 0.21 confirms the squeeze. For execution purposes, this matters more than direction. Intraday traders were operating on a very tight leash, and the first post-earnings hour is likely to blow through those boundaries.
Where the timeframes disagree
The core conflict is straightforward. The daily chart signals neutral below the long-term trend, while the hourly shows short-term strength. Meanwhile, the 15-minute warns that the bid was already weakening before the catalyst hit. Layered on top, the news flow says the fundamental narrative just changed tone.
That mismatch is why the signals here must be called mixed rather than aligned. The technical readings were captured before the market absorbed the loss and the guidance. Treating the hourly strength as still valid would be a mistake until price confirms it in cash trading.
Bullish scenario
The bull case rests on exceptional operating momentum. Revenue exceeded $753 million and management raised the 2026 outlook to $3.1–$3.3 billion. However, the technical picture still requires confirmation above 32.41. Second-quarter revenue was up nearly 40% year over year. The company added 300,000 net new subscribers and finished the period with close to 3 million subscribers globally. Management also guided third-quarter revenue to $880–$900 million.
Technically, the bulls need three things. First, a hold above 31.02 on any opening flush. Second, a reclaim of the 31.65 pivot and the hourly EMA cluster near 31.38. Third, and decisively, a close above 32.41, which would carry price back over the 200-day EMA at 32.32. Achieving that would turn the daily MACD improvement into a legitimate trend change rather than a range oscillation.
Bearish scenario
The bear case turns on the sharp swing from a $42.5 million profit to an $86.3 million loss. A break below the 20-day EMA at 31.08 would likely trigger a deeper unwind toward lower Bollinger Band levels. Growth is being bought at a cost. The earnings call flagged margins and FTC risk alongside the Eucalyptus deal and AI gains. If the market chooses to price the loss rather than the guidance, the technical damage follows quickly.
In turn, a decisive break below the 20-day EMA at 31.08 and the 31.02 pivot support would invalidate the bullish setup. Losing the 50-day EMA at 30.71 would then open the lower part of the daily Bollinger structure. The band floor sits far below at 25.66. Given a daily ATR near 2.94, that distance can be covered faster than most position sizing assumes.
Positioning and volatility
Volatility, not direction, is the dominant variable for Hims & Hers Health, Inc. stock right now. A compressed intraday structure is colliding with a wide daily range that can cover significant ground quickly. Overall, the honest read is that the technical framework has been overtaken by the catalyst. It now needs to re-establish itself. The levels remain valid as reference points. Their signals, however, only regain meaning once the post-earnings session prints a real range.
Meanwhile, a compressed 15-minute structure, a 0.54 hourly ATR, and a near-3-point daily ATR combine to produce wide, unforgiving moves. Until price settles above 32.41 or breaks below 30.71, the market is simply repricing a growth story that just showed the cost of growing. That uncertainty deserves respect rather than a forecast.
FAQ
What are the key support and resistance levels for Hims & Hers Health, Inc. stock after earnings?
The key resistance sits at 32.41, just above the 200-day EMA at 32.32. The first support level is 31.02, closely tracking the 20-day EMA at 31.08. Below that, the 50-day EMA at 30.71 is the critical line separating a routine shakeout from a deeper unwind.
What does the daily chart indicate for Hims & Hers Health, Inc. stock?
The daily chart shows a neutral regime with no directional conviction. Price sits above the 20-day and 50-day EMAs but below the 200-day EMA at 32.32. RSI at 51.44 confirms the stalemate. The MACD was improving from a weak base, typical of a bottoming attempt rather than an established uptrend.
What is the bullish case for HIMS stock?
The bullish case rests on strong operating momentum—Q2 revenue exceeded $753 million, up nearly 40% year over year. The company added 300,000 net new subscribers, nearing 3 million globally. Management raised the 2026 revenue outlook to $3.1–$3.3 billion. Technically, bulls need a close above 32.41 to reclaim the 200-day EMA.
What is the bearish scenario for HIMS stock?
The bearish case centers on the sharp swing to an $86.3 million net loss from a $42.5 million profit a year earlier. A break below the 20-day EMA at 31.08 would invalidate the bullish setup. Losing the 50-day EMA at 30.71 would open the path toward the lower Bollinger Band at 25.66.
Disclaimer: This article is for informational purposes only and does not constitute financial advice, an investment recommendation, or a solicitation to buy or sell any financial instrument or cryptocurrency. The analysis provided is not indicative of future results. Investing in crypto assets and financial markets carries a high risk of capital loss. Always do your own research (DYOR) and consult a qualified financial advisor before making any decision.
Article produced with the assistance of artificial intelligence and reviewed by the editorial team.
