




Riot Platforms, Inc. stock enters this session with conflicting signals. The daily chart closed at 19.40, showing a bearish drift inside a neutral range. Yet a reported $9.1 billion AI data center lease with Anthropic sent shares up 25% after hours, rewriting the technical landscape overnight.
Summary
Key takeaways
- Riot Platforms, Inc. stock closed at 19.40 on 10 August, below both the 20-day EMA (21.32) and 50-day EMA (22.14).
- A reported $9.1 billion, 20-year AI data center lease with Anthropic covering 191MW of capacity through 2048 drove a 25% after-hours surge.
- Daily RSI stood at 41.75 with MACD negative at -0.72, signalling persistent selling pressure before the catalyst landed.
- The 200-day EMA at 19.15 acted as the final structural floor, keeping the medium-term uptrend from breaking down.
- Daily ATR at 2.29 signals extreme volatility, making level confirmation more critical than directional conviction.
The daily chart on Riot Platforms, Inc. stock: neutral shell, bearish interior
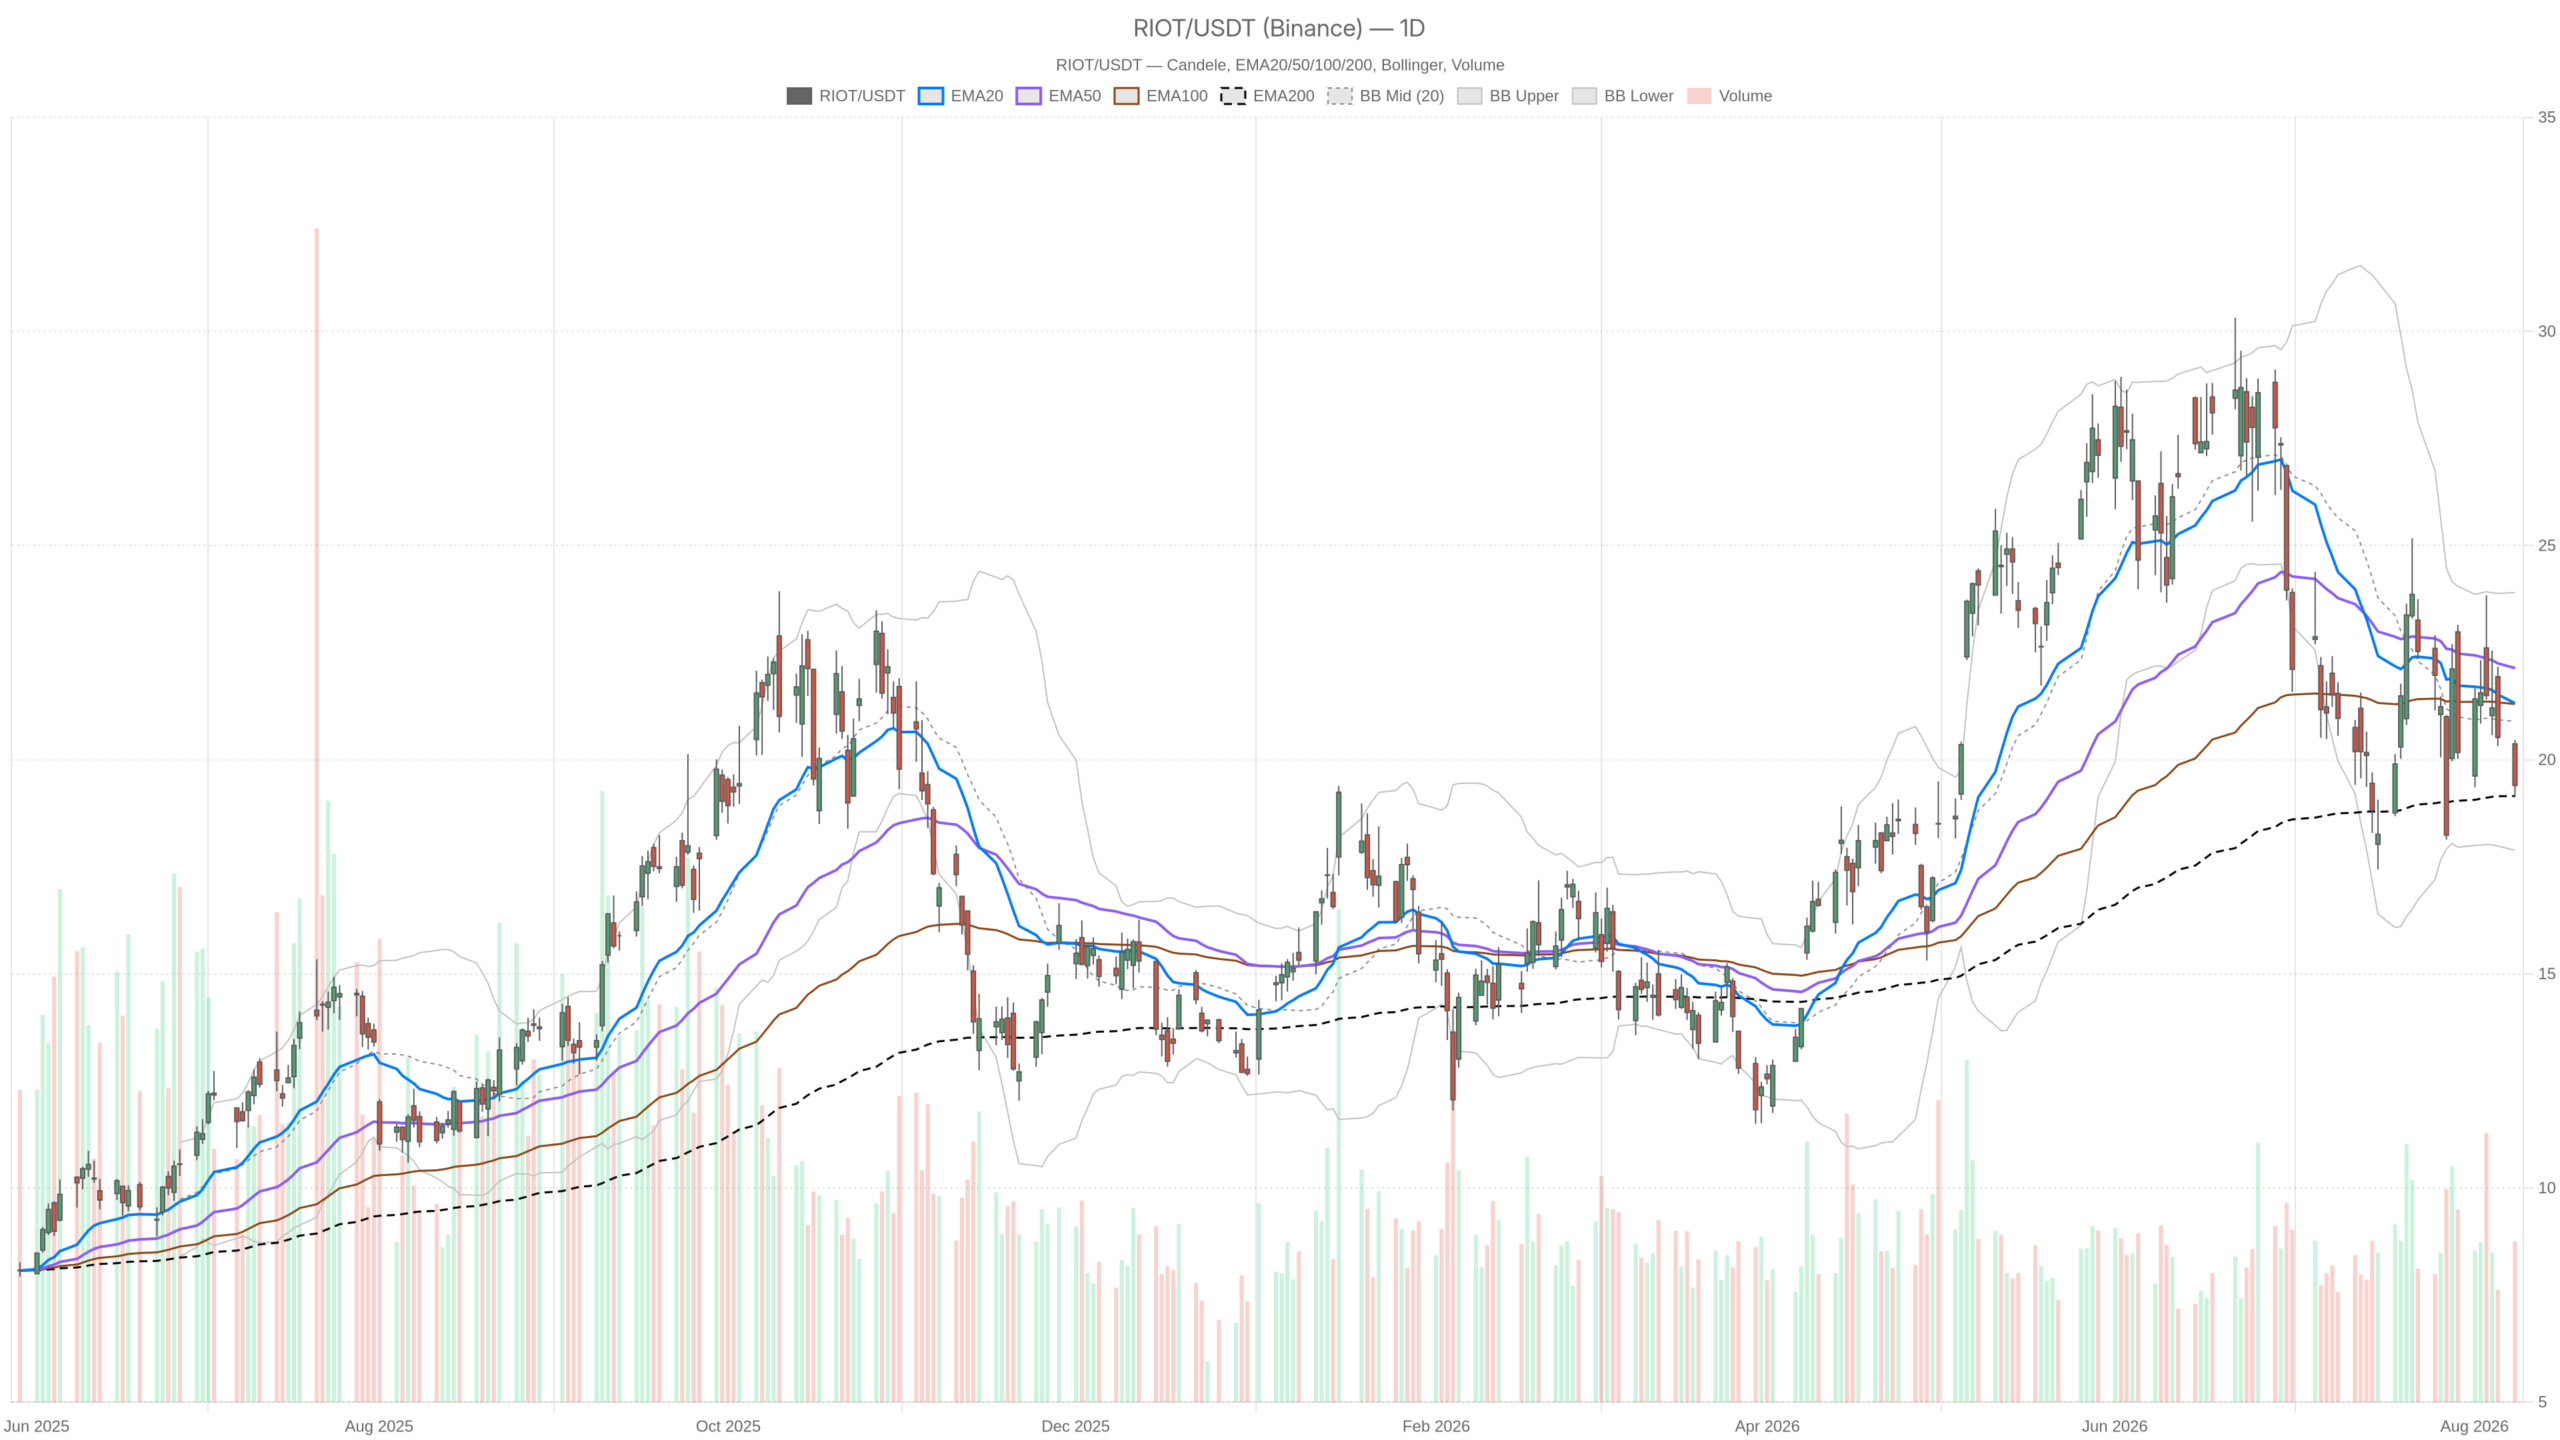
The daily chart for Riot Platforms, Inc. stock displayed a bearish drift inside a broader neutral range. Price was testing the final structural floor of the medium-term uptrend ahead of the after-hours catalyst.
The daily session was heavy. Price opened at 20.37, tested 20.46, then broke down to 19.13. It settled at 19.40 on volume above 17.5 million shares. That is a full-range rejection, not a quiet drift.
The moving average stack tells the same story. Price sits below the 20-day EMA at 21.32 and the 50-day EMA at 22.14. Those two averages themselves remain in bearish order. In contrast, the 200-day EMA at 19.15 sat just beneath Monday’s low. It was the last structural floor. In short, the stock was testing the line between correction and trend damage.
Momentum and volatility signals
Momentum was soft but not broken. Daily RSI at 41.75 shows persistent selling pressure without capitulation-level exhaustion. Meanwhile, MACD is negative at -0.72 against a -0.75 signal. However, the histogram has flipped marginally positive at +0.03. That is the earliest possible hint of downside momentum losing intensity.
Bollinger Bands frame the range: mid at 20.89, upper at 23.90, lower at 17.89. Price closed nearer the lower band than the midline. This fits the regime label of neutral rather than trending. Notably, the bands remain wide and daily ATR at 2.29 confirms it. On a roughly 19–20 handle, the stock can move more than 10% in a single session without anything unusual.
Daily pivots put the pivot point at 19.66, with resistance at 20.20 and support at 18.87. The close below the pivot was the tell going into the print.
The 1H chart confirmed the weakness — and that matters for context
The hourly chart hardened the bearish view. Sellers controlled the tape right into the close, establishing a shorts-heavy structure that tends to amplify upside gaps.
The hourly timeframe did not soften the daily view. Regime is explicitly bearish. The final candle closed at 19.37 on its low after a 19.73 high. Price is below the 20-, 50- and 200-period EMAs at 20.34, 20.92 and 21.95 respectively. Those averages are stacked cleanly downward.
Hourly RSI at 32.48 was pressing toward oversold. Meanwhile, MACD at -0.59 sat below its -0.45 signal with a negative histogram of -0.14. Intraday momentum was still deteriorating into the close, not stabilising. Hourly ATR of 0.47 and a lower band at 18.78 outlined the room available for one more flush.
This matters because it establishes how one-sided the tape was before the announcement. Any gap higher therefore lands on a shorts-heavy, momentum-negative structure. That kind of positioning tends to amplify upside gaps rather than absorb them calmly.
15m execution context
The 15-minute chart offered tight, compressed signals. It provides no useful reference for a post-news open, as its levels will almost certainly be irrelevant on the first prints.
On the 15-minute chart, the picture was tight and compressed. Bands narrowed to 19.16–19.72 around a 19.44 midline. ATR stood at just 0.19. Price closed at 19.37, marginally below the 19.54 EMA20. RSI recovered to 41.42 and the MACD histogram turned slightly positive at +0.06.
That is late-session stabilisation inside a bearish short-term structure. The 50- and 200-period EMAs at 20.05 and 21.02 remain overhead. Practically speaking, its levels — pivot 19.49, R1 19.61, S1 19.25 — will almost certainly be irrelevant on the first prints.
Bullish scenario for Riot Platforms, Inc. stock
The bullish case is now event-driven. A confirmed $9.1 billion lease reframes Riot Platforms, Inc. stock from a pure bitcoin mining proxy toward a contracted AI infrastructure landlord, supporting a durable re-rating.
The lease runs through 2048 and covers 191MW of capacity. Combined with the Q2 revenue beat, it supports a durable re-rating rather than a one-day squeeze.
Technically, the bulls need follow-through above the reclaimed moving averages. Recovering and holding the 21.32 EMA20, then the 22.14 EMA50, would repair the medium-term structure. A 25% gap would open the stock beyond the daily upper Bollinger band at 23.90. Therefore, the more meaningful test is whether buyers defend the 20.89 midline on the inevitable first pullback. Holding it would confirm that the gap is being accepted, not sold.
Bearish scenario
The bearish path is a classic gap-and-fade. News-driven spikes in high-beta names often meet immediate supply from holders trapped above 21–22. If the stock cannot hold the daily midline, the entire pre-news structure reasserts itself.
At that point, 18.87 support and the 200-day EMA at 19.15 become the decisive zone. A daily close beneath it would invalidate the bullish reading regardless of the headline. The 17.89 lower band would then come into view. On the other hand, macro context adds risk. Futures are mixed ahead of CPI. Retail sentiment on Stocktwits has cooled to neutral on SPY and turned extremely bearish on QQQ. A risk-off tape would make gap defence considerably harder.
Positioning and volatility in Riot Platforms, Inc. stock
Volatility, not direction, is the dominant variable in Riot Platforms, Inc. stock. Conflicting signals demand level confirmation over conviction, especially with CPI adding another layer of uncertainty.
Overall, the signals genuinely conflict. Daily and hourly technicals lean bearish-to-neutral. Yet they were measured before a material contract announcement that changes the earnings narrative. That is not a chart to trade mechanically.
With daily ATR at 2.29 and a 25% overnight move already priced, volatility is the dominant variable. The first genuine signal will be where the stock closes relative to 20.89 and 21.32 once the initial reaction settles. Until then, level confirmation matters more than conviction. CPI adds one more layer of uncertainty to an already unstable tape.
FAQ
What drove Riot Platforms, Inc. stock up 25% after hours?
A reported $9.1 billion, 20-year AI data center lease with Anthropic, covering 191MW of capacity through 2048, combined with a second-quarter revenue beat that exceeded expectations.
What is the key technical level to watch for Riot Platforms, Inc. stock?
The 20.89 daily Bollinger Band midline and the 21.32 EMA20 are the first levels to confirm whether the post-news gap is being accepted or sold by the market.
Is Riot Platforms, Inc. stock still primarily a bitcoin mining play?
The AI lease reframes the stock from a pure bitcoin mining proxy toward a contracted AI infrastructure landlord, potentially supporting a durable re-rating beyond crypto-driven volatility.
What happens if Riot Platforms, Inc. stock fails to hold the post-news gap?
A slide back under the 19.66 pivot and a daily close below the 200-day EMA at 19.15 would invalidate the bullish reading, bringing the 17.89 lower Bollinger band into view.
Disclaimer: This article is for informational purposes only and does not constitute financial advice, an investment recommendation, or a solicitation to buy or sell any financial instrument or cryptocurrency. The analysis provided is not indicative of future results. Investing in crypto assets and financial markets carries a high risk of capital loss. Always do your own research (DYOR) and consult a qualified financial advisor before making any decision.
Article produced with the assistance of artificial intelligence and reviewed by the editorial team.
