



Snap Inc. stock surged roughly 6% on August 4 after strong Q2 2026 earnings, closing at $5.79. Revenue hit $1.6 billion, up 19%. Daily active users reached 493 million. The rally reframes the near-term narrative. Yet the technical picture is more nuanced than the headline suggests.
Summary
Key takeaways
- SNAP closed at $5.79 on August 4, gaining roughly 6% after a Q2 2026 earnings beat
- Revenue reached $1.6 billion, up 19% year over year, with daily active users climbing to 493 million
- Daily RSI sits at 74.33, signaling overbought conditions across multiple timeframes
- Price remains below the 200-day EMA at $5.93, keeping the broader trend neutral
- The resistance zone at $5.93–$5.98 is the key level to watch for trend confirmation
Snap Inc. Stock: A Breakout That Still Faces Long-Term Resistance
Snap Inc. stock has staged a sharp breakout above short-term moving averages. However, it remains capped below the 200-day EMA at $5.93, keeping the broader trend neutral.
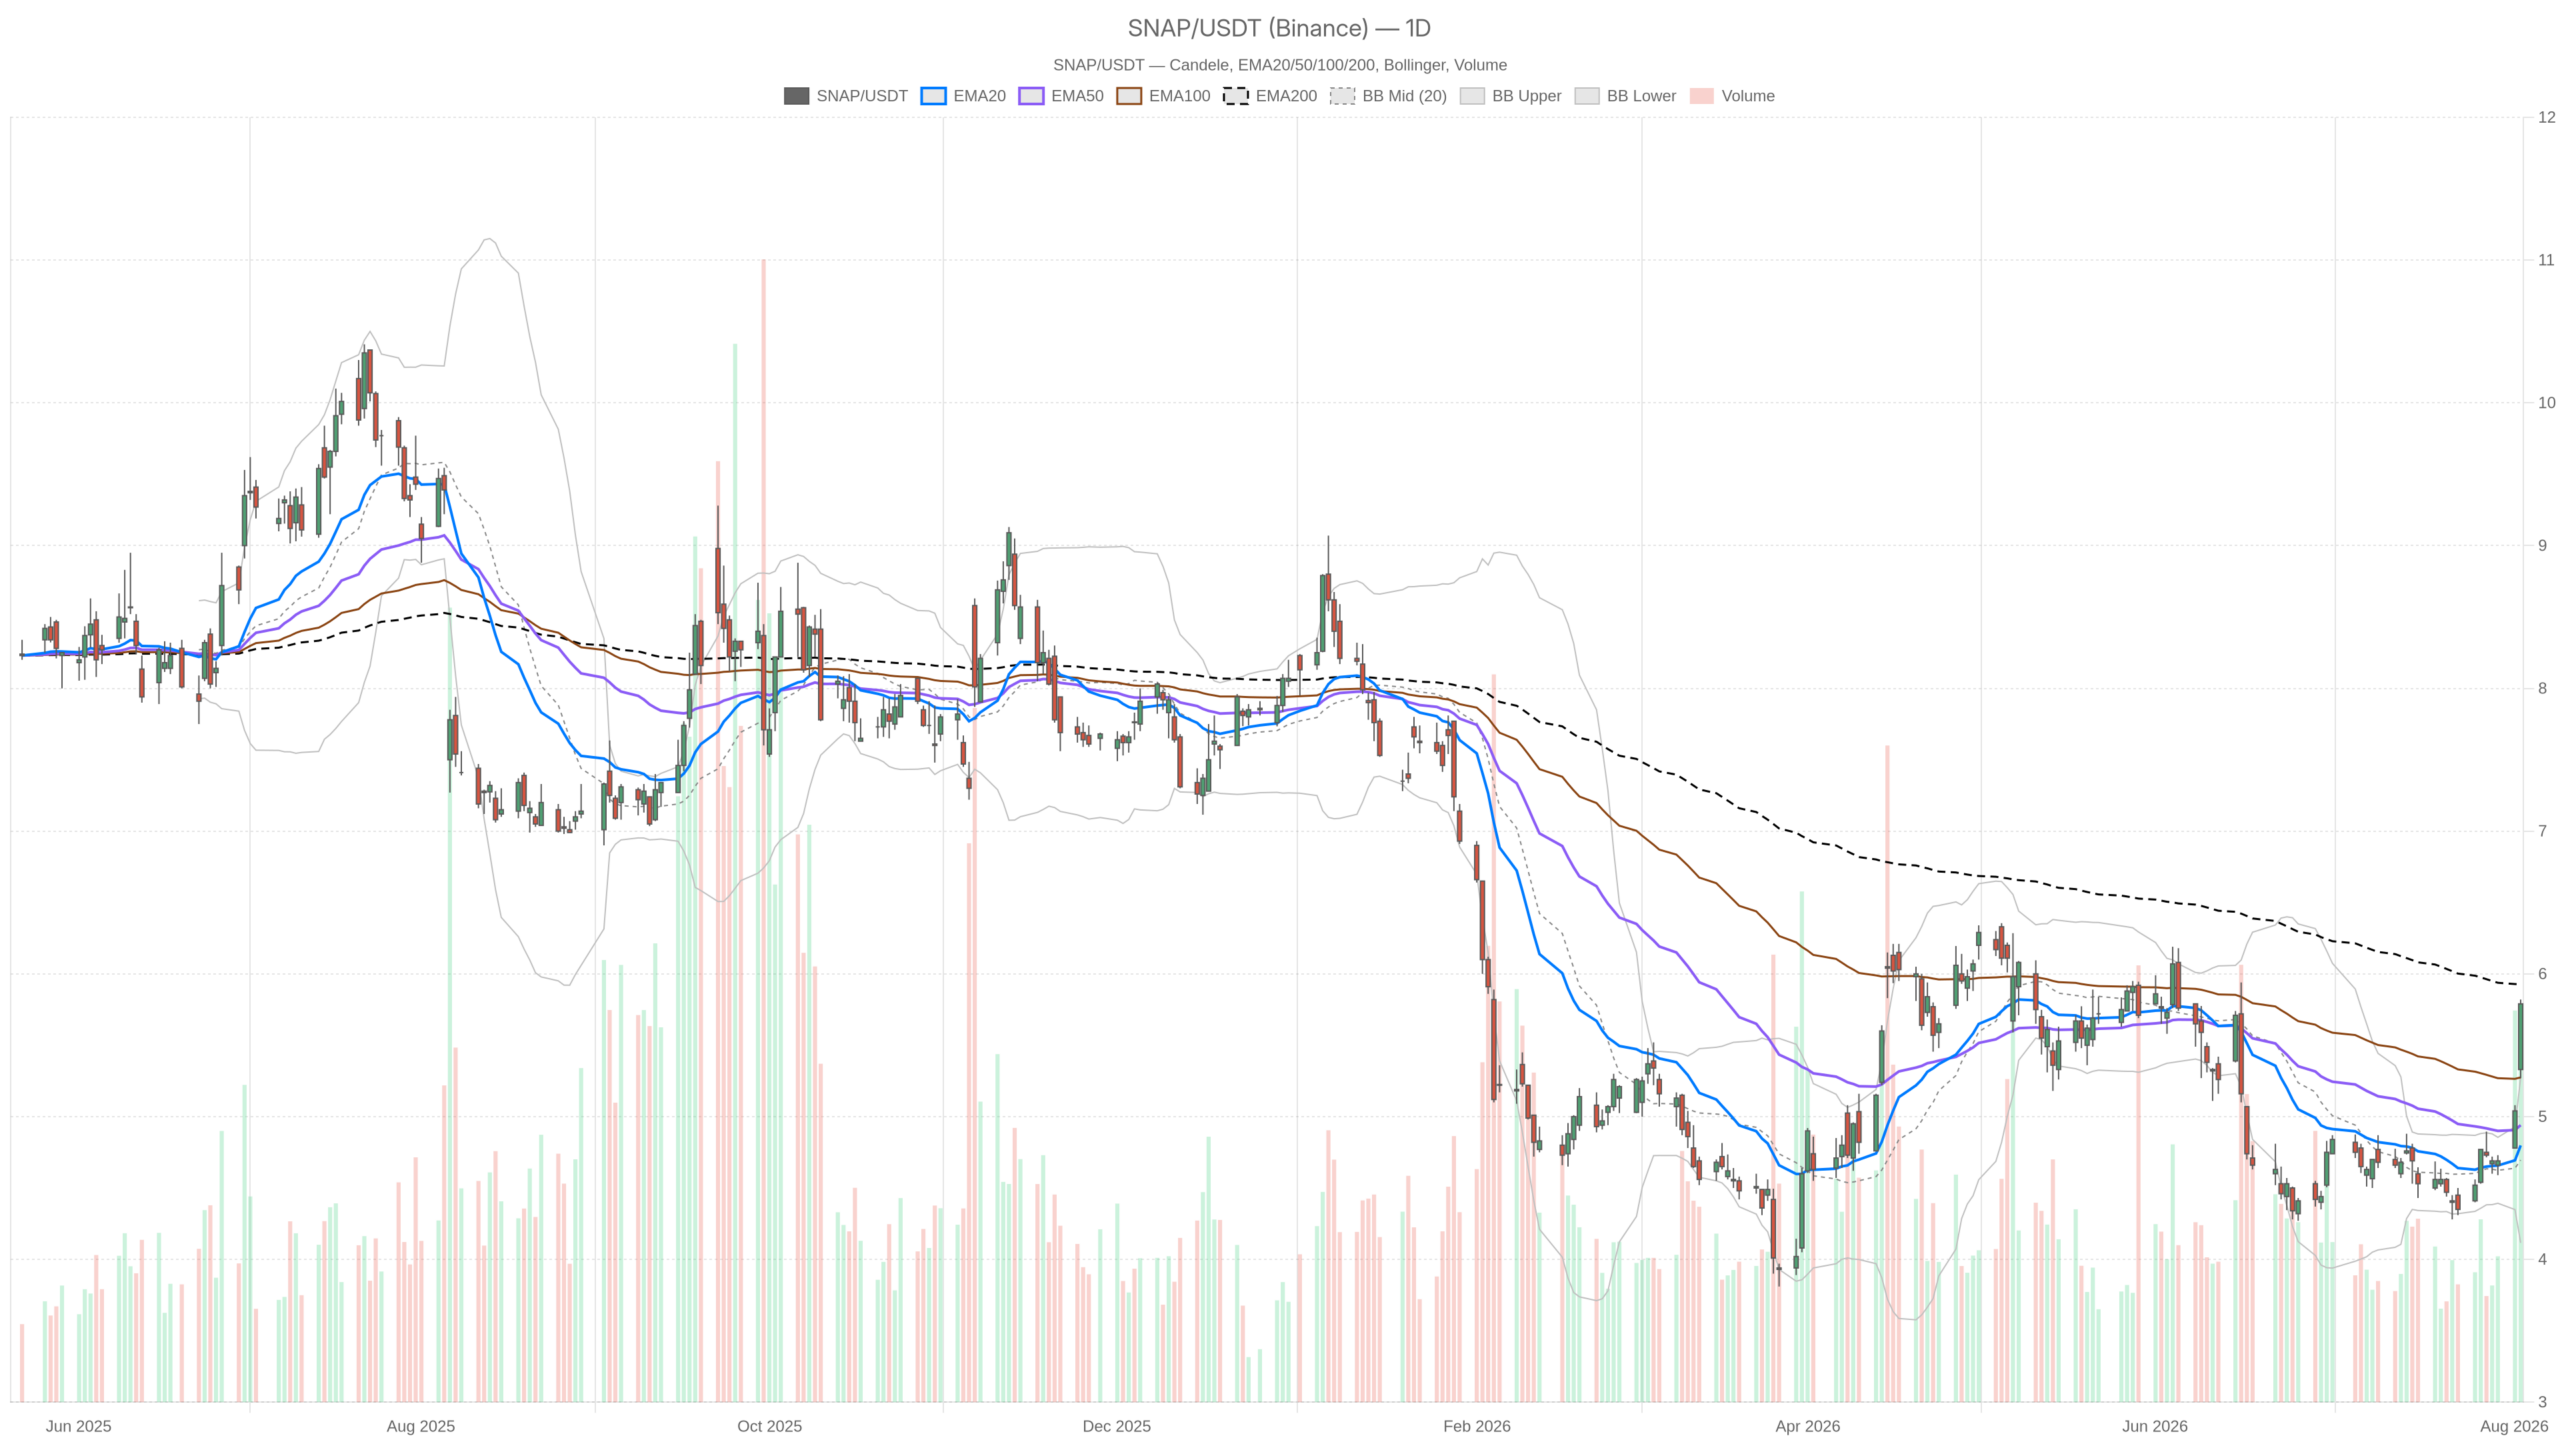
On the daily chart, price closed well above the 20-day EMA at $4.80. It also cleared the 50-day EMA at $4.94. This confirms short-term momentum has turned decisively higher. Still, the close sits below the 200-day EMA at $5.93. That means the broader trend indicator has not yet flipped bullish. The gap between short-term strength and longer-term resistance explains why the daily regime remains neutral despite the breakout.
Daily Momentum Signals
Momentum readings reinforce the sense of an overextended move. The daily RSI sits at 74.33, comfortably in overbought territory. Meanwhile, the MACD line at 0.05 has crossed above its signal line at -0.07. This produces a positive histogram of 0.13. The crossover confirms bullish momentum is building. However, the RSI level warns the move has already advanced quickly.
Adding to that picture, Tuesday’s close at $5.79 pushed above the upper Bollinger Band at $5.28. A close outside the upper band typically signals an aggressive, volatility-driven expansion. It often precedes at least a short consolidation phase.
Key Levels to Watch
The daily pivot point sits at $5.63. Resistance stands at $5.98 and support at $5.43. Price currently trades above the pivot and is closing in on R1. That level sits near the same zone where the 200-day EMA caps the chart. Therefore, the confluence around $5.93–$5.98 is likely to be the first real test of whether this rally has staying power.
Hourly Momentum Confirms the Move, But Overbought Signals Pile Up
The hourly chart confirms an active uptrend in Snap Inc. stock. Yet extreme RSI readings across both timeframes suggest the move is stretched and may need consolidation.
Turning to the hourly chart, the picture is more straightforwardly bullish. Price trades above the 20, 50, and 200-period EMAs. These sit at $5.29, $4.97, and $4.81 respectively. The hourly regime is tagged bullish. MACD on the 1H timeframe also remains positive. The line at 0.29 sits above the signal at 0.22. At the same time, RSI on this timeframe has climbed to 82.61. That extreme reading suggests the intraday move is stretched.
The hourly pivot point at $5.77 sits almost exactly at the last close. Resistance at $5.82 sits just above and support at $5.72 just below. Notably, that tight range hints at indecision right at maximum overbought pressure.
Overall, the daily and hourly timeframes agree on direction but disagree on conviction. The daily chart shows a bullish momentum shift still fighting through 200-EMA resistance. The hourly chart confirms an active uptrend. Yet it runs on stretched RSI readings across both timeframes. That combination — trend confirmation plus overbought exhaustion — is typical of a strong catalyst-driven move. It usually needs to consolidate before extending further.
15-Minute Chart: Execution Context for Snap Inc. Stock
The 15-minute chart reveals early signs of momentum fatigue in Snap Inc. stock. Short-term buyers appear to be pausing rather than reversing.
On the 15-minute chart, the story shifts toward the tape’s most recent hesitation. Price sits just under the 15m upper Bollinger Band at $5.80. The mid-band sits at $5.73. The 15m MACD histogram has turned slightly negative at -0.02. However, the line and signal remain close together at 0.10 and 0.12. That early loss of momentum, paired with RSI easing to 72.43, suggests buyers are pausing.
For traders using this timeframe purely for execution, the tight range marks the immediate battleground. The 15m pivot sits at $5.78 and resistance at $5.81.
Bullish Scenario for Snap Inc. Stock
The bullish case for Snap Inc. stock hinges on clearing the $5.93–$5.98 resistance zone. A sustained break above that area would confirm a durable trend reversal.
Fundamentally, the bullish case rests on the earnings narrative translating into sustained buying interest. Snap broadened its audience and increased ad revenue during the quarter. World Cup-related demand adds a seasonal tailwind. If price clears the daily resistance cluster near $5.98, the turnaround narrative gains technical confirmation.
Reclaiming the 200-day EMA at $5.93 as new support would add further weight. A sustained hold above that zone would open the door to a more durable trend shift. It would move beyond a one-day earnings pop.
Bearish Scenario for Snap Inc. Stock
The bearish risk for Snap Inc. stock centers on overbought exhaustion. A rejection at the $5.93–$5.98 zone could send price back toward support at $5.43.
Notably, the sheer scale of overbought readings across all three timeframes is a legitimate risk. RSI sits above 70 on the daily chart. It exceeds 82 on the hourly. And it remains above 72 on the 15-minute chart. All of this points to the same thing: this market has moved a long way, very fast.
In this context, a rejection at the $5.93–$5.98 resistance zone is the key risk. It could coincide with margin-pressure concerns raised in comparisons between Snap and larger peers like Meta. That scenario could send price back toward the daily pivot at $5.63. It might fall further to support at $5.43.
A break below the daily EMA20/EMA50 cluster near $4.80–$4.94 would invalidate the bullish thesis entirely. That would reopen the prior downtrend structure.
Closing Take on Snap Inc. Stock
Snap Inc. stock sits at an inflection point. A genuinely strong earnings print meets a market that has already priced in much of the good news.
Volatility remains elevated relative to recent sessions. The daily ATR of $0.25 stands well above the hourly ATR of just $0.14. That gap itself signals unusual uncertainty around the next move. Positioning here should account for both the strength of the catalyst and the exhaustion visible in momentum indicators. Meanwhile, the $5.93–$5.98 resistance zone remains the level to watch. Only a decisive break above that zone would support firmer conclusions. It would confirm whether this breakout can evolve into a lasting trend reversal.
FAQ
What drove Snap Inc. stock higher on August 4?
Snap Inc. stock surged roughly 6% after the company reported strong Q2 2026 earnings. Revenue reached $1.6 billion, up 19% year over year. Daily active users climbed to 493 million. Analysts also noted World Cup-related ad demand as a contributing factor.
Is Snap Inc. stock overbought after the rally?
Yes. The daily RSI sits at 74.33, the hourly RSI has climbed to 82.61, and the 15-minute RSI remains at 72.43. These readings across multiple timeframes suggest the move is stretched and may need consolidation before extending further.
What is the key resistance level for Snap Inc. stock?
The critical resistance zone sits between $5.93 and $5.98. This area aligns with the 200-day EMA at $5.93 and the daily R1 pivot at $5.98. A sustained break above this zone would confirm a more durable trend reversal.
What happens if Snap Inc. stock fails at resistance?
A rejection at the $5.93–$5.98 zone could send price back toward the daily pivot at $5.63. Further downside could reach support at $5.43. A break below the EMA20/EMA50 cluster near $4.80–$4.94 would invalidate the bullish thesis and reopen the prior downtrend.
Disclaimer: This article is for informational purposes only and does not constitute financial advice, an investment recommendation, or a solicitation to buy or sell any financial instrument or cryptocurrency. The analysis provided is not indicative of future results. Investing in crypto assets and financial markets carries a high risk of capital loss. Always do your own research (DYOR) and consult a qualified financial advisor before making any decision.
Article produced with the assistance of artificial intelligence and reviewed by the editorial team.
