

Snap stock finds itself at a critical juncture. While fundamental factors such as the recent S&P credit upgrade, an augmented AR push, and expanding reach into India suggest positive momentum, the technical outlook remains tentative. Trading near $5.76, SNAP faces a cautious market that has yet to confirm these developments.
Summary
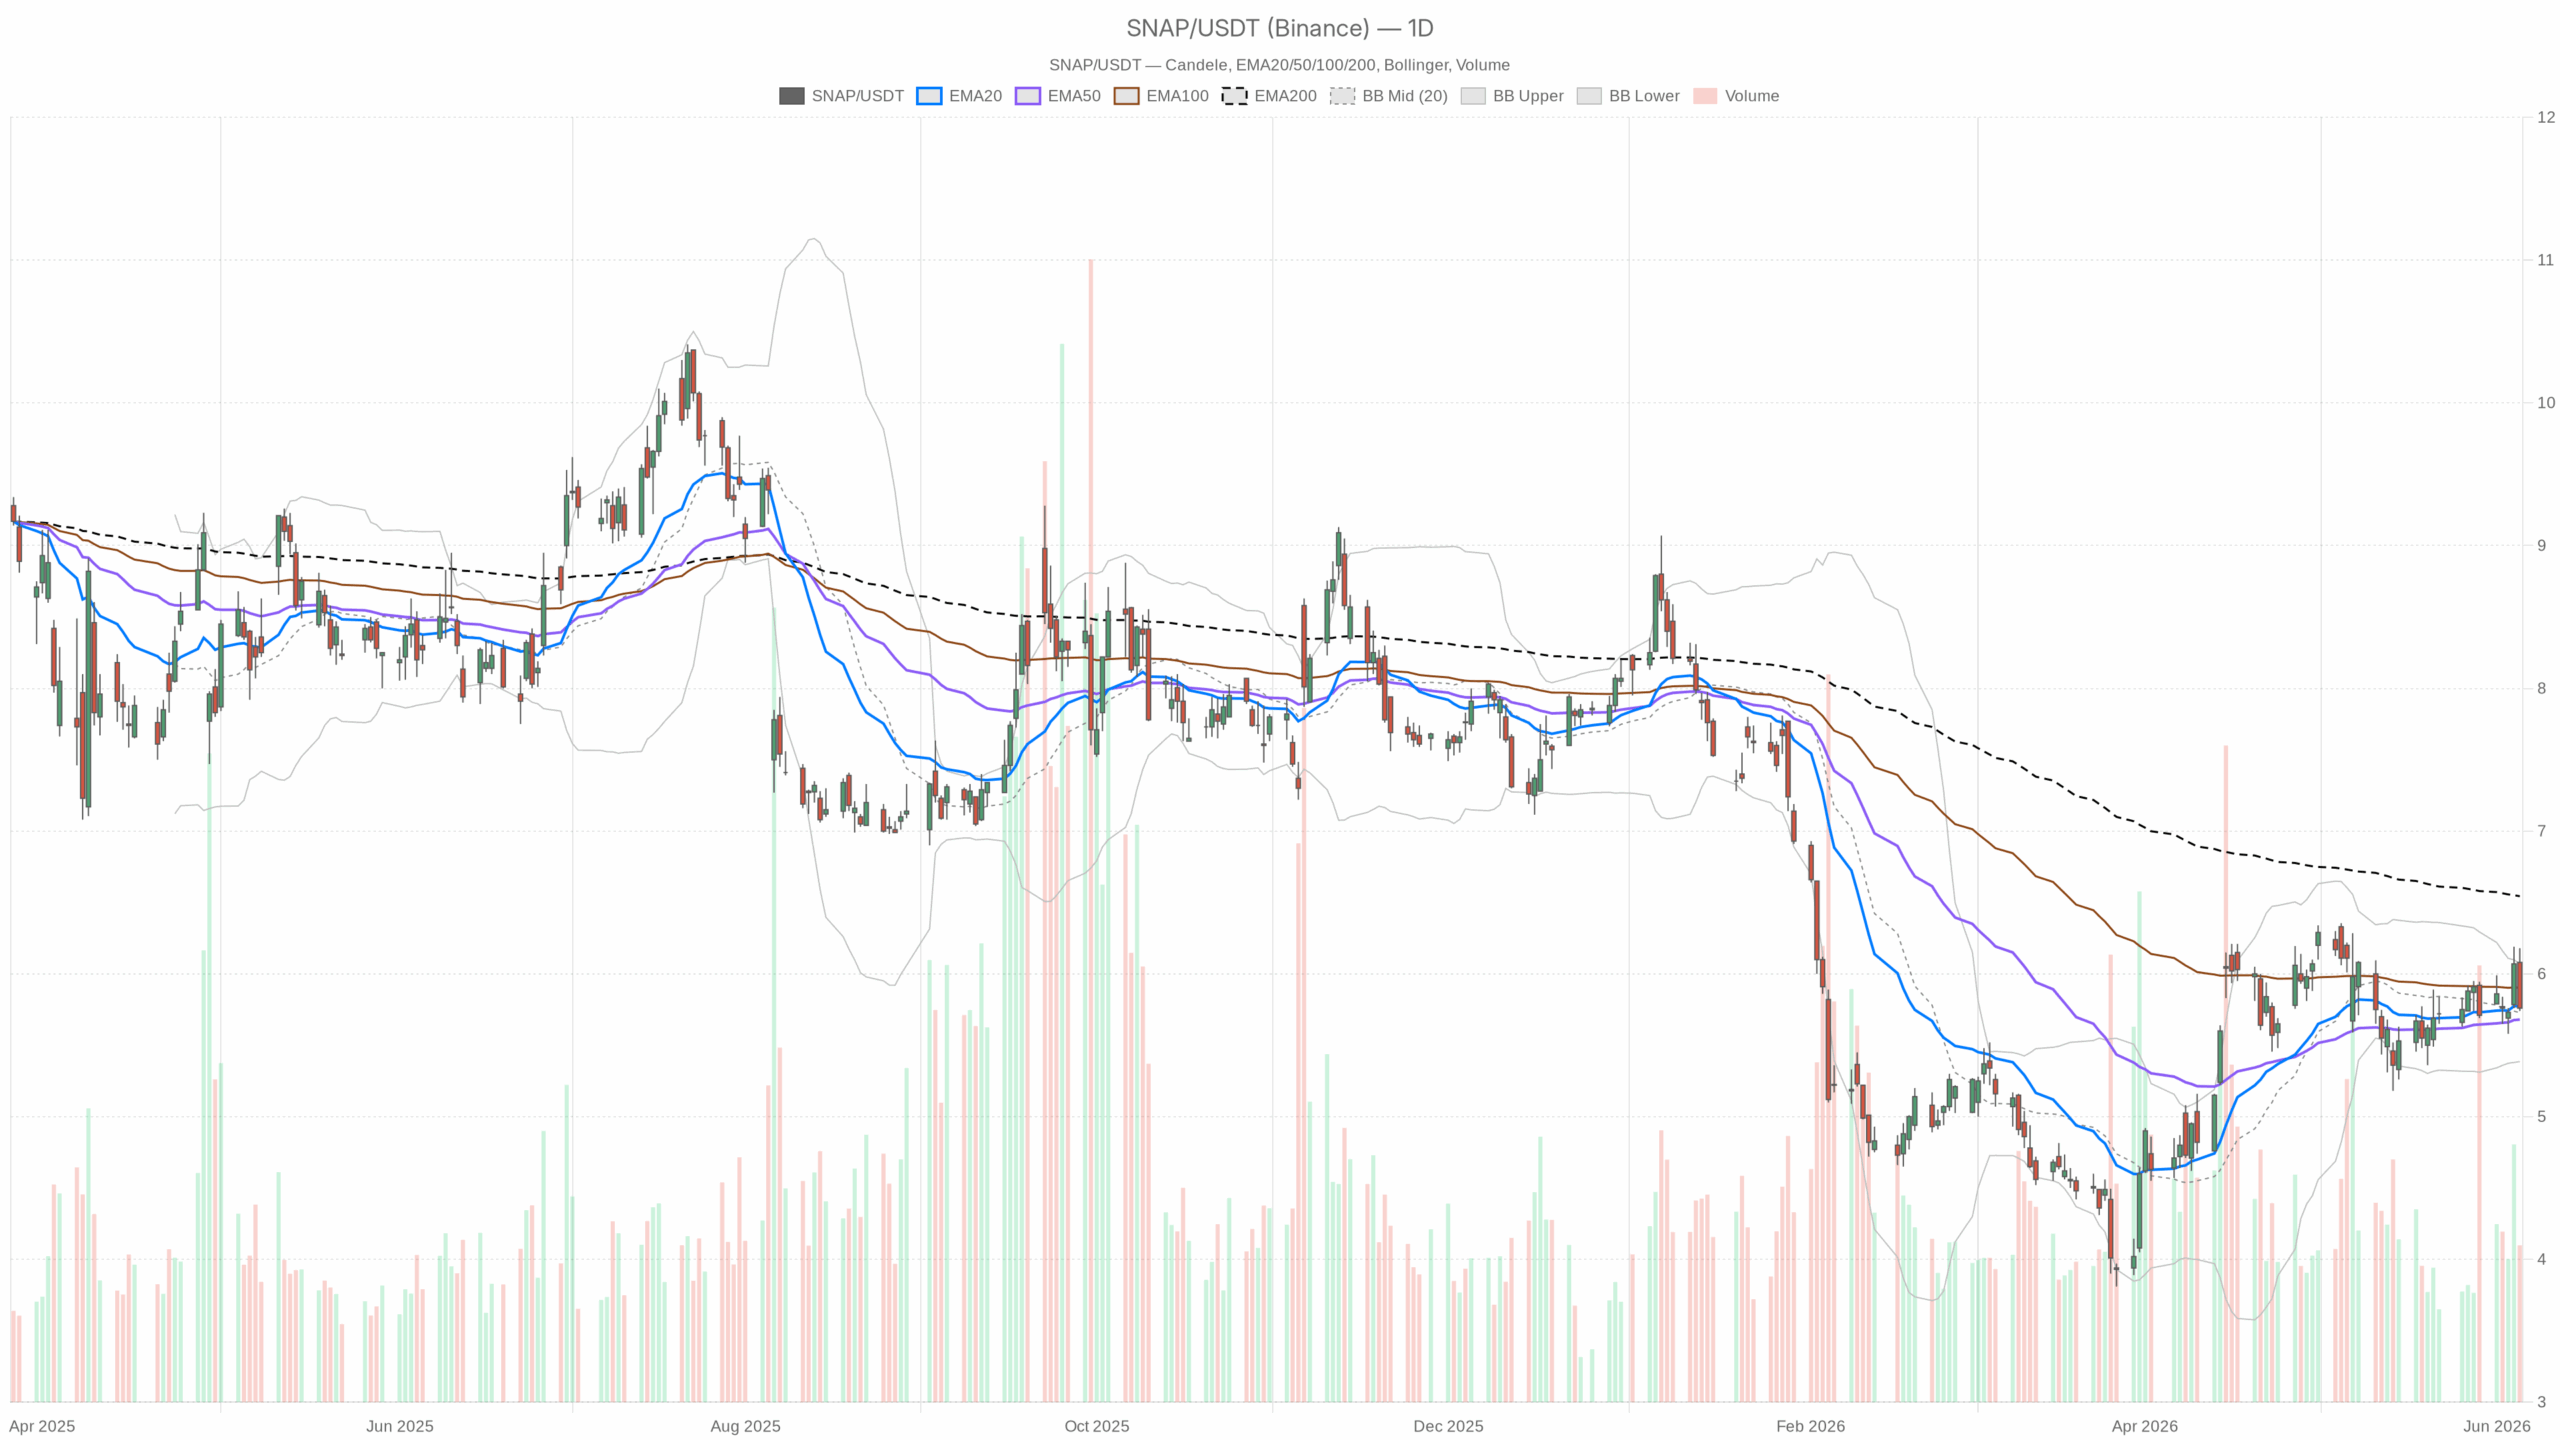
Technical Overview of Snap Stock Price Action
The daily chart reflects this indecision. On June 5, SNAP closed at $5.76, close to its daily low of $5.74 after briefly reaching $6.18 intraday. The rejection near the upper Bollinger Band at $6.07 indicates seller resistance, mitigating the initial optimism following the credit upgrade. Closing below the $5.89 pivot underlines the bulls’ inability to sustain upward pressure.
Daily Moving Averages Indicate Structural Challenges
On the daily timeframe, the EMA20 at $5.77 and EMA50 at $5.68 lie below the current price, implying modest short-term support. However, the EMA200, positioned at $6.54, remains a significant overhead barrier. This persistent gap underscores the depth of prior deterioration and the effort required to reclaim long-term bullish control.
Momentum Indicators Signal Neutral Territory
The daily RSI reads 50.51, precisely neutral, showing neither overbought nor oversold conditions. Meanwhile, the MACD line at 0.05 and signal at 0.06, accompanied by a near-zero histogram, reveal absent directional momentum. Collectively, these indicators portray a market in pause rather than trend.
Intraday Momentum and Trend Dynamics
Hourly Chart Reflects Mild Bearish Sentiment
Shifting to the 1-hour timeframe, the momentum weakens. The RSI slipped below midpoint to 44.54, with the MACD histogram slightly negative at -0.02. Furthermore, the price trading below the hourly EMA20 ($5.85) and EMA50 ($5.82) indicates a short-term bearish tendency. Nonetheless, the hourly EMA200 at $5.72 provides minimal support just beneath current prices.
15-Minute Frame Shows Potential Short-Term Stabilization
In contrast, the 15-minute chart suggests some stabilization. Here, the MACD histogram recovers to zero from negative levels, while the RSI at 37.97 nears oversold conditions. This could spur near-term buying interest around $5.73, a confluence point serving as pivot support on both 15-minute and hourly charts. However, the bearish EMA configuration (EMA20 at $5.81 below EMA50 at $5.86 and EMA200 at $5.82) implies any bounce may encounter swift resistance.
Volatility Context and Execution Considerations
The daily ATR reading of $0.27 indicates Snap stock can experience meaningful intraday fluctuations, roughly 4.7% of its price. The June 5 session’s range from $5.74 to $6.18 validates this heightened volatility. However, a narrower hourly ATR of $0.12 limits immediate trading windows, requiring precise timing.
Fundamental Drivers Supporting Snap Stock
The bullish narrative centers on key fundamental enhancements. The S&P upgrade to BB- with a positive outlook reduces borrowing costs and signals improved financial health. The Illumix acquisition adds AR capabilities aligned with Snap’s hardware ambitions, potentially diversifying revenue beyond advertising. Coupled with Snapchat’s reported 250 million monthly active users in India, these factors anchor a compelling growth story. If market sentiment responds, resistance near $6.05 and then the upper Bollinger Band at $6.07 could be tested, with a decisive break opening a run towards the EMA200 at $6.54.
Risks and Bearish Technical Signals
Conversely, downside risks remain prominent. Failure to close above $5.89, despite positive fundamentals, conveys caution. A breach below the $5.73 pivot on rising volume could expose the lower Bollinger Band around $5.39 as the next support. The substantial EMA200 resistance and flat daily MACD momentum reveal a lack of technical impetus. A worsening risk sentiment on broader markets might easily offset the fundamental positives.
Conclusion: Snap Stock Stands at a Technical and Fundamental Crossroads
Overall, snap stock exhibits a mixed outlook. While recent fundamental developments are encouraging, technical indicators show hesitation. Momentum is flat on daily charts, mildly bearish intraday, and the price remains below critical pivots. Volatility is sufficient to penalize missteps in timing. Until SNAP consistently trades above $5.89 and clears $6.07 with conviction, the market’s cautious stance remains the most reliable signal.