

Summary
Walmart Stock Faces Bearish Pressure with Short-Term Recovery Hopes
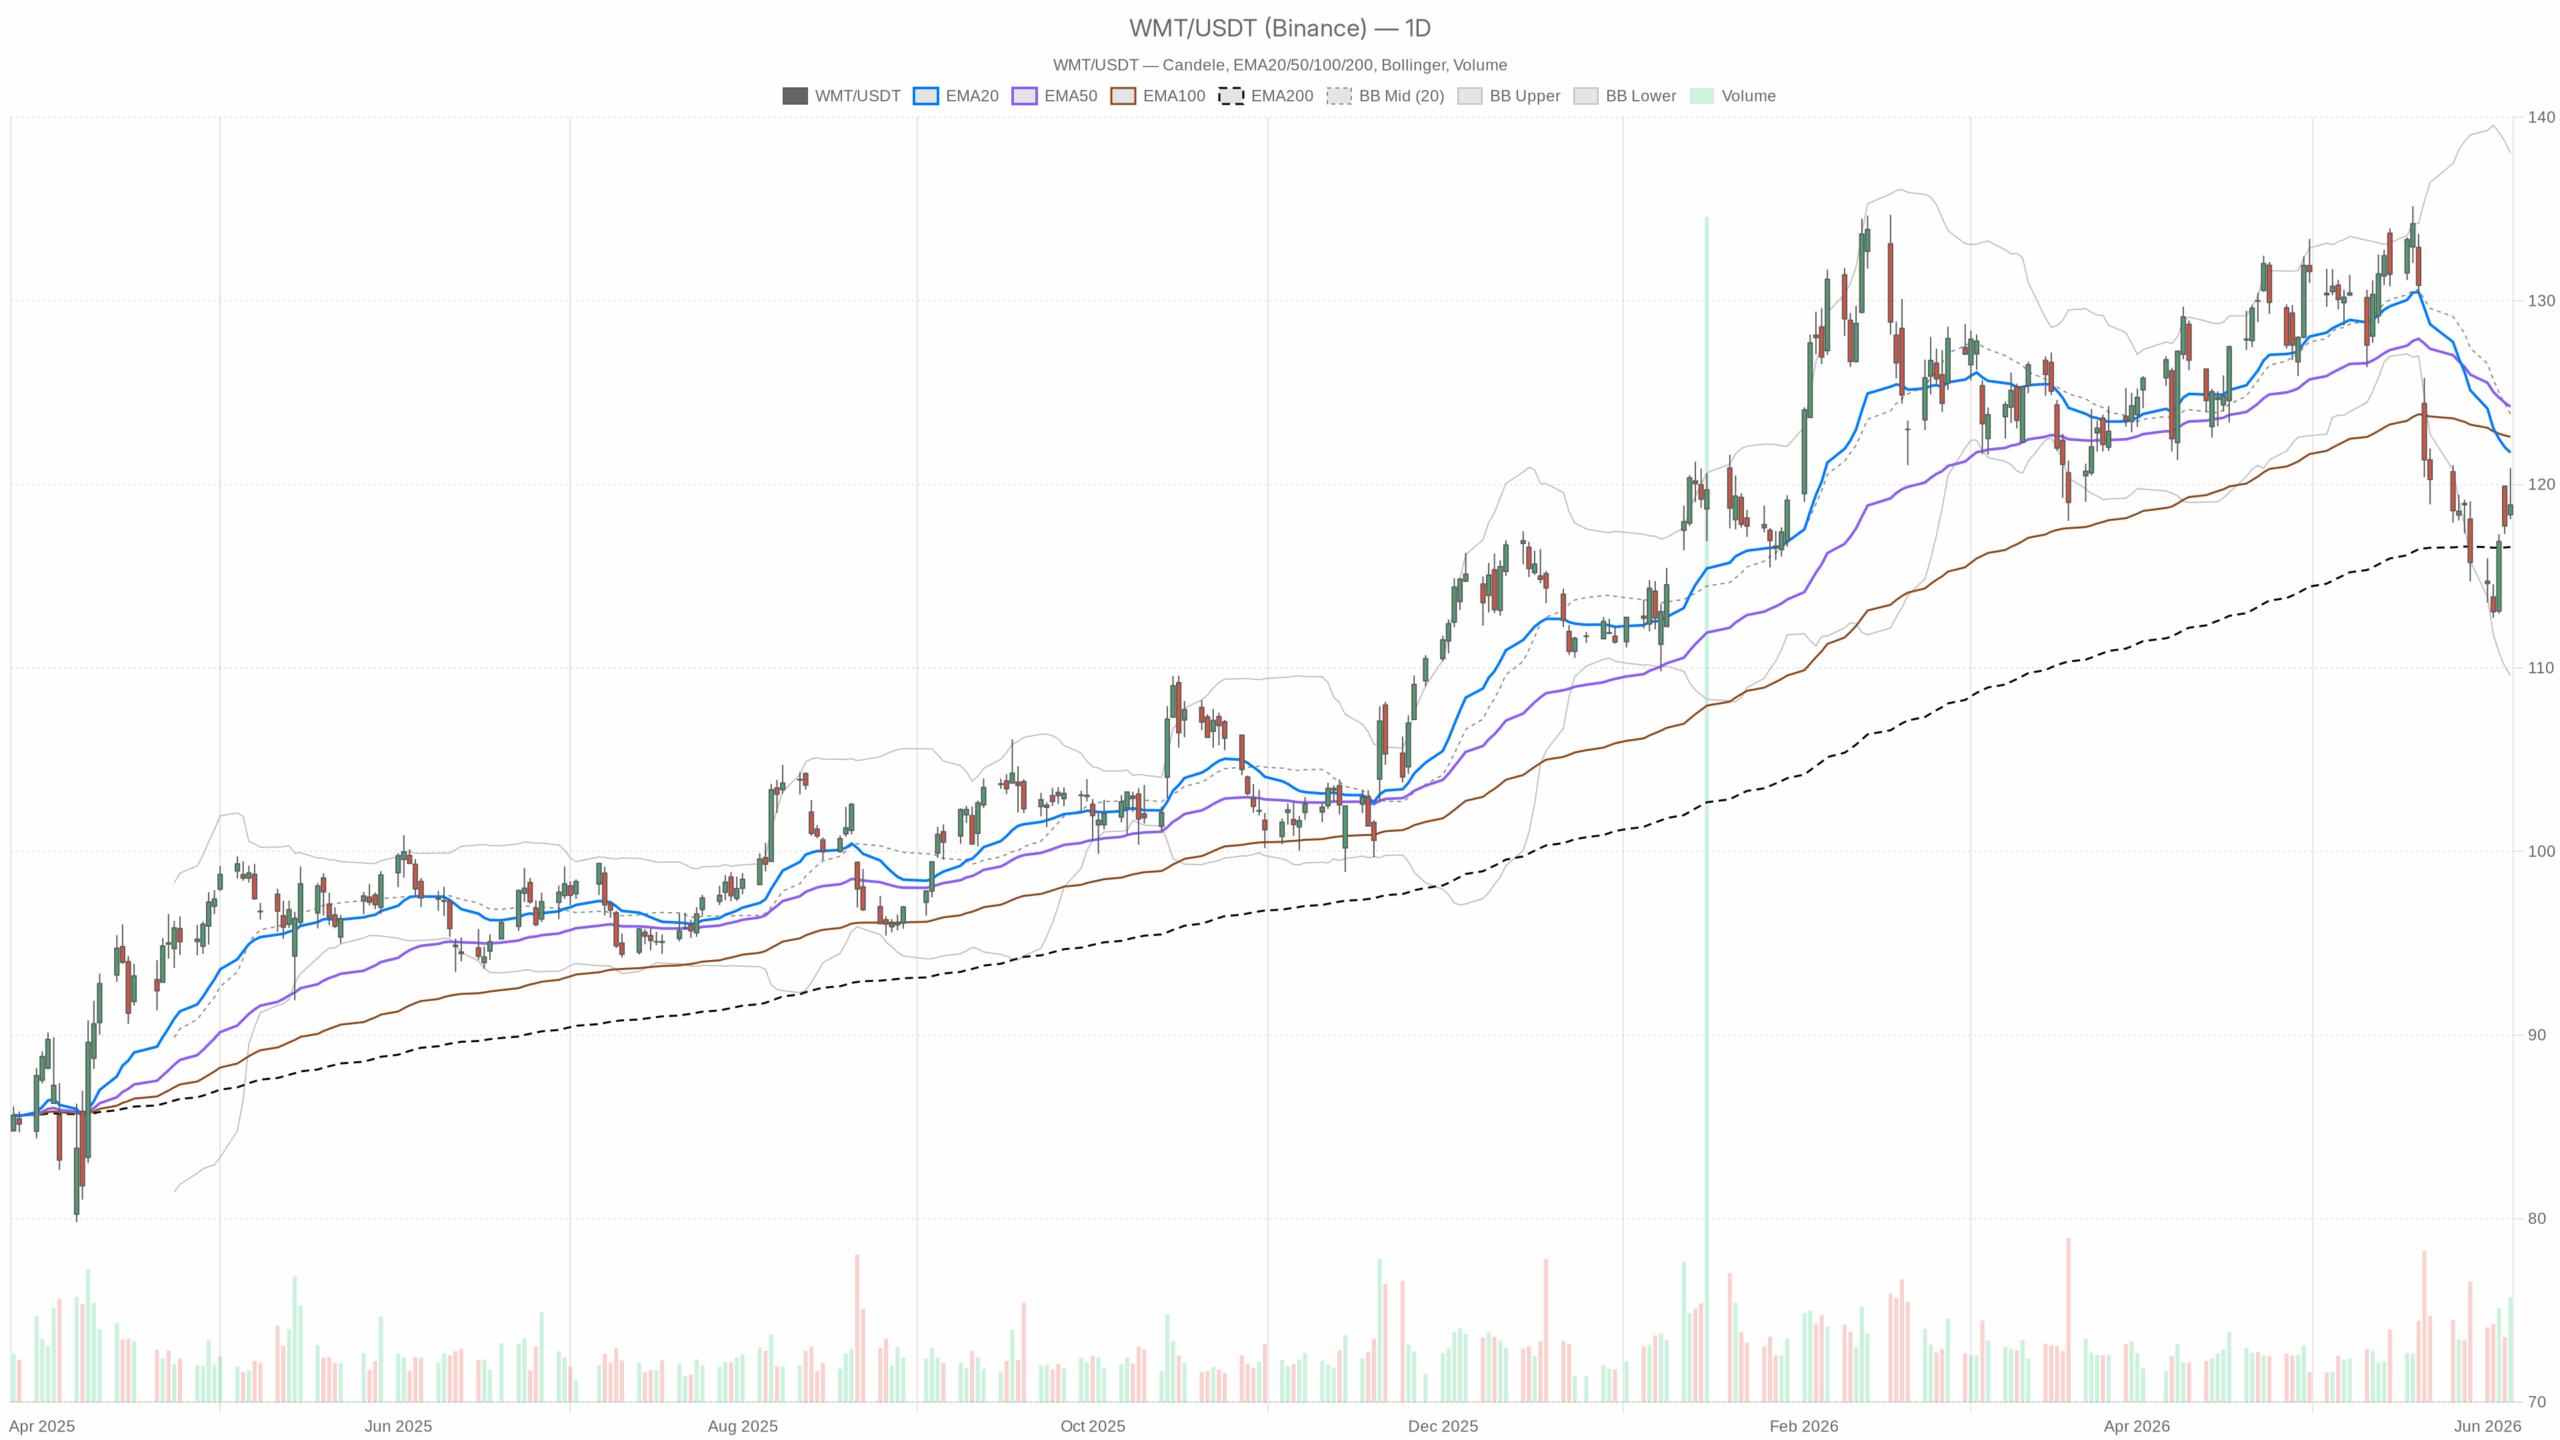
Walmart stock is navigating a difficult technical landscape. After a sharp 12% pullback in May, WMT closed at $118.88 on June 5 — still trading below key moving averages on the daily chart. The overall bias remains bearish, although intraday momentum is staging a modest recovery attempt, highlighting a timeframe conflict that warrants close attention.
Daily Chart Shows Bearish Momentum for Walmart Stock
The daily chart presents clear selling pressure. The 20-day EMA at $121.73 and the 50-day EMA at $124.24 lie well above the current price, creating a stacked resistance that Walmart stock has yet to seriously challenge. One positive is the 200-day EMA at $116.59, positioned below price, providing a medium-term support floor. Essentially, WMT is trapped between this long-term support and a strong overhead resistance zone — a structurally vulnerable position.
Indicator Analysis Highlights Downside Risks
The daily RSI at 41.27 sits in bearish territory but has not reached oversold extremes, indicating no exhaustion signal to support a reversal. Momentum could weaken further before buyers gain technical confidence. Daily MACD readings corroborate this, with the MACD line at -3.29 below the signal at -2.55 and a widening negative histogram of -0.74. Selling pressure on the daily timeframe remains dominant.
Volatility and Support Levels Amplify Caution
Bollinger Bands place the daily midline at $123.83, firmly above the current price, with WMT hugging the lower half of the range. The lower band at $109.60 lies about $9 below price, suggesting the move is not yet stretched. An ATR of 3.45 points to elevated daily volatility, consistent with a post-earnings environment. Pivot analysis yields a daily pivot at $119.29, resistance (R1) at $120.48, and support (S1) at $117.69. Friday’s close just below pivot implies a defensive stance ahead.
Intraday Charts Show Contrasting Recovery Signals in Walmart Stock
On the hourly chart, the tone shifts as WMT trades at $118.90, above the 1H EMA20 ($118.36) and EMA50 ($118.13). This alignment signals short-term buyer control. The 1H MACD is positive, with its line at 1.02 outperforming the 0.89 signal line. The hourly RSI at 55.71 confirms a neutral-to-bullish intraday momentum. This suggests a genuine recovery attempt within an otherwise bearish daily setup.
Resistance Zones Challenge Intraday Rally
However, the 1H EMA200 at $123.08 acts as a strong ceiling, coinciding with the daily EMA cluster. This indicates that any intraday rally faces stiff resistance between $121 and $124. The 1H Bollinger upper band at $121.23 marks the immediate overhead barrier. A clear move above this level would signal that the intraday recovery is gaining meaningful traction beyond typical noise.
Short-Term Momentum Shows Signs of Fading
The 15-minute chart tempers optimism. Price closed at $118.90, below the 15m EMA20 ($119.80) and Bollinger midline ($120.12). The 15m RSI at 40.45 and a negative MACD histogram of -0.24 (after signal line crossover) point to fading near-term momentum. Despite earlier gains, this suggests the bounce could be losing steam even as the hourly structure remains constructive.
Fundamental Context for Walmart Stock Outlook
Walmart’s fiscal Q1 2027 results showed improvement; however, the market response was a 12% decline in May. This suggests expectations were high and the execution was perceived as short of them. Analysts remain constructive, with some forecasting at least 25% upside within a year. One notable buy level is around $115, highlighting WMT’s appeal as a defensive stock. Institutional interest is strong, with 99 hedge fund holders as of Q1 2026 and broad portfolio inclusion. In addition, Walmart’s growing retail media platform signals a growth aspect possibly underappreciated by the market.
Key Levels Define Bullish and Bearish Scenarios for Walmart Stock
The bullish path requires Walmart stock to first reclaim the daily pivot at $119.29 on a closing basis, then challenge resistance at $120.48 (R1). Sustaining gains above the daily 20-day EMA at $121.73 would shift the bias to neutral and open a route toward the 50-day EMA near $124. Confirmation would come from the RSI moving above 50, a flattening MACD histogram, and continued institutional accumulation near the $115–$117 zone.
Conversely, the bearish scenario remains more likely for now. Failure to hold daily support at $117.69 (S1) would shift focus to the 200-day EMA at $116.59 and the analyst-identified $115 support floor. A daily close below $116, coupled with declining RSI and no MACD improvement, would reject any near-term recovery thesis. The fading momentum on the 15-minute chart corroborates the lack of buyer commitment at current levels.
Conclusion: Walmart Stock Stands at a Critical Crossroads
Walmart stock faces a pivotal yet precarious juncture. The daily outlook remains bearish, while intraday patterns suggest tentative recovery. Meanwhile, very short-term indicators warn against overly optimistic bets. Elevated volatility heightens the risk of sharp moves in either direction. Successful positioning requires discipline, balancing the risk of a failed bounce against the potential for a confirmed reversal that the market has yet to validate.