

Aurora Stock (AUR) faces significant bearish pressure as it tests critical support levels. The stock closed at $6.31 on June 5, pressing against the lower Bollinger Band and trading below the 20-day EMA. Despite longer-term structures remaining intact, near-term momentum is weakening sharply.
Summary
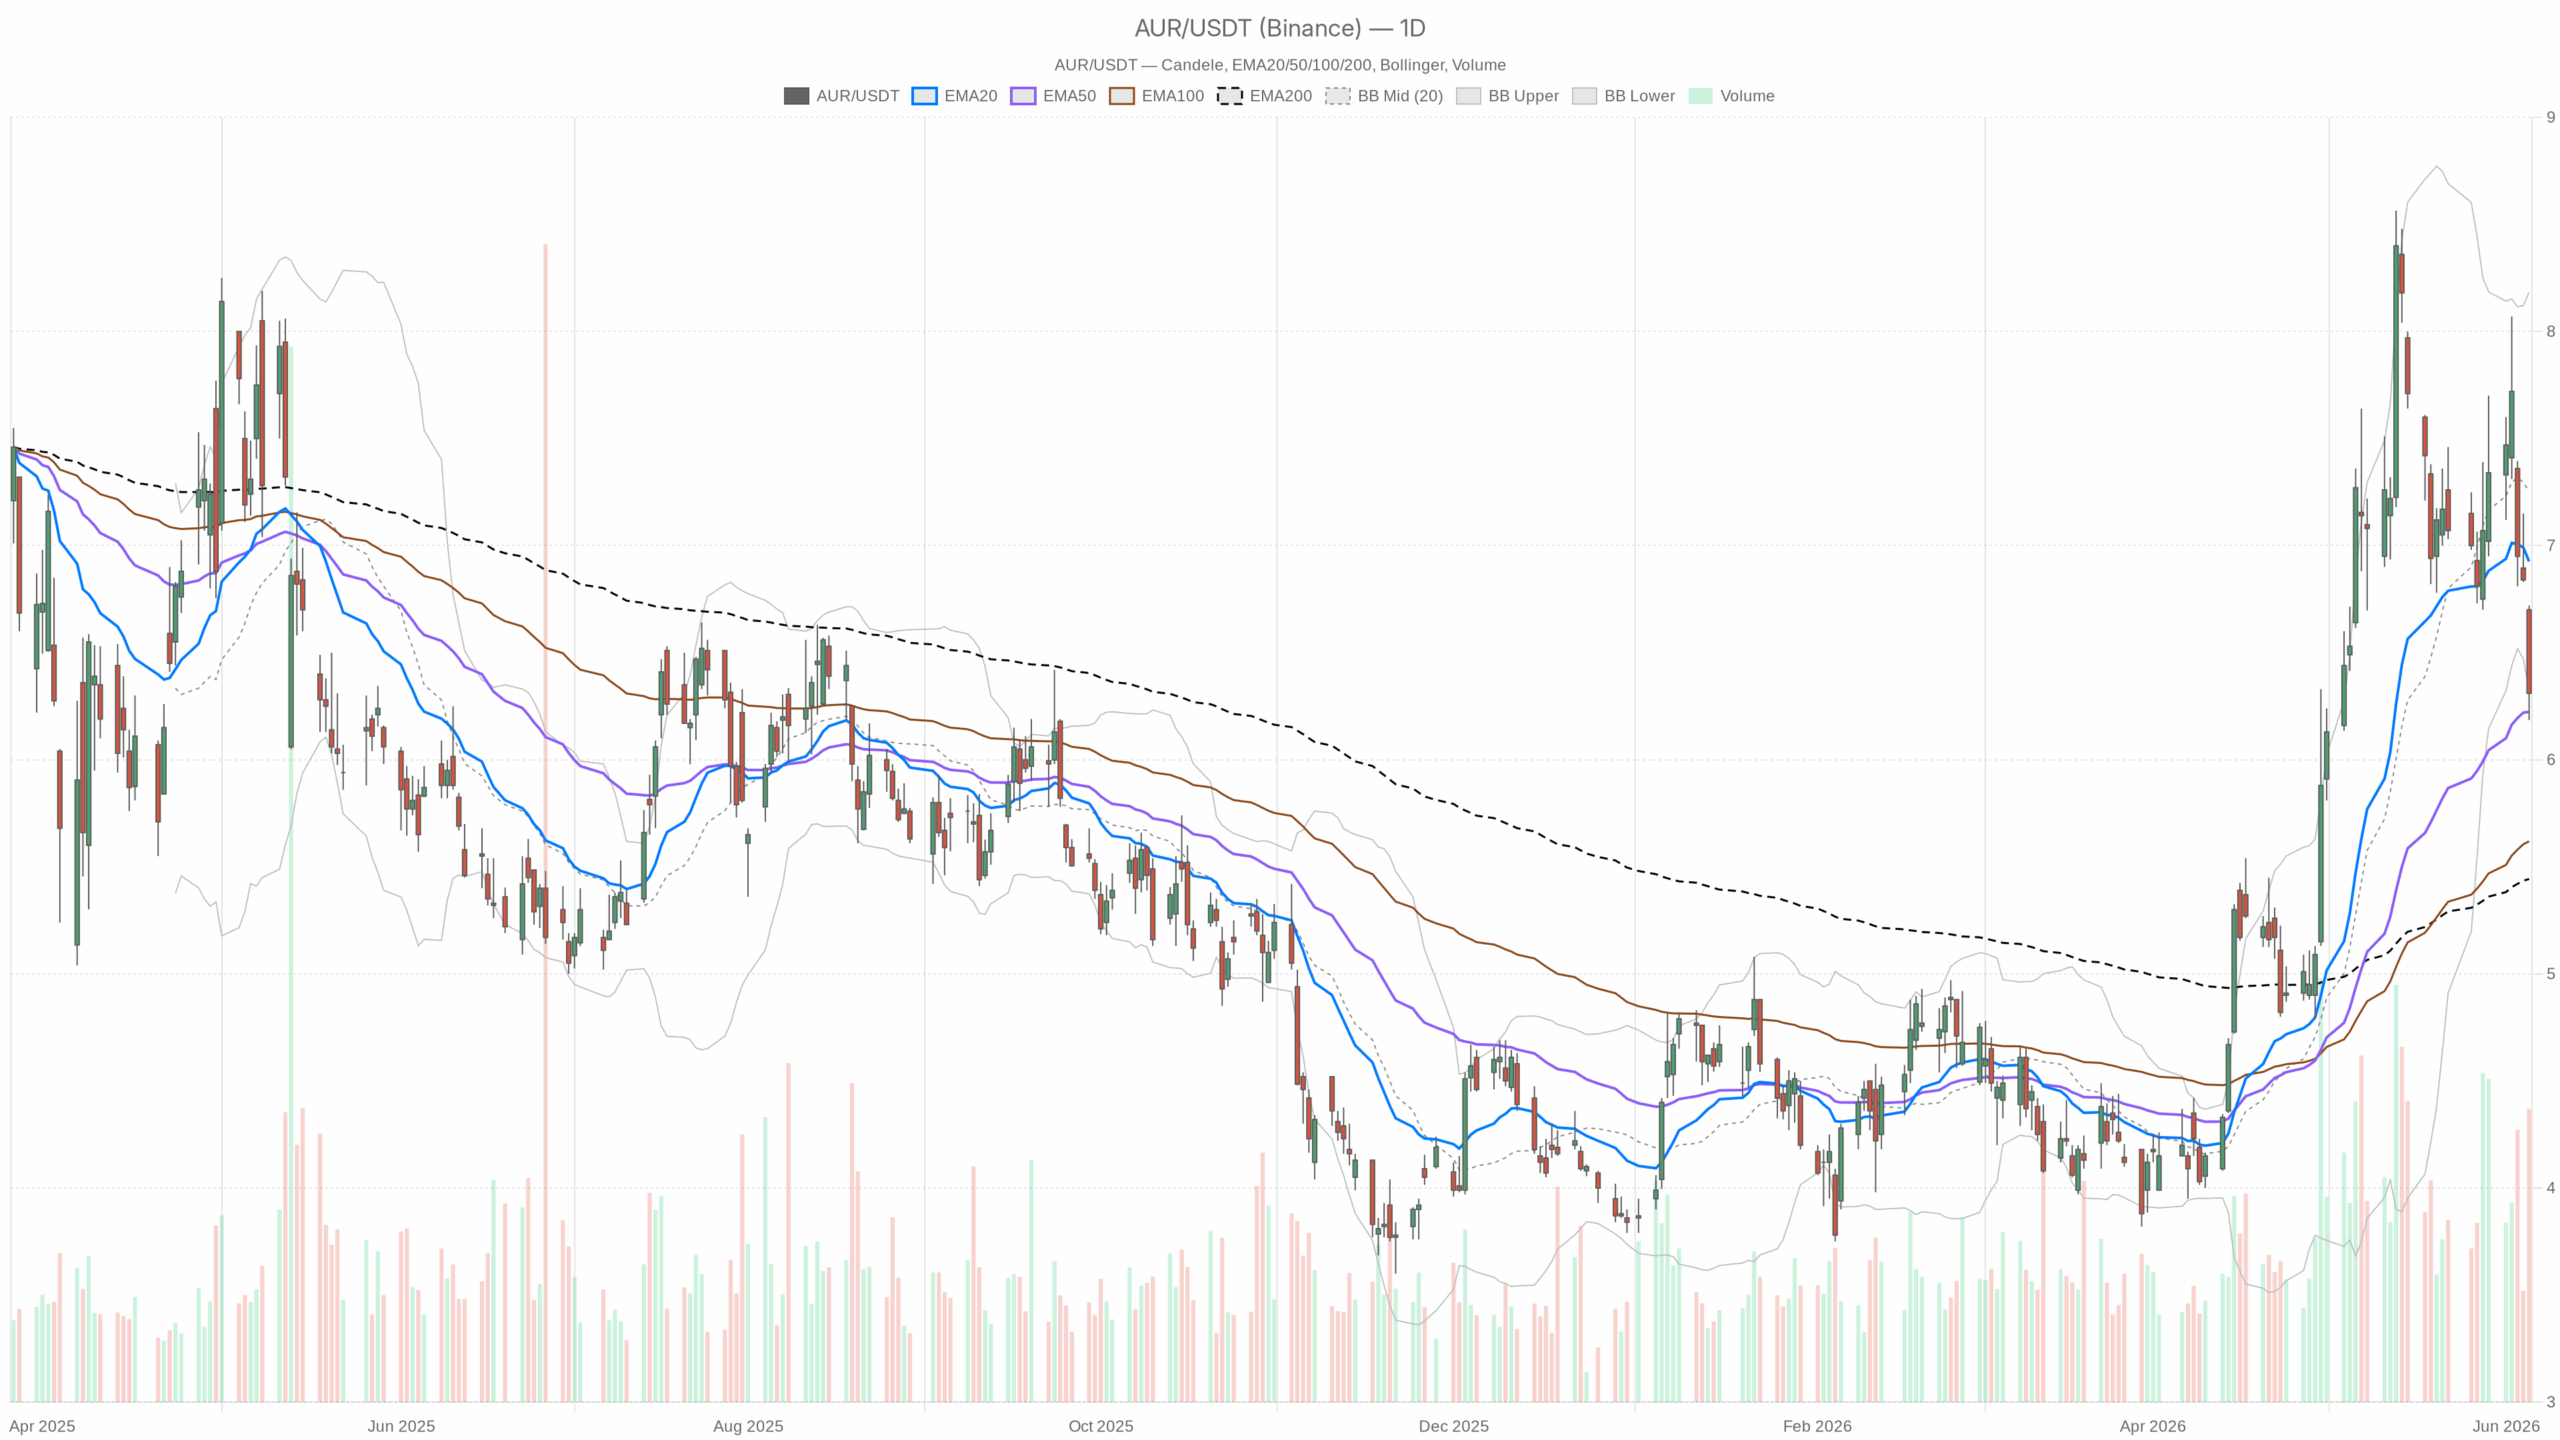
Daily Timeframe Analysis of Aurora Stock: Neutral Regime with Weakening Momentum
The daily RSI at 43.85 signals sellers’ control without reaching oversold levels, showing room for further decline before exhaustion. Meanwhile, the MACD indicates a clear bearish cross with a negative histogram reading -0.17, marking decelerating momentum and no signs of strong buyer accumulation.
Price is below the EMA20 at $6.93 but remains above the EMA50 at $6.22, which has acted as a dynamic floor. The EMA200 at $5.44 lies well below, confirming the broader uptrend. Elevated volatility, reflected by an ATR14 of $0.53, increases both downside and recovery risks.
The daily pivot point at $6.41 is just above the current price, with resistance at $6.63 and support at $6.09. Closing below the pivot suggests bears held the session. Breaching support at $6.09 and EMA50 would shift the daily structure bearish.
Hourly Timeframe: Aurora Stock Oversold But Lacking Recovery
The hourly RSI at 28.44 suggests oversold conditions, but no immediate reversal signs appear. The hourly MACD remains bearish with both lines negative and no divergence, indicating sellers maintain control.
Price sits below the EMA20 ($6.72), EMA50 ($7.00), and EMA200 ($6.74), creating a short-term downtrend signature. Although the lower hourly Bollinger Band at $6.14 could offer short-term mean-reversion support, any bounce will likely be limited and met with selling pressure.
15-Minute Timeframe: Tactical Execution of Bearish Momentum
The 15-minute chart shows a bearish regime with price below all major EMAs and an RSI at 38.89 signaling weakness. A minimal positive MACD histogram suggests a slight decrease in decline momentum. This may allow stabilization near $6.26–$6.29 before the next directional move becomes clearer.
Fundamental Catalysts Supporting Aurora Stock
Fundamentally, Aurora benefits from positive developments that the technicals currently ignore. Northland Capital started coverage with an Outperform rating and an $11 target, implying roughly 75% upside. Additionally, Aurora’s partnership with McLane Company to advance driverless commercial hauls in Texas marks a significant operational milestone.
These fundamental drivers underpin the long-term valuation narrative around SAE Level 4 autonomous trucking, although near-term price action remains pressured by technical factors.
Bearish and Bullish Scenarios for Aurora Stock
Bullish Scenario
AUR could rebound if it holds the EMA50 support at $6.22 and hourly RSI recovers from oversold levels. A push above the daily pivot and resistance at $6.63, especially surpassing the daily EMA20 at $6.93, would confirm the pullback’s end and resume the uptrend towards the $11 target supported by fundamental catalysts.
Bearish Scenario
A close below EMA50 and the daily S1 pivot at $6.09 would undermine the bullish structure. This would open a pathway to deeper correction towards $5.80–$6.00, before the EMA200 at $5.44 is tested. The hourly downtrend and fading 15-minute MACD uptick would indicate continued selling pressure and a probable false recovery floor.
Positioning and Market Uncertainty Around Aurora Stock
AUR is at a technical crossroads. The daily trend is officially neutral but leans bearish near term due to weakening momentum and price trading beneath key short-term EMAs. Nonetheless, the longer-term uptrend remains intact, supported by constructive fundamental news.
How the stock performs around the $6.22 EMA50 in upcoming sessions will reveal if the current pullback is healthy or signaling a deeper correction. Elevated ATR and volatility underscore that directional clarity may arrive rapidly, bringing significant risks to positioning.