

AMD stock is navigating a critical inflection point following a sharp 6.5% intraday drop on June 5. This selloff was triggered by a broader semiconductor downturn linked to Broadcom’s earnings concerns and a stronger-than-expected jobs report. The stock closed at $466.38, erasing several days of gains and moving below its daily pivot. Despite this, the longer-term trend remains intact, though short-term charts reveal more caution.
Summary
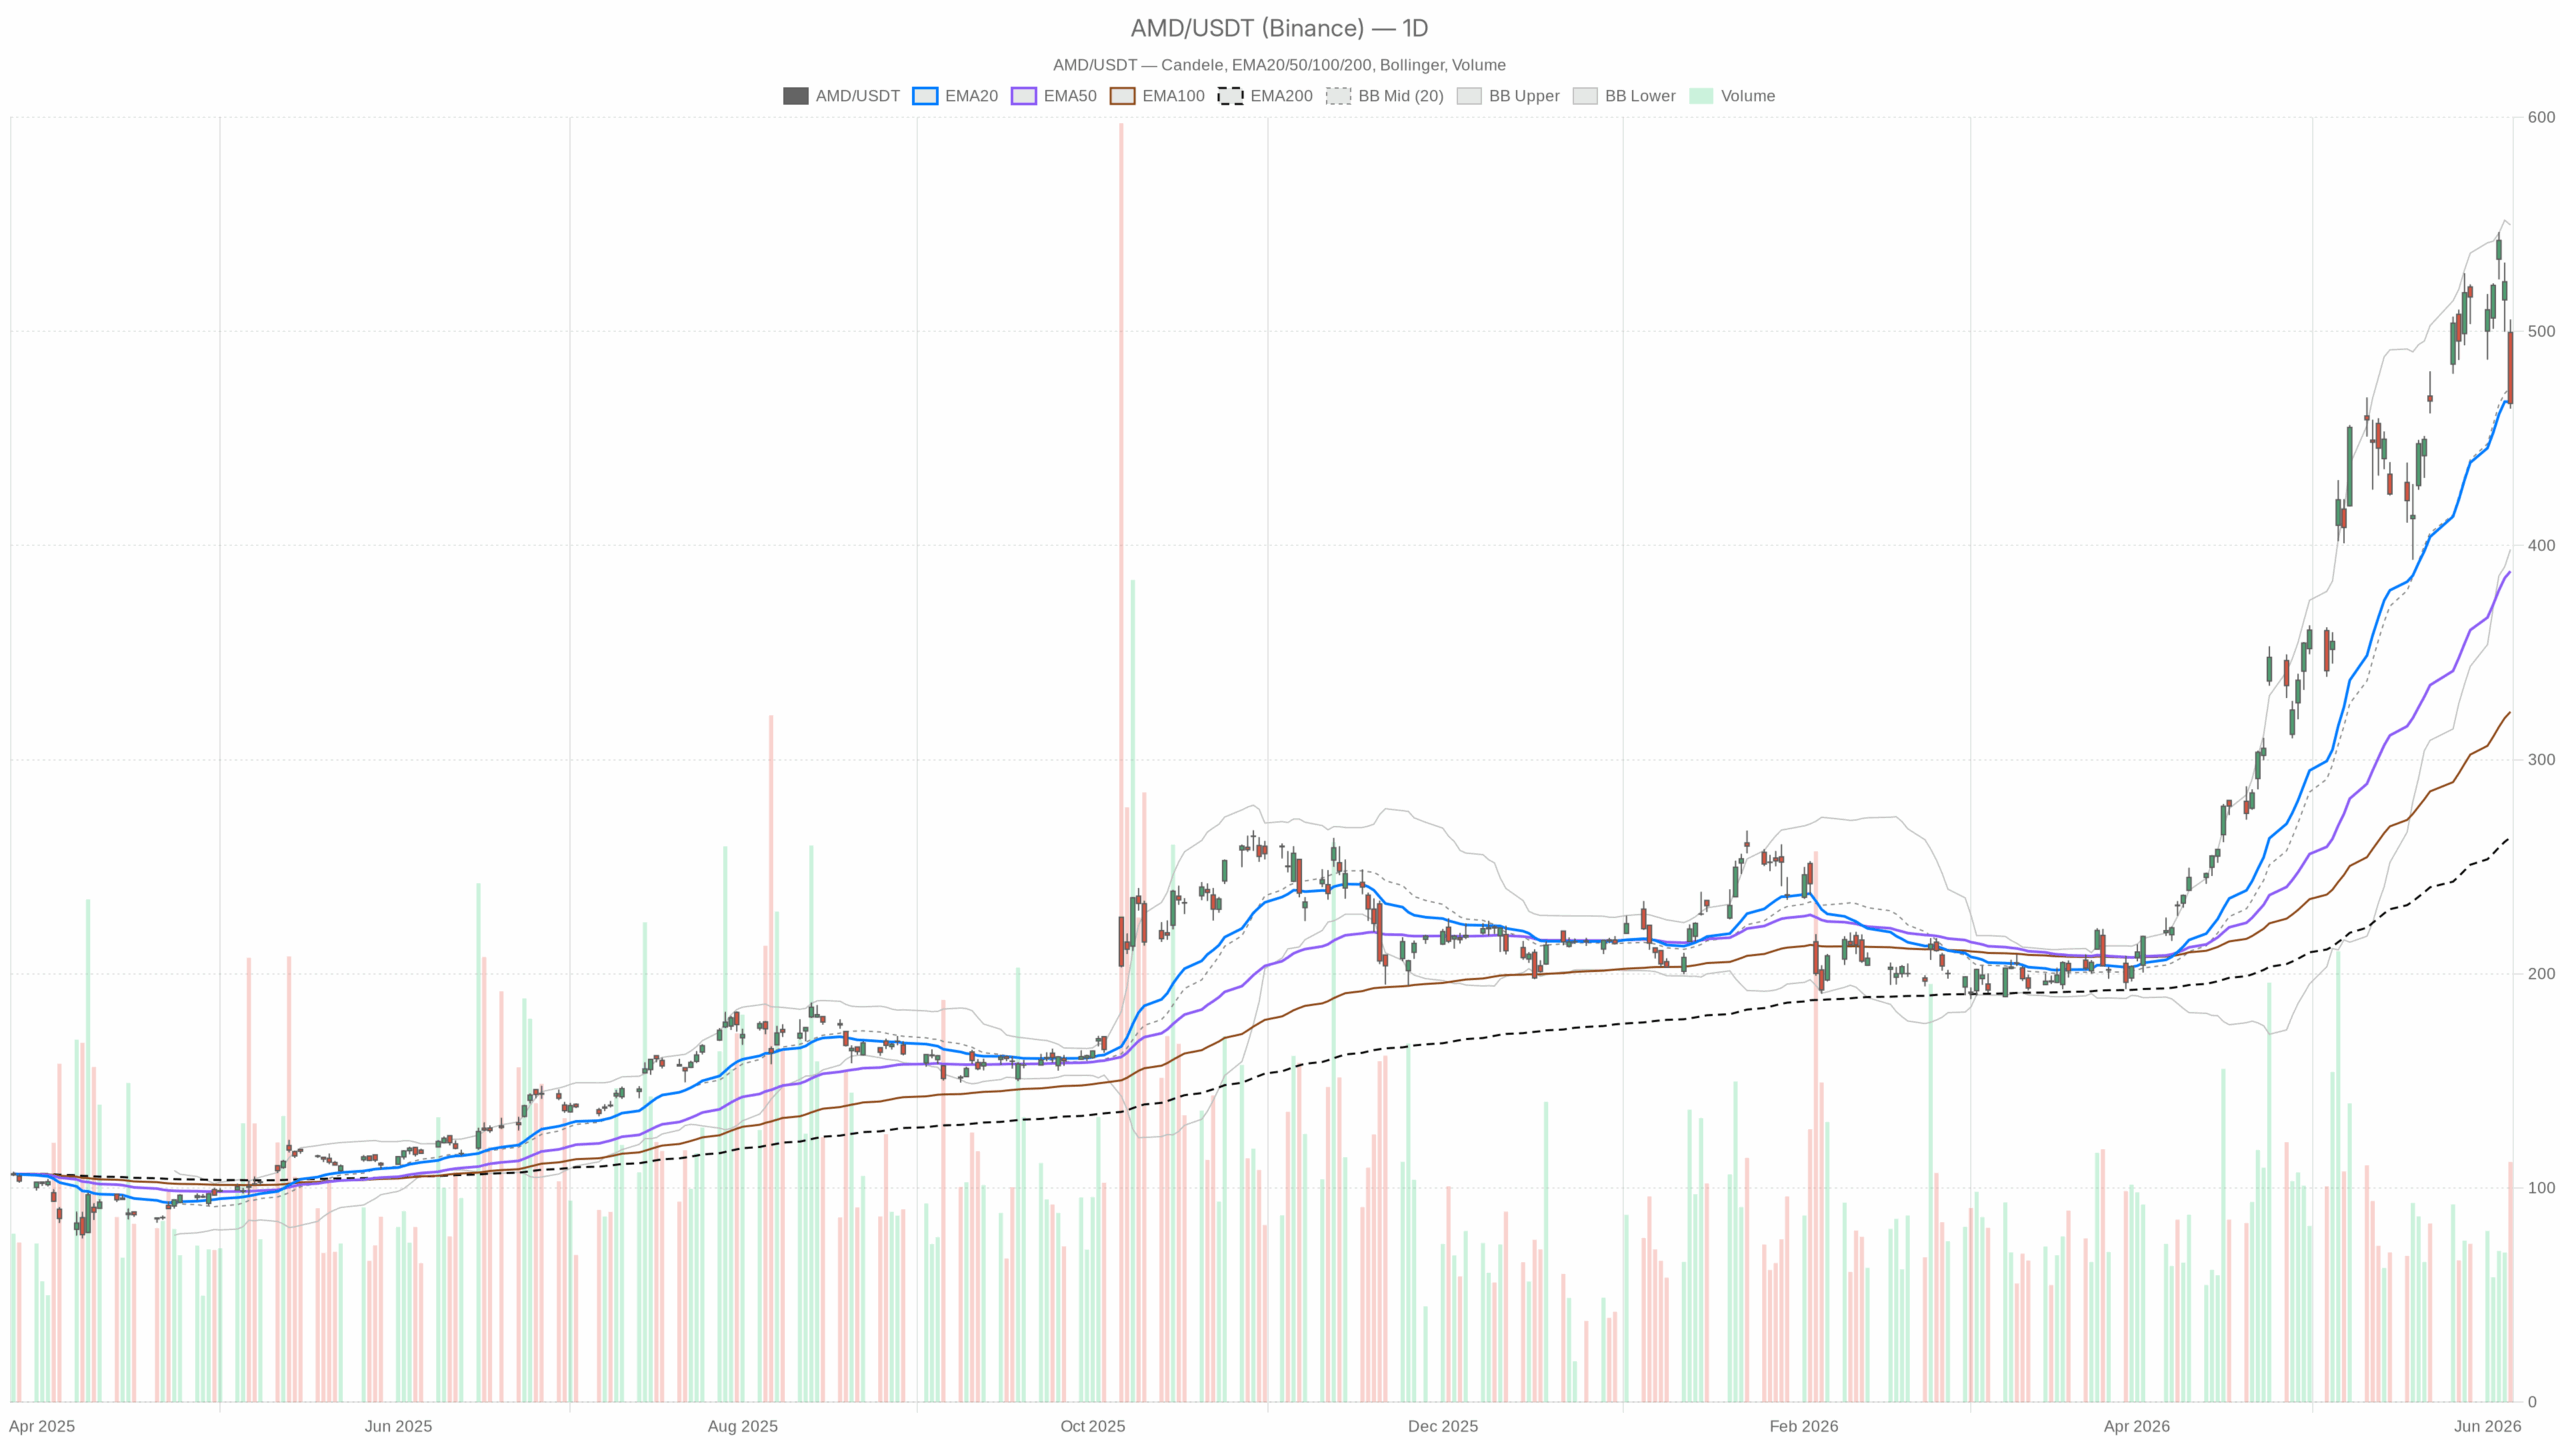
Daily Structure of AMD Stock: Trend Intact but Momentum Fading
AMD remains structurally strong on the daily chart, trading well above its EMA50 at $388 and EMA200 at $263. However, the price has slipped below the EMA20 at $467, closing at $466.38, which signals a key short-term warning. The EMA20 had provided dynamic support through the rally, and losing it alters the move’s character.
The daily RSI at 54.55 stays above midpoint, indicating the broader uptrend is intact but weakening as it trends lower. Meanwhile, the MACD presents a cautionary sign: the histogram has turned negative at -4.17, and the MACD line at 43.42 crossed below its signal line at 47.59. This daily bearish crossover indicates momentum is fading, confirming buying pressure has peaked for now.
Bollinger Bands on the daily are wide, with the upper band at $549 and the lower at $398. Price now sits near the midline at $473, having reverted from a recent push toward the upper band. This mean-reversion suggests immediate upside is limited. The daily ATR of $31.73 underscores that AMD can experience large intraday swings, which further explains the recent volatility.
Daily pivot points set pivotal levels with the pivot at $478.65, resistance at $493.35, and support at $451.68. Closing below the daily pivot signals bearish near-term positioning, while $451 remains an important support level if selling pressure continues.
Hourly Chart Analysis Highlights Severe Near-Term Damage
On the 1-hour chart, AMD’s picture worsens. The stock trades well below the 1H EMA20 ($499.78), EMA50 ($502.62), and has approached the 1H EMA200 ($439.58) rapidly from above. The price is near the lower Bollinger Band at $457.81, with the close around $466 penetrating the hourly range’s lower half sharply.
The 1H RSI has collapsed to 28, entering oversold territory. Such readings often precede technical bounces, though they don’t guarantee reversals, especially amid macro-driven selloffs like this semiconductor rotation. The hourly MACD confirms active bearish momentum, with the line at -12.39 and signal at -5.46 producing a deep negative histogram of -6.93. The divergence between the daily’s fading momentum and hourly’s active bearishness poses a significant challenge for traders.
15-Minute Chart Shows Early Signs of Stabilization but Remains Bearish
The 15-minute timeframe offers faint signs of slowing decline as the MACD histogram turned slightly positive at 0.98 and the RSI nudged away from extreme oversold at 31.16. However, price remains below all three EMAs, confirming a bearish micro regime. Any bounce should be seen as relief in a downtrend until higher-timeframe confirmation arises. The 15m ATR of $5.99 indicates moderate short-term volatility, allowing room for tactical moves without signaling a broader recovery.
Bullish Scenario Supporting AMD Stock Recovery
The constructive daily trend is the foundation of the bullish case. Large EMA50 and EMA200 separation reflect multi-month buying conviction. The semiconductor selloff’s macro nature, driven by Broadcom earnings and macro data, also supports a potential rebound. Additionally, Barclays’ price target increase to $665 underlines confidence in AMD’s AI infrastructure positioning and rising CPU demand.
For recovery, AMD must reclaim the daily EMA20 near $467 and push above the daily pivot at $478.65. Stabilizing the 1H MACD and lifting the 1H RSI above 40 would confirm momentum improvement. If achieved, the $493 resistance level emerges as the next target.
Bearish Scenario Risks for AMD Stock
A bearish trajectory should not be overlooked. Should the daily MACD worsen and price fail to regain the EMA20, momentum could decline sharply. Maintaining levels below the daily pivot at $478.65, already broken on June 5, would confirm near-term bearish control. This would put the $451 support zone at risk.
Valuation concerns add to the downside risk. The stock’s price has advanced considerably ahead of earnings expectations, driven by the AI growth narrative. In a rising-rate environment following the strong jobs report, market reassessment could compress multiples. Breaking below $451 could threaten the longer-term uptrend and shift the daily bias to neutral or negative.
Positioning and Volatility Outlook for AMD Stock
AMD stock faces a crossroads, with a constructive daily trend but significant intraday damage. The hourly chart suggests active distribution, while daily ATR near $32 signals elevated volatility. The wide price swings during recent sessions highlight risk in aggressive long positions. Traders focusing on short timeframes should await hourly momentum stabilization. The immediate trading range between $462 and $478 is crucial; price action within this zone will determine whether this dip is a buying opportunity or the start of a deeper correction.