

Ethereum is currently trading around $1,676, reflecting a market deeply beaten down rather than merely corrected. The price is roughly 12% below its 20-day EMA, nearly 19% below the 50-day EMA, and 34% below the 200-day moving average. This signifies a sustained bearish trend rather than a simple dip, with every short-term rally facing strong resistance due to persistent distribution on the daily chart.
The current phase combines deeply oversold conditions with ongoing bearish structure. A Fear & Greed Index at 8 — Extreme Fear highlights capitulation in sentiment, yet sentiment alone has not reversed the trend. The key question is whether there is structural demand absorbing supply at these price levels; so far, the evidence is weak on the daily and only somewhat positive on lower timeframes.
Summary
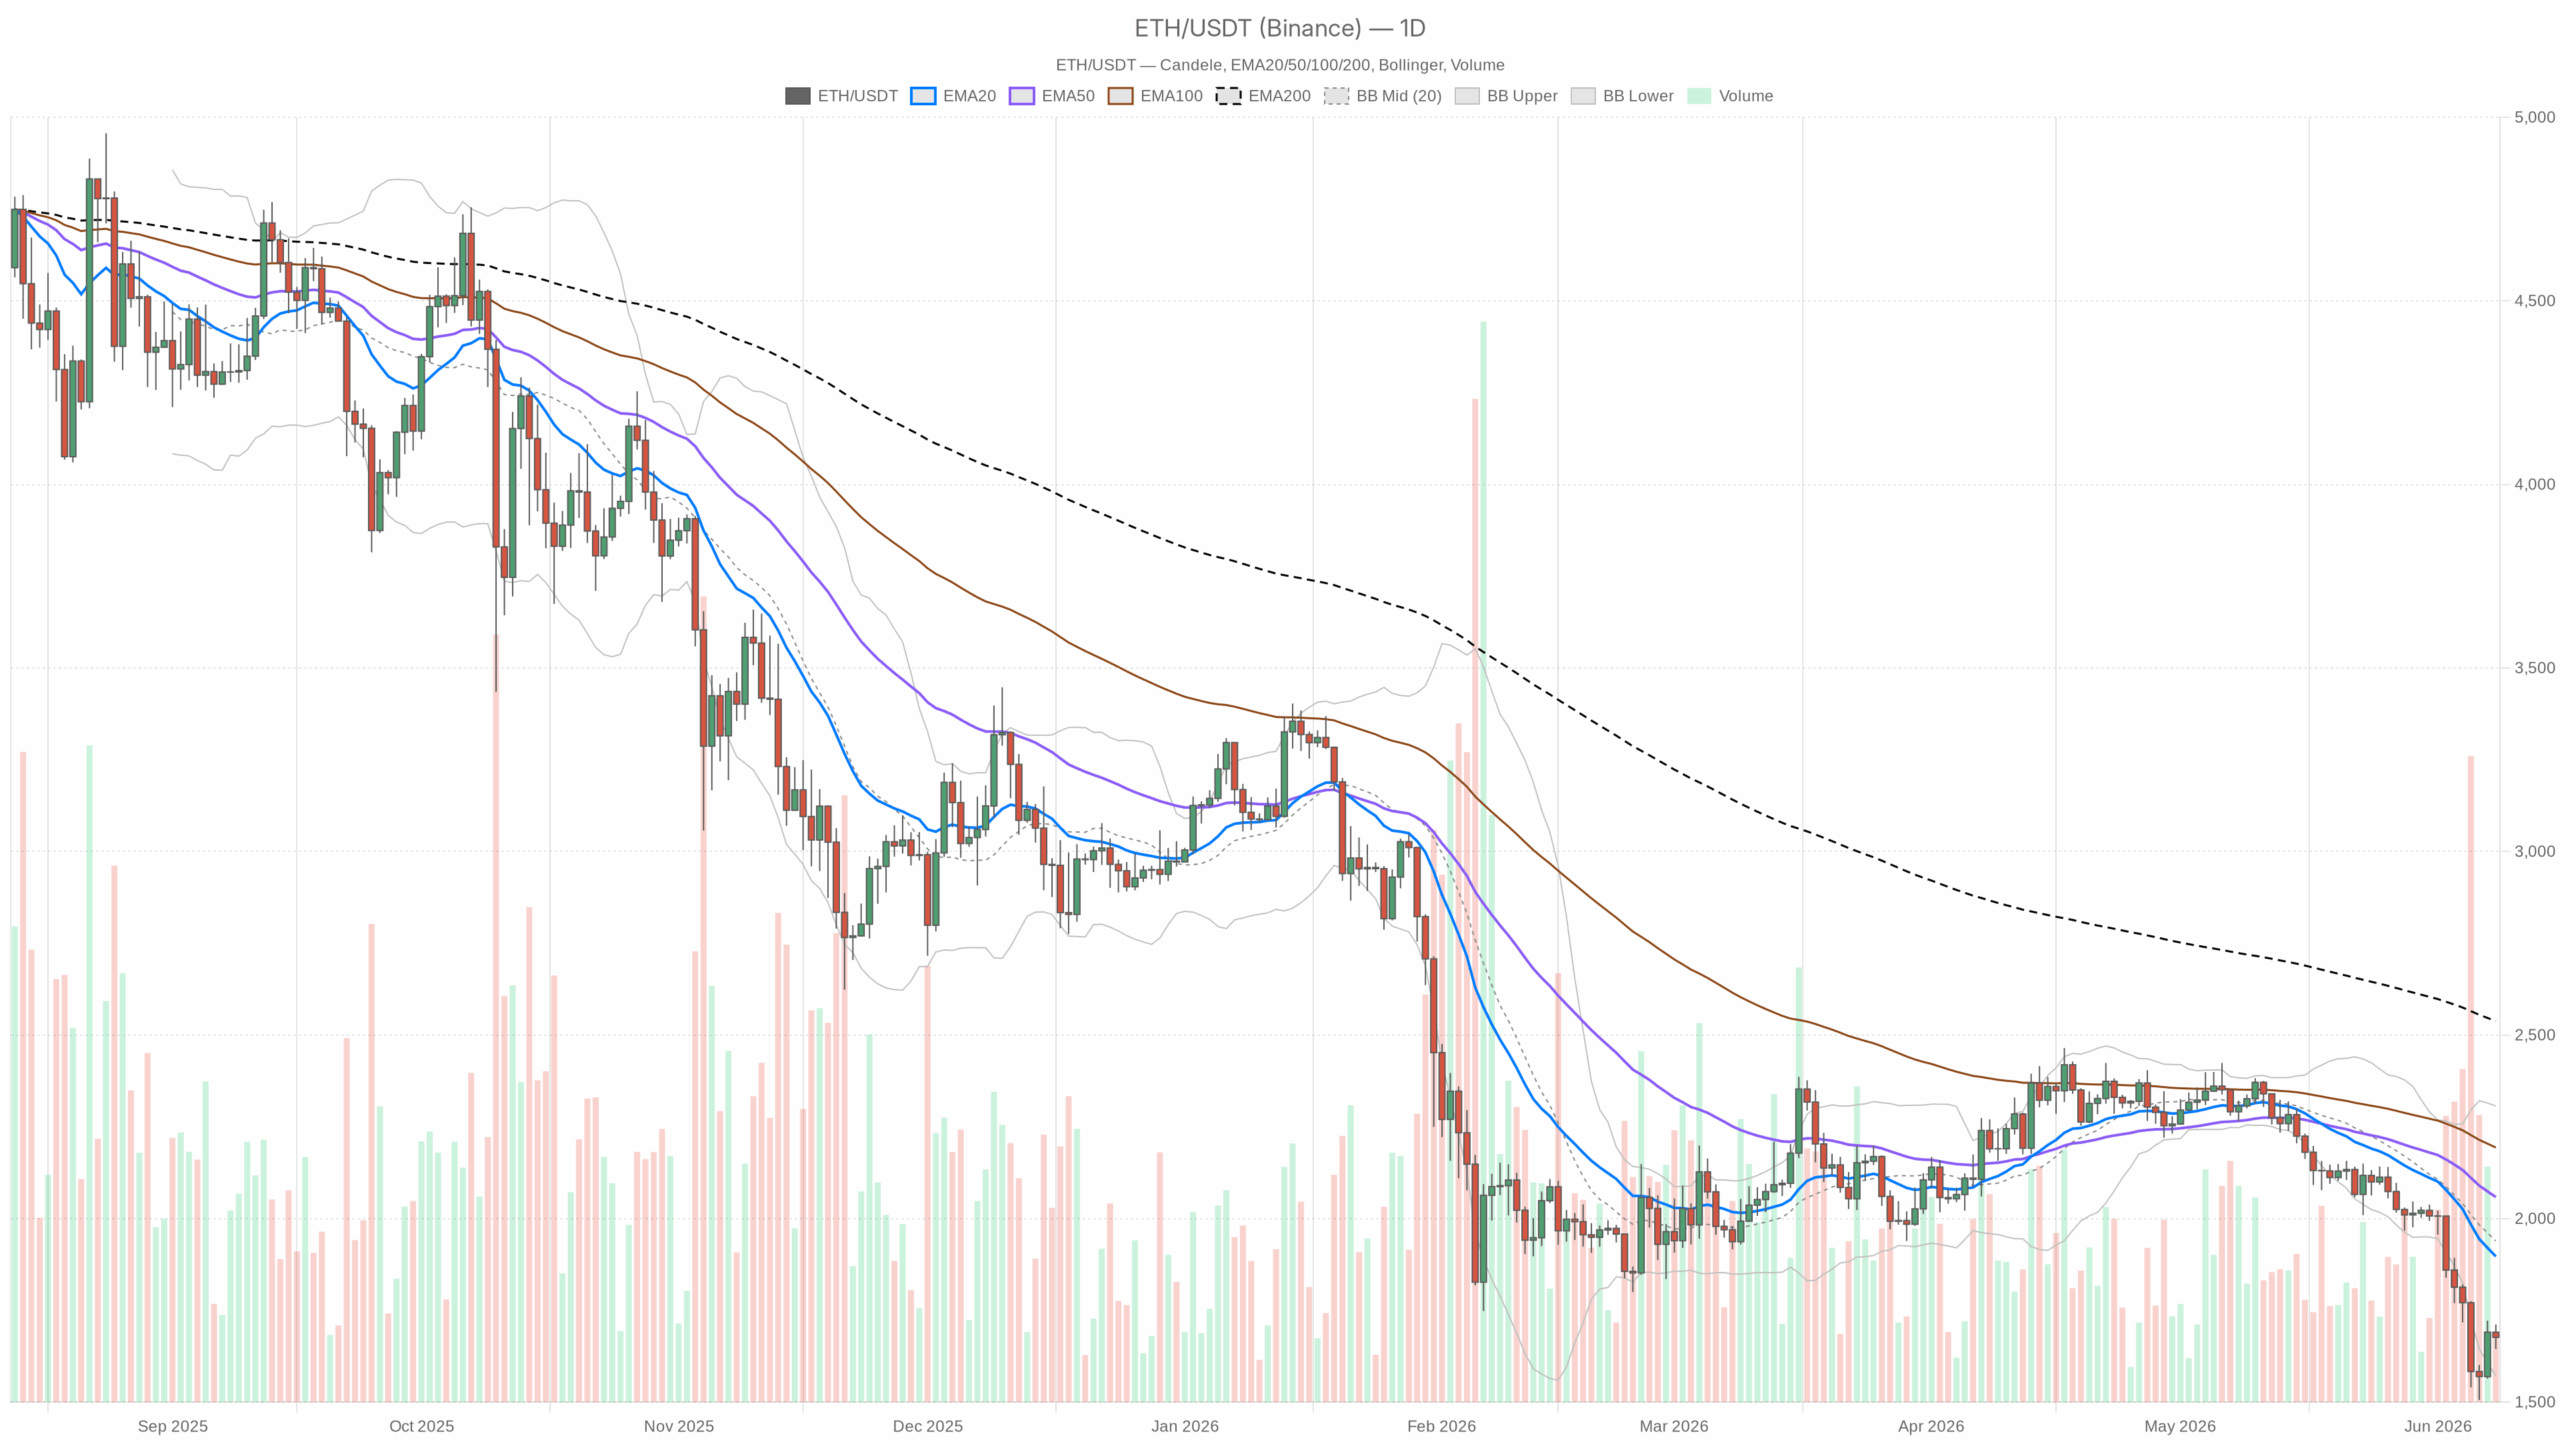
The Daily Chart: Bearish Regime, No Ambiguity
The daily chart remains unequivocally bearish. The RSI stands at 27.32, indicating deep oversold territory often seen during late-stage selloffs or capitulation phases. However, oversold RSI in a downtrend does not guarantee reversal; it may simply precede brief relief rallies.
The daily MACD is strongly negative, with the line at -143.96, the signal at -112.50, and the histogram at -31.46. This expanding negative histogram signals accelerating bearish momentum rather than any early reversal signs.
The EMA stack confirms the bearish trend: the price at $1,676 trades well below the EMA20 ($1,897), EMA50 ($2,058), and EMA200 ($2,538), all sloping downward. This descending EMA alignment is characteristic of a firm downtrend.
Bollinger Bands set the midline at $1,939, the upper band at $2,306, and the lower band at $1,572. Ethereum’s price pressing the lower band suggests possibilities for short-term bounces amid elevated volatility, as reflected by the average true range (ATR) of 99.2, implying daily swings around $100.
Daily pivot points place the pivot at $1,677.69, resistance 1 at $1,710, and support 1 at $1,644. The price hovering near the pivot indicates indecision, but within the broader bearish context, the bias leans toward continued downside.
The 1-Hour Chart: A Brief Reprieve, Not a Revolution
The hourly chart offers a slightly more neutral tone. Ethereum at $1,675.90 trades above the EMA20 ($1,653) and EMA50 ($1,637), suggesting minor short-term strength. The 1H RSI of 61.53 nears overbought levels, reflecting constructive momentum. However, the 1H EMA200 at $1,760 remains well above price, underscoring prevailing bearish structure even on shorter timeframes.
The 1H MACD is near flat, with a line of 17.34, signal at 18.19, and histogram at -0.85. This suggests fading momentum, consistent with a bounce losing steam near resistance. A break above hourly resistance at $1,681.61 could lift short-term sentiment, yet remains a modest hurdle to sustained gains.
The 15-Minute Chart: Execution Context Only
The 15-minute chart shows a bullish regime, with price above the EMA20 ($1,668), EMA50 ($1,662), and EMA200 ($1,634). The 15M RSI at 56.33 and a recently positive MACD histogram (1.07) confirm short-term upward momentum.
However, this short-term bullishness is counter-trend noise against the dominant daily downtrend. Using the 15-minute bullish signal for medium-term longs neglects the broader market structure and carries heightened risk, a common pitfall for many traders.
The Broader Market: Context Matters
The total crypto market cap stands near $2.25 trillion, up about 1.3% over 24 hours, a modest recovery after a difficult period. Bitcoin dominance remains elevated at 56.17%, concentrating capital in Bitcoin rather than altcoins like Ethereum. Ethereum’s market cap share is around 8.96%, compressed but not at historic lows.
High BTC dominance typically hampers Ethereum’s independent rallies. For Ethereum to regain ground, Bitcoin needs to stabilize and for dominance trends to shift.
In decentralized finance, Uniswap V3 and V4 showed fee declines of 46% and 61% respectively over 30 days, indicating falling on-chain activity and weaker fundamental drivers for Ethereum. Ekubo’s 7-day fee spike of +513% is an outlier but does not offset the broader softness.
The Bullish Case
Bulls can point to the classic setup of an oversold bounce. The daily RSI near 27 often precedes sharp relief rallies of 10–20% even amid downtrends. The lower Bollinger Band at $1,572 sits just below current price, suggesting possible seller exhaustion if a dip to this level is followed by a strong close above $1,677.
A reclaim of the daily pivot at $1,677 and a rally toward the 1H EMA200 at $1,760 would mark early bullish milestones. Further upside could push the price into the $1,800–$1,850 range.
However, a decisive break and close below the $1,572 lower Bollinger Band would invalidate this scenario and shift focus to lower price discovery.
The Bearish Case
The bearish path remains the path of least resistance. Maintaining price below the daily EMA20 ($1,897) and expanding negative MACD histogram supports the downtrend.
Bounces reaching $1,710–$1,760 that fail to hold would form lower highs, reinforcing bearish momentum. Continued macro risk-off, elevated BTC dominance, and a drop in the daily RSI toward 20–25 could precede final capitulation phases.
Reclaiming and closing above the daily EMA20 at $1,897 on strong volume would be the first credible bullish signal.
Positioning and Risk
Ethereum’s current position presents an asymmetric risk/reward for short positions given the significant downside potential, yet lacks clear entry signals for longs. Extreme Fear at 8/100 indicates widespread selling is mostly complete, but this reflects sentiment rather than structural shift.
Volatility remains high with an ATR of $99, meaning $200 trading ranges intraday are common. Traders must account for this volatility with proper sizing and risk management.
While the 15-minute and hourly charts hint at short-term stabilization near $1,676, the daily chart demands caution. Playing bounces within a downtrend requires tight stops and realistic targets. The descending EMA stack above serves as strong resistance, not a path for extended rallies.
Patience, scaled positions, and clear stop levels aligned with daily pivot points — $1,644 support and $1,710 resistance — offer the best framework. The coming days will clarify near-term direction more than any single indicator.