

Bitcoin is currently trading around $63,228 amid a mixed technical landscape that shows distress on higher timeframes but signs of life on shorter ones. This contrast captures the market’s conflicted state today with the daily chart signaling oversold conditions while shorter-term charts display some buying momentum.
Summary
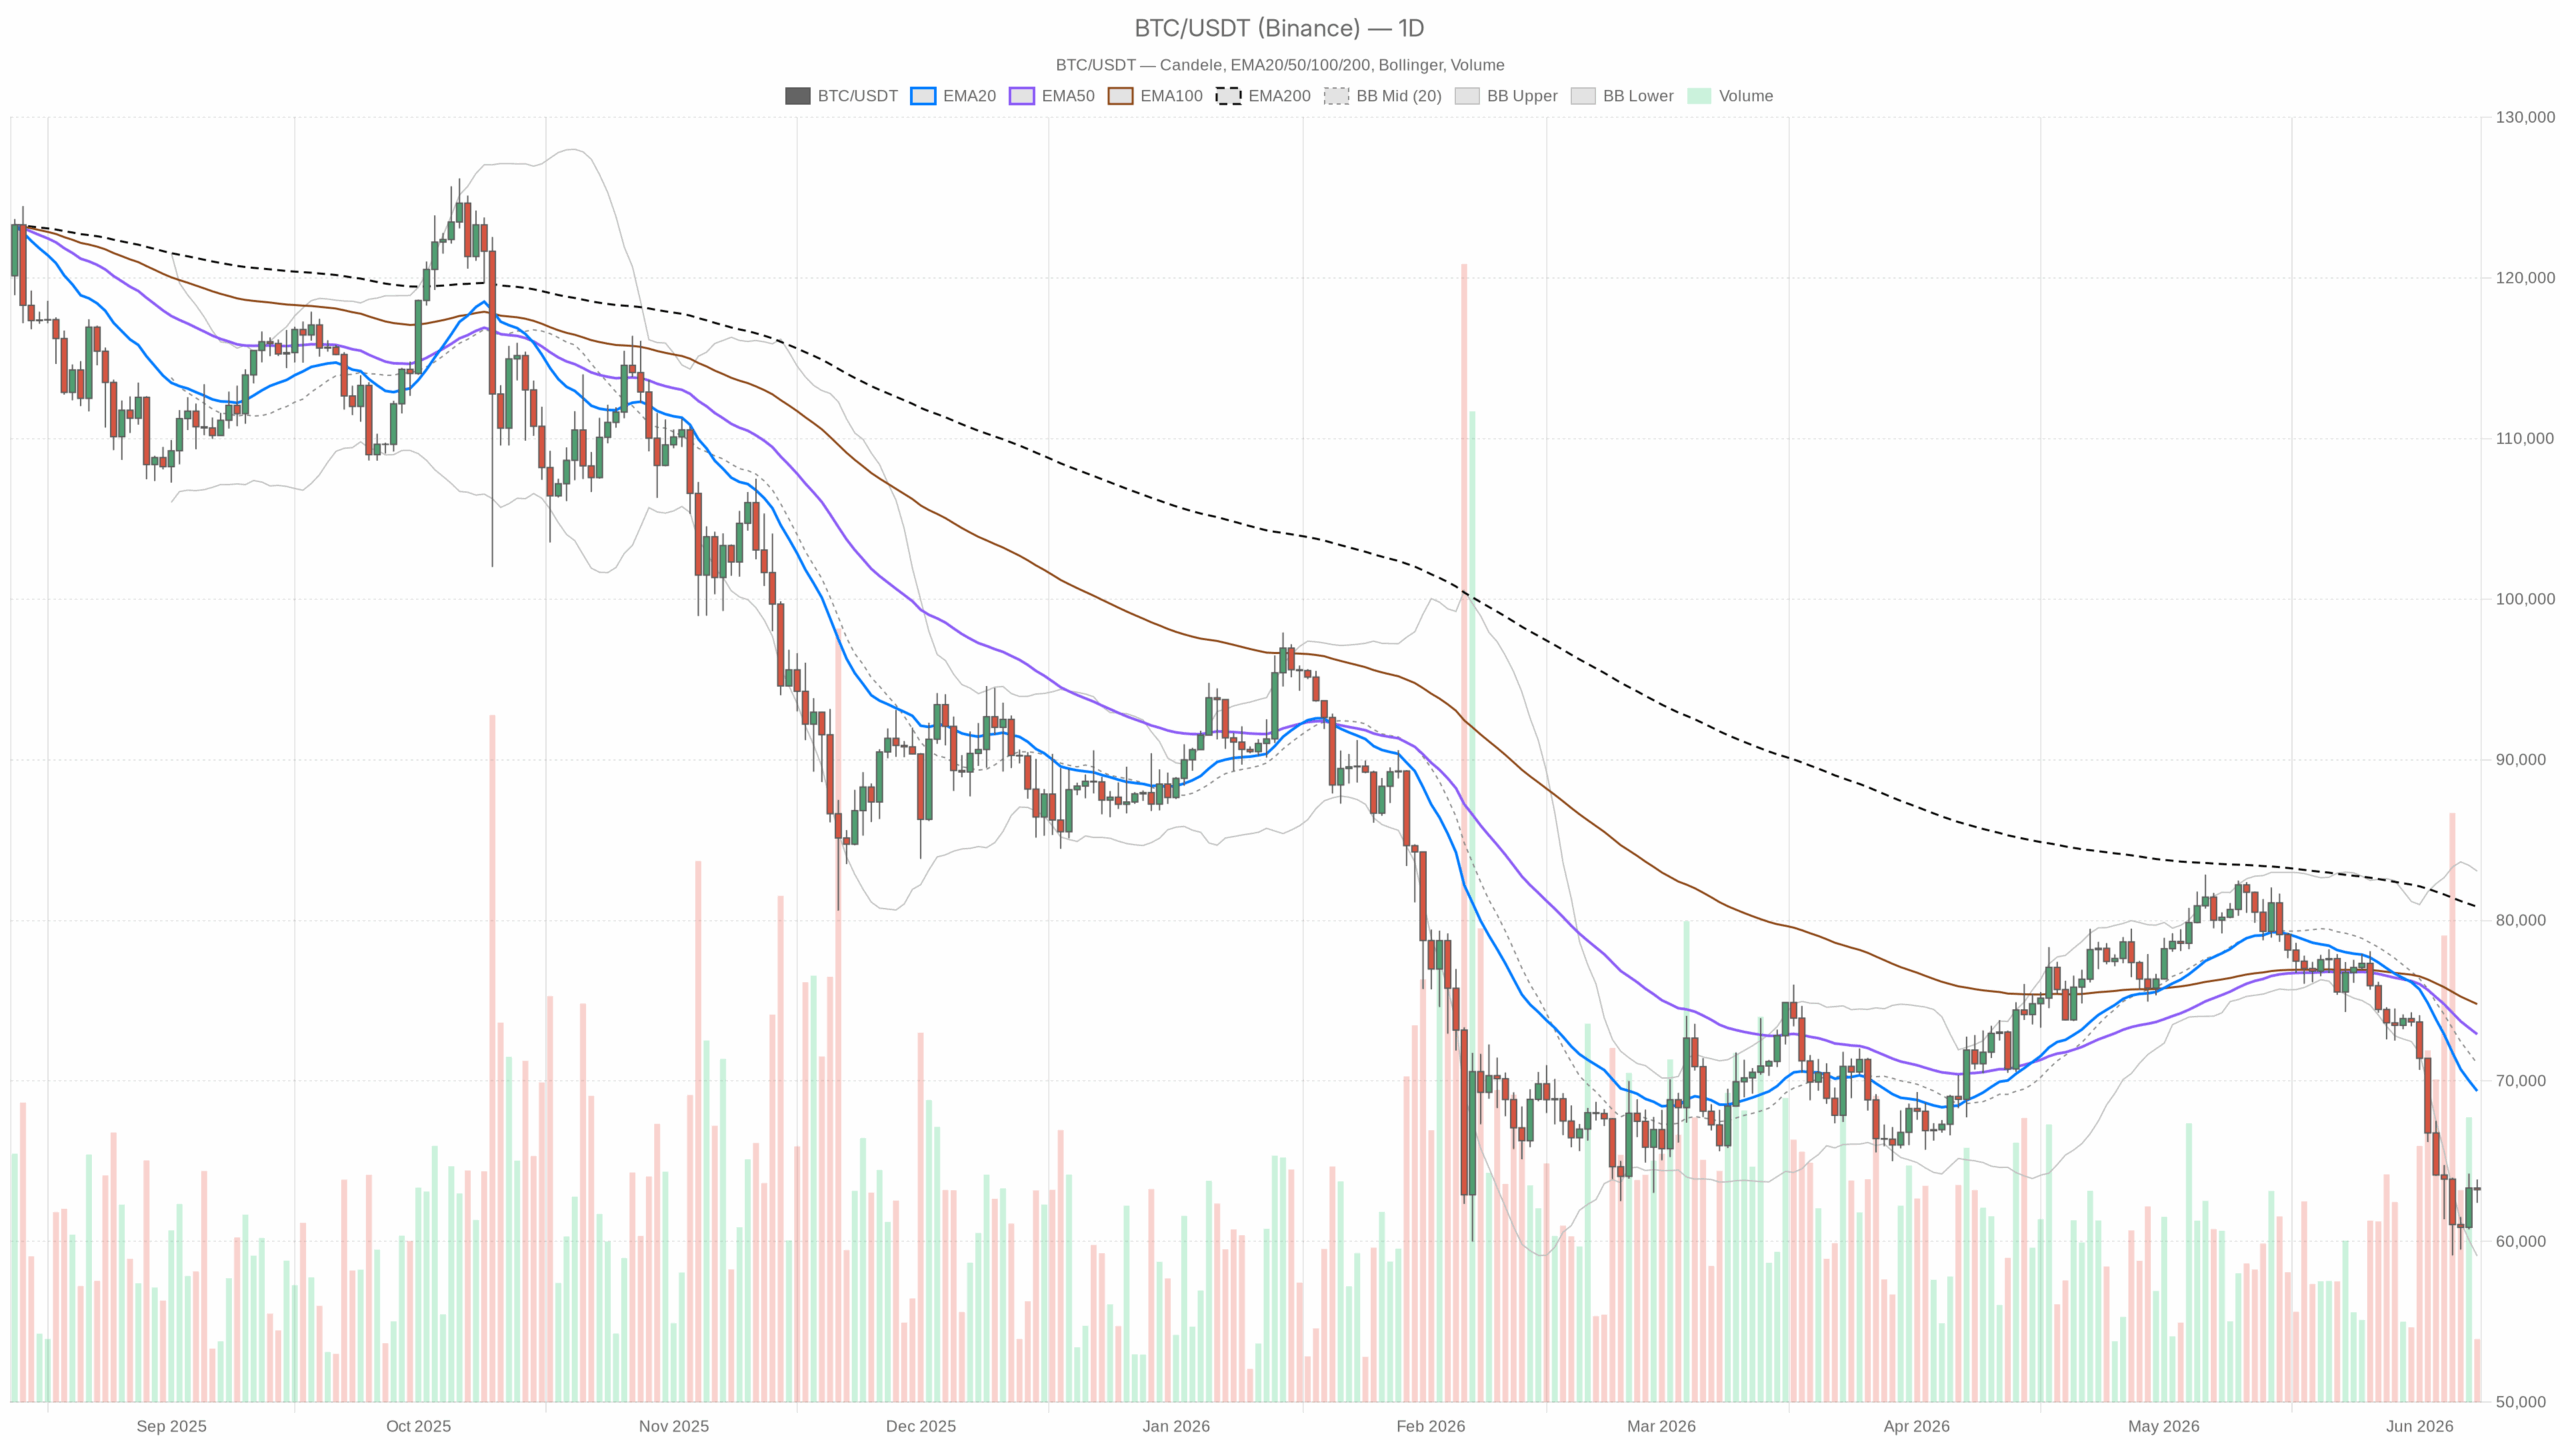
The Daily Chart: Bear Market Conditions Persist
The daily timeframe clearly reveals a bearish regime. Bitcoin trades $6,142 below the 20-day EMA at $69,370 and a substantial $17,616 below the 200-day EMA at $80,844. Such wide gaps confirm sellers’ dominance over an extended period. The daily RSI at 26.41 confirms oversold territory, suggesting exhaustion yet cautioning that selling pressure may continue. The MACD’s widening negative gap signals accelerating downward momentum, discouraging aggressive breakout buys.
Daily Bollinger Bands show price near the lower band at $59,097, indicating expanded volatility with an ATR around $2,670. The daily pivot at $63,166 places Bitcoin almost exactly at a technical neutral point in the very short term but within a larger bearish context.
Short-Term Market Dynamics: 1-Hour and 15-Minute Charts
On the 1-hour chart, Bitcoin trades above the 20-hour EMA ($62,616) and 50-hour EMA ($62,241), reflecting constructive short-term momentum. The hourly RSI at 60.36 and a fresh positive MACD crossover indicate genuine buying interest. However, resistance remains near the 200-hour EMA at $65,413 and a cluster between $63,400 and $63,800.
The 15-minute chart is more optimistic, with price above all EMAs and positive momentum indicators. Yet, this intraday bullishness should not be mistaken for structural strength, as these signals can reverse quickly.
Market Sentiment and Broader Context
Bitcoin dominance holding above 56% while altcoins lag reflects a risk-off mentality. Declining decentralized exchange volumes and a Fear & Greed Index reading of 8 underline extreme fear and caution among market participants. Such conditions historically mark capitulation phases but may persist for weeks.
Possible Bullish Outcome
Bulls could leverage the oversold daily RSI and lower Bollinger Band floor near $59,100 for a recovery bounce. Sustained gains above the daily pivot ($63,166) and daily resistance at $63,924 would be positive steps. Clearing the 20-day EMA around $69,370 would be a key threshold to shift the daily trend from bearish to neutral, though any failure to hold above $62,469 risks renewed selling pressure.
Bearish Scenario
Bears maintain control as all major daily moving averages remain stacked above price, and momentum is negative. The recent sale by Michael Saylor signals wavering strong hands. Failure of the current bounce could bring a retest of the lower Bollinger Band near $59,097 and the $58,000–$60,000 psychological zone, with limited support below that. A move above $65,000, including the 200-hour EMA, would challenge the bearish case.
Conclusion: A Market in Flux
This market presents a complex scenario where aggressive selling has met short-term buying attempts across various timeframes. Volatility remains high, with expected daily swings exceeding $2,670. Narrative shocks, like institutional selling, exacerbate uncertainty. Patience is essential as the daily trend awaits confirmation, and short-term momentum faces critical resistance between $63,400 and $65,400. Watching price action over the next 24 to 48 hours will provide clearer clues beyond technical indicators.