




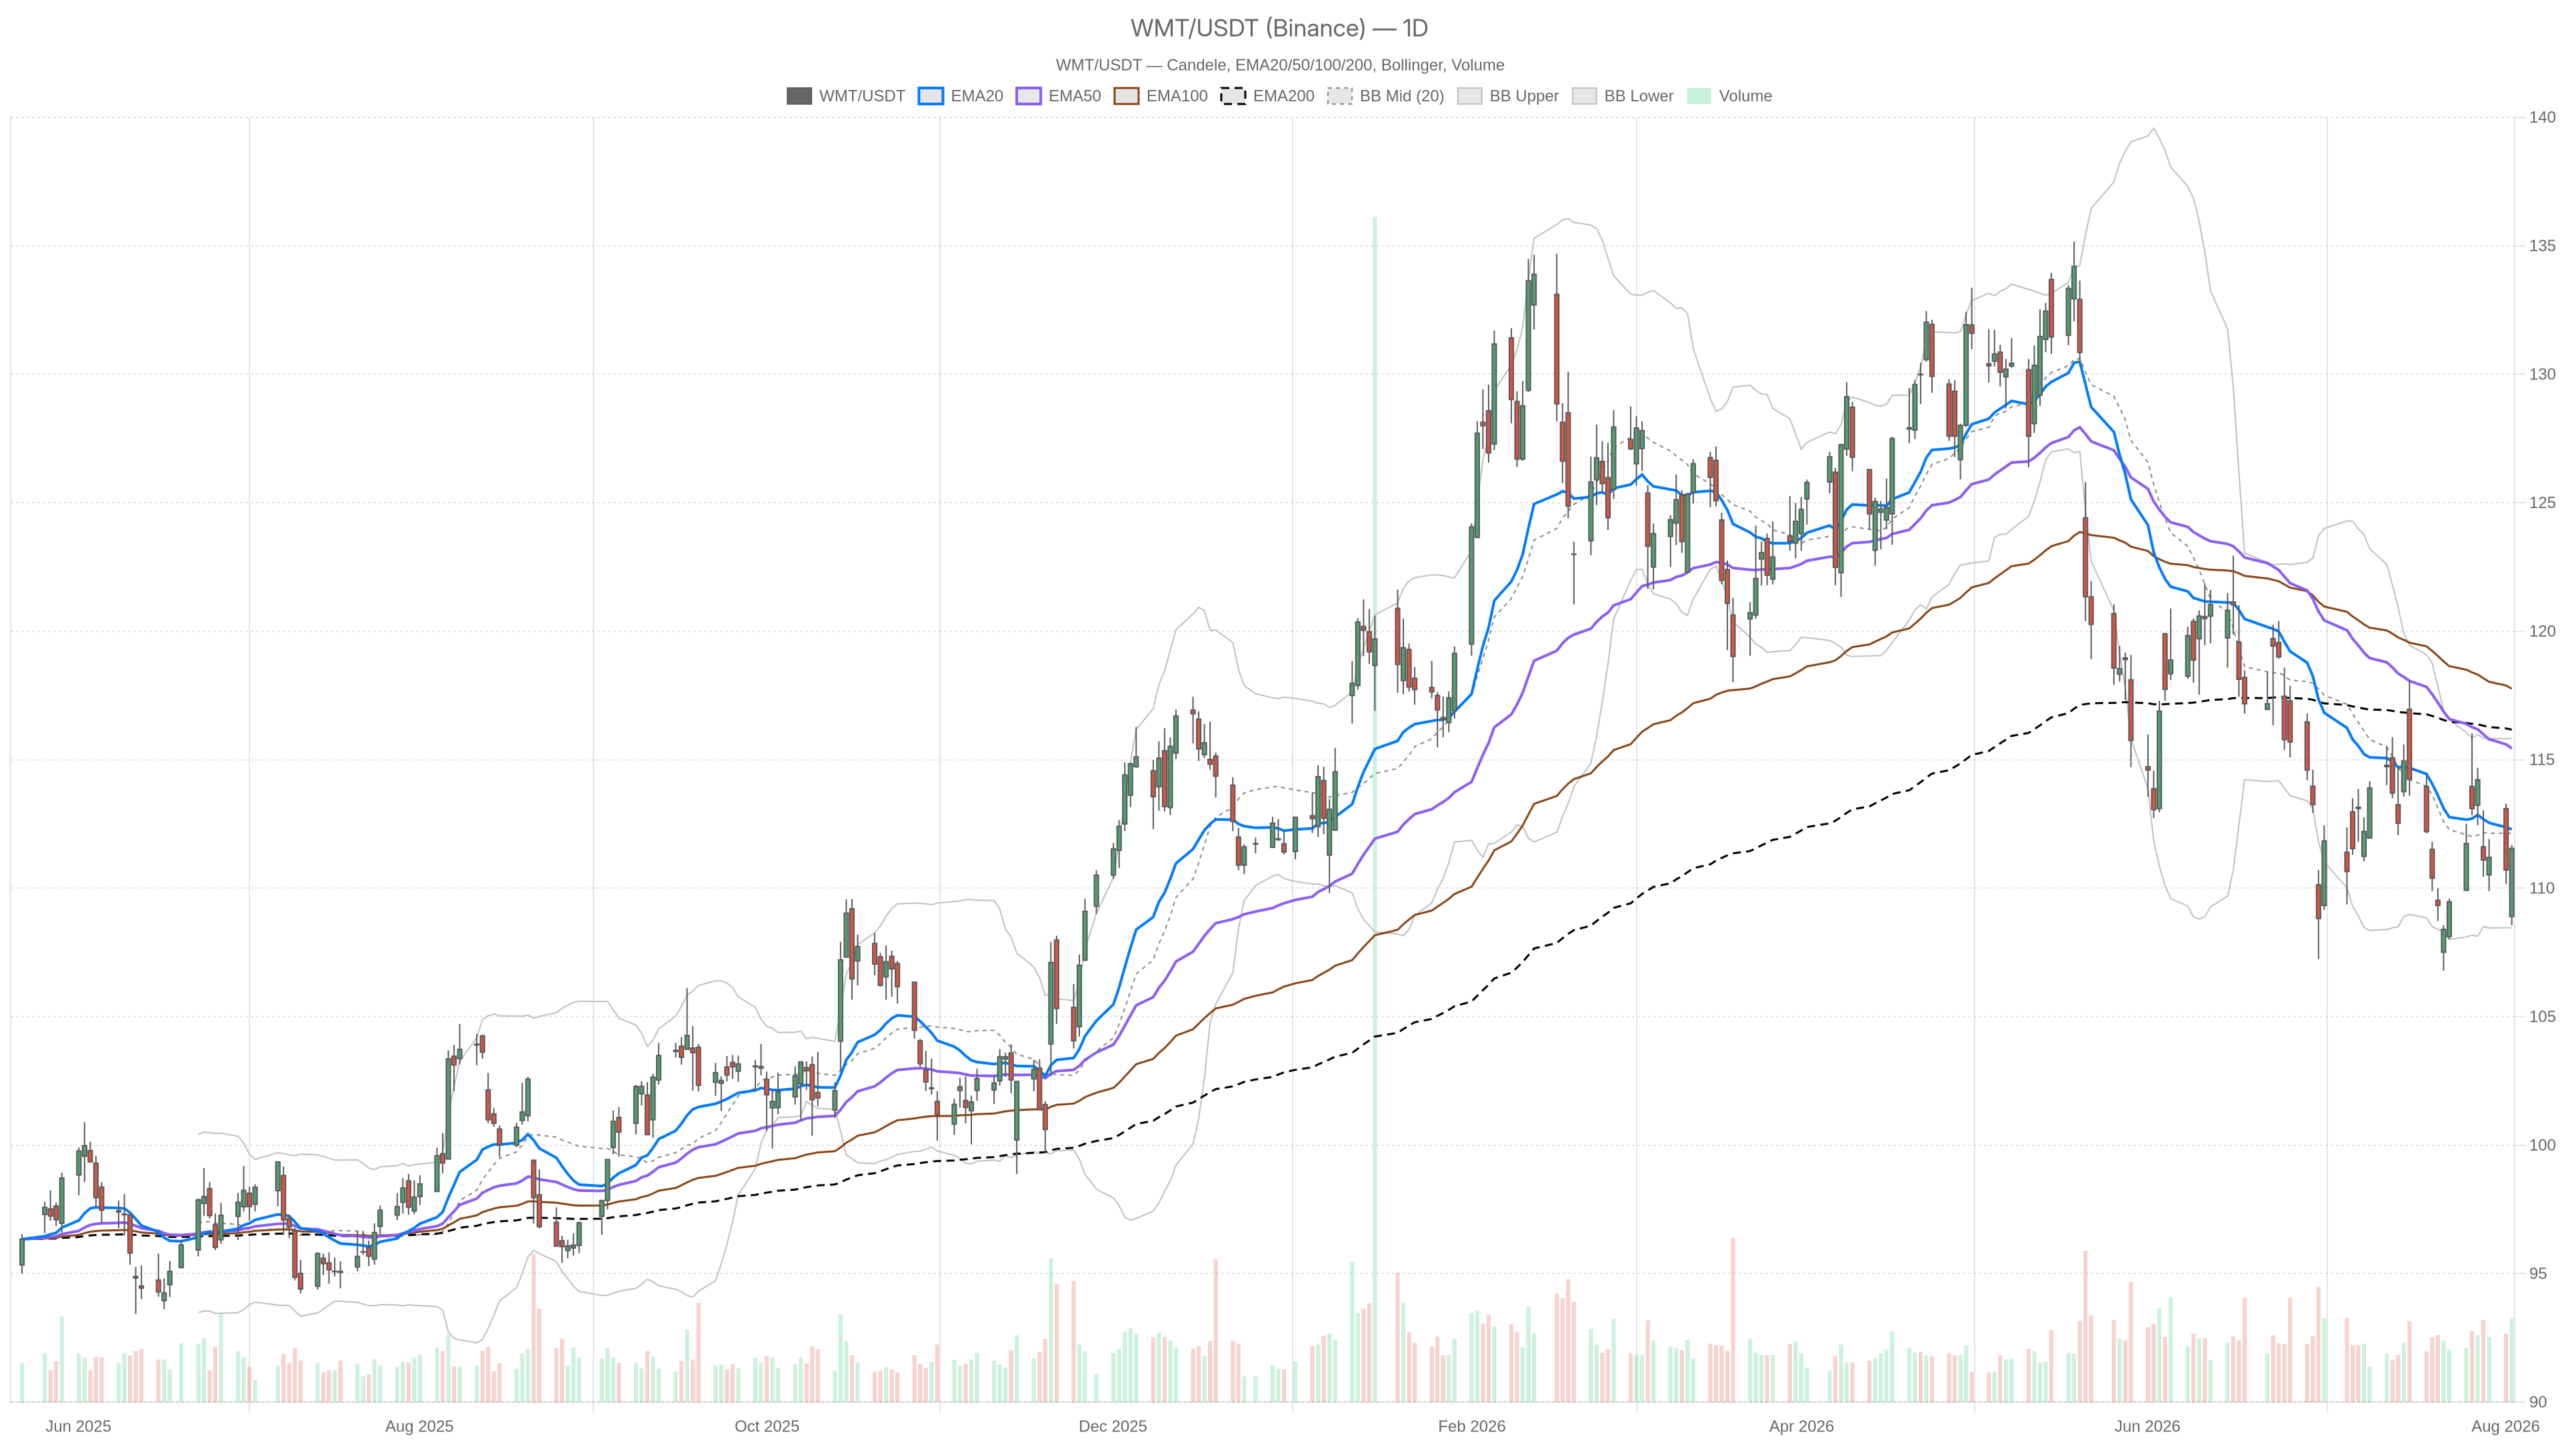
Walmart stock closed at $111.55 on August 4, caught between a bearish daily structure and an emerging intraday bounce. Shares remain down 17% year to date. The broader technical posture still points lower, even as shorter timeframes show tentative signs of stabilization.
Summary
Key takeaways
- Walmart stock closed at $111.55 on August 4, below its daily EMA20 ($112.29), EMA50 ($115.44), and EMA200 ($116.17).
- Daily RSI14 at 45.81 confirms bearish momentum, though the MACD histogram at 0.28 suggests selling pressure may be easing.
- The 1H chart shows neutral stabilization — price sits above the hourly EMA20 and EMA50 but remains below the EMA200 at $112.78.
- 15m RSI14 at 72.60 signals overbought conditions on the execution timeframe, indicating the intraday bounce is stretched.
- Oppenheimer recently downgraded Walmart shares to Perform from Outperform and removed its $140 price target ahead of the August 20 earnings report.
Daily Chart: Walmart Stock Remains Trapped Below Key Moving Averages
Is Walmart stock’s daily trend bearish? Yes. Price closed at $111.55, stacked below the EMA20 at $112.29, the EMA50 at $115.44, and the EMA200 at $116.17. On the daily timeframe, the stock ranged between $108.56 and $111.68. This moving-average alignment is textbook bearish. The system’s regime reading confirms the daily structure as bearish.
Momentum Indicators Show Easing Selling Pressure
RSI14 on the daily chart sits at 45.81. It is not deeply oversold. However, it confirms momentum leans negative rather than positive. Meanwhile, the daily MACD line at -1.23 remains below its signal line at -1.51. The histogram, however, is positive at 0.28. This suggests bearish momentum is losing steam. The trend itself has not yet flipped.
Meanwhile, the daily Bollinger Bands show the mid-band at $112.14. The upper band sits at $115.82 and the lower band at $108.46. Tuesday’s low of $108.56 pressed against that lower band before buyers stepped in. The bounce to $111.55 shows some appetite to defend the zone. ATR14 at 2.82 confirms daily ranges remain wide. This is typical for a stock digesting a downgrade ahead of earnings.
Pivot levels reinforce the near-term battle. The daily pivot stands at $110.60. Resistance sits at $112.63 (R1) and support at $109.51 (S1). Closing above the pivot but below R1 places Walmart stock in a contested zone. It is not clearly bullish, nor is it clearly breaking down.
1H Timeframe: A Modest Recovery Still Capped by the EMA200
Is the 1H chart turning bullish? Not yet. Price closed at $111.55, above the EMA20 at $110.92 and the EMA50 at $111.26. However, it remains below the EMA200 at $112.78. The 1H regime reads neutral rather than bullish. This confirms a pause in selling pressure, not a confirmed trend reversal.
RSI14 on the 1H chart reads 56.22. This mildly bullish reading supports the idea of a genuine short-term recovery attempt. The MACD line at -0.20 is still below its signal at -0.33. However, the histogram at 0.13 shows the gap narrowing. Momentum is improving, even if it has not turned fully positive.
Bollinger Bands and Pivots Frame the Hourly Range
Bollinger Bands on the hourly chart show price pressing close to the upper band at $111.82. The mid-band sits at $110.83 and the lower band at $109.84. ATR14 of just 0.76 suggests the move has been contained but directional. The hourly pivot stands at $111.48. Resistance is at $111.75 and support at $111.28. Price is essentially parked at the pivot, testing whether it can push through to R1.
15m Execution View: Intraday Momentum Looks Stretched
Is the 15m chart overbought? Yes. RSI14 sits at 72.60, firmly in overbought territory for this timeframe. Price closed at $111.55, above the EMA20 at $110.78, the EMA50 at $110.70, and the EMA200 at $111.22. This creates a fully bullish short-term alignment. But the RSI reading warns the bounce is stretched.
The 15m MACD line at 0.29 sits above its signal at 0.15. The histogram is positive at 0.14, confirming active bullish momentum. Bollinger Bands show price near the upper band at $111.65 against a mid-band of $110.56. This looks more like a stretched intraday push than a fresh breakout. ATR14 at just 0.24 confirms how tight the recent 15-minute ranges have been.
Notably, the 15m pivot stands at $111.54 with resistance at $111.69 and support at $111.41. This frames a tight decision zone for timing entries or exits around this bounce. The 15m chart does not override the daily bearish backdrop. It is useful only for execution timing.
Bullish and Bearish Scenarios for Walmart Stock
What are the competing scenarios for Walmart stock? The core tension is clear. The daily regime is bearish, with price under every major EMA and momentum still negative. At the same time, the 1H and 15m charts show a recovering — even overbought — short-term structure. This is a classic lower-timeframe bounce inside a higher-timeframe downtrend. The conflict is not resolved but worth watching closely.
The Bullish Case
For bulls to gain real traction, Walmart stock would need to reclaim the daily EMA20 near $112.29 and hold above the R1 pivot at $112.63. A daily MACD histogram that keeps expanding positively would help. RSI14 pushing convincingly back above 50 would add credibility to a broader recovery attempt. Sustained buying that carries price toward the daily Bollinger mid-band at $112.14 — and eventually challenges the EMA50 at $115.44 — would start repairing the technical damage. The long-term investment case offers a fundamental backdrop bulls can lean on. Yahoo Finance highlights e-commerce growth, the Walmart Connect advertising business, and AI investments as key drivers.
The Bearish Case
Meanwhile, the bearish case remains intact as long as price stays capped below the daily EMA20 and EMA50. A failure at R1 near $112.63, followed by a break of S1 support at $109.51, would reopen the path toward the lower Bollinger band around $108.46. Oppenheimer recently downgraded Walmart shares to Perform from Outperform and removed its $140 price target. The firm cited a difficult near-term setup ahead of the August 20 earnings report. This near-term skepticism from Wall Street adds weight to the bearish scenario. If the short-term bounce fades and the 1H chart rolls back under its EMA20, the daily downtrend would likely reassert itself quickly.
Closing Take on Walmart Stock
Overall, where does Walmart stock stand? It sits in a technically mixed spot. The daily chart is bearish. The hourly chart is tentatively stabilizing. The 15-minute view is stretched. Volatility, as measured by ATR across all three timeframes, remains elevated enough to justify caution in either direction.
With Oppenheimer’s downgrade still fresh and the August 20 earnings report approaching, positioning around Walmart stock is likely to stay reactive and range-bound. This will persist until one timeframe decisively confirms the other. Until then, uncertainty — not conviction — appears to be the dominant theme.
FAQ
Is Walmart stock in a daily downtrend?
Yes. Walmart stock closed at $111.55 on August 4, below its daily EMA20 at $112.29, EMA50 at $115.44, and EMA200 at $116.17. The daily RSI14 at 45.81 also confirms negative momentum, though the MACD histogram turning positive at 0.28 suggests selling pressure may be easing.
What are the key levels to watch for Walmart stock?
On the upside, reclaiming the daily EMA20 near $112.29 and the R1 pivot at $112.63 would signal bullish progress. On the downside, a break of S1 support at $109.51 would reopen the path toward the lower Bollinger band around $108.46.
Why was Walmart stock recently downgraded?
Oppenheimer downgraded Walmart shares to Perform from Outperform and removed its $140 price target, citing a difficult near-term setup ahead of the August 20 earnings report.
Is the current bounce in Walmart stock a reversal?
Not yet. The 1H chart shows neutral stabilization rather than a confirmed bullish reversal. Price remains below the hourly EMA200 at $112.78. The 15m chart shows overbought conditions, suggesting the intraday bounce may be stretched rather than the start of a sustained recovery.
Disclaimer: This article is for informational purposes only and does not constitute financial advice, an investment recommendation, or a solicitation to buy or sell any financial instrument or cryptocurrency. The analysis provided is not indicative of future results. Investing in crypto assets and financial markets carries a high risk of capital loss. Always do your own research (DYOR) and consult a qualified financial advisor before making any decision.
Article produced with the assistance of artificial intelligence and reviewed by the editorial team.
