




Walmart stock closed at $113.10 on July 28, 2026, hovering above the daily EMA20 but below longer-term moving averages. WMT faces a tense equilibrium — hourly momentum builds while daily resistance overhead remains unresolved.
Summary
Key takeaways
- Walmart stock closed at $113.10, just above its daily EMA20 at $112.71 but well below the EMA50 and EMA200 near $116.30.
- The daily MACD histogram turned positive at +0.24, signaling bearish momentum deceleration rather than a confirmed buy signal.
- Hourly momentum is constructive, with the 1H MACD positive and RSI at 58.45, but the 1H EMA200 at $113.48 acts as immediate overhead resistance.
- The $111.95–$115.14 range defines the near-term battlefield; directional clarity requires a decisive break outside this band.
- Amazon displacing Walmart atop the Fortune Global 500 and political scrutiny over $37.6 billion in buybacks continue to weigh on sentiment.
Walmart Stock Navigates a Tense No-Man’s Land
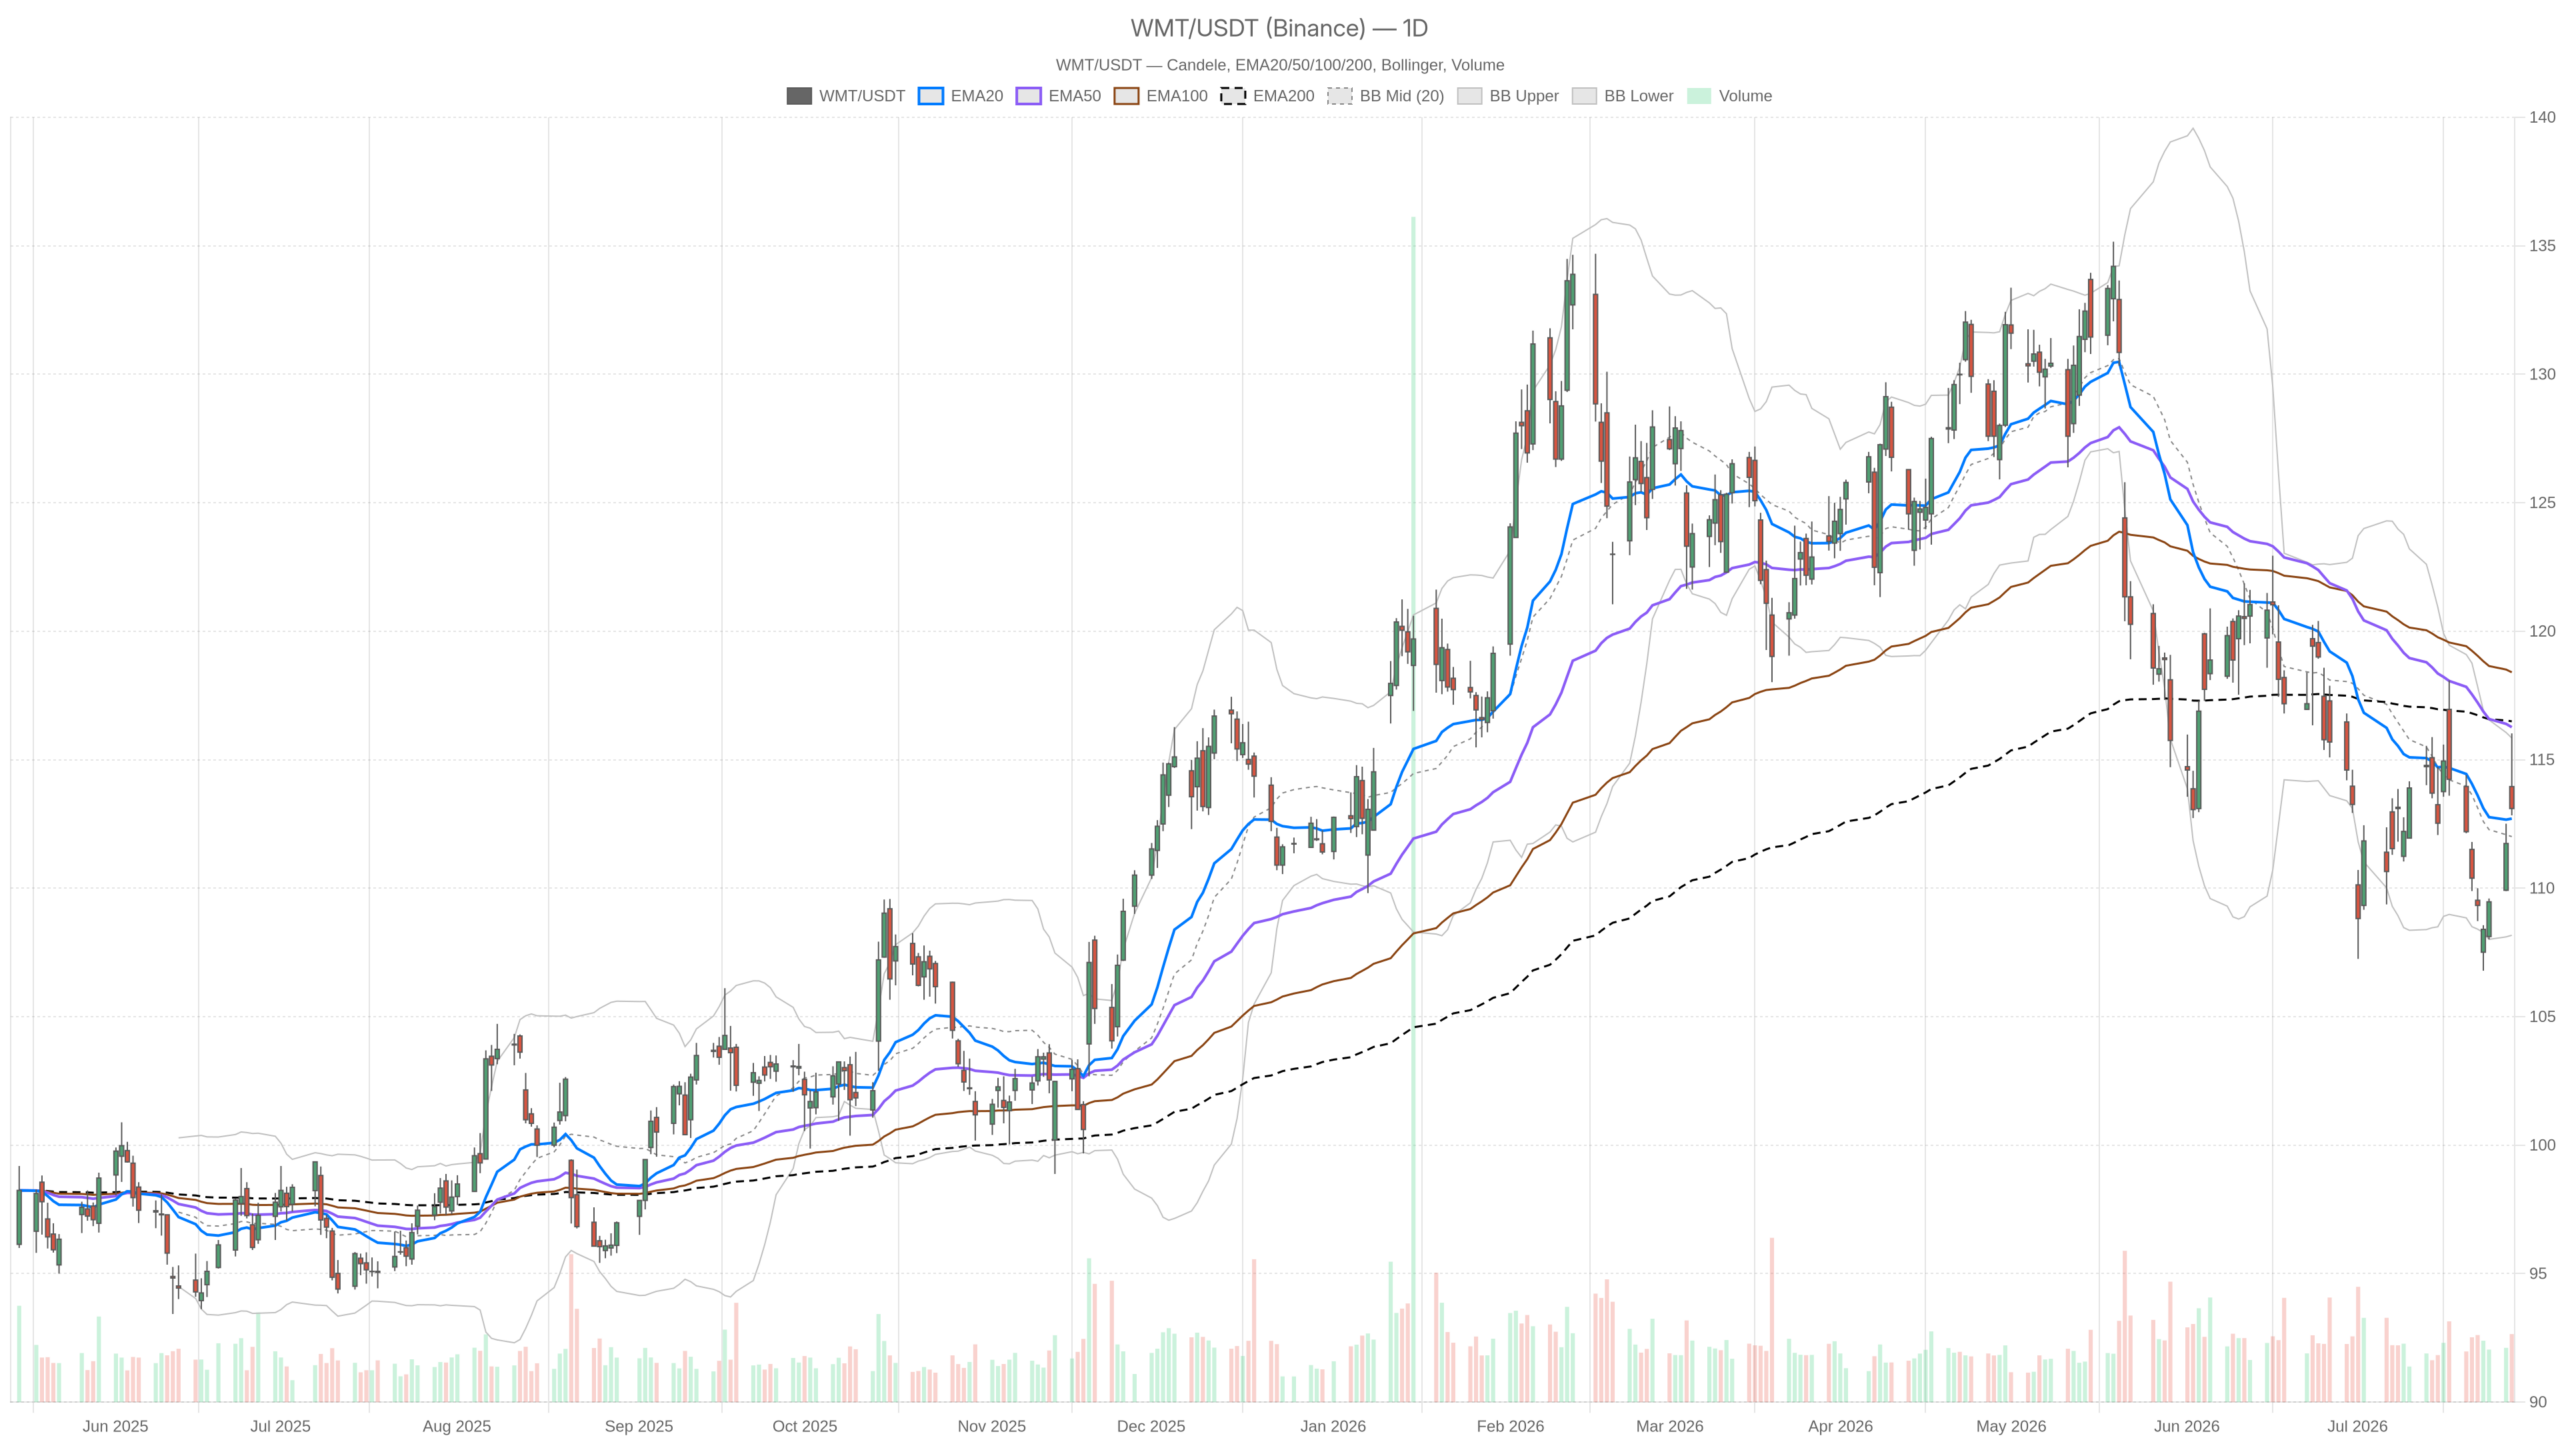
Walmart stock is trading in a structurally ambiguous zone. WMT closed at $113.10 on the daily chart, just above its EMA20 at $112.71. However, it sits meaningfully below both the EMA50 at $116.27 and the EMA200 at $116.49. The daily regime is flagged as neutral — and that label fits. The stock is neither in free fall nor staging a convincing recovery. It hovers in a contested range where bulls must prove themselves and bears still hold the structural advantage.
Meanwhile, the broader context adds complexity. Amazon has just unseated Walmart from the top spot on the Fortune Global 500, ending a 12-year run for the Walton-led retailer. That headline alone will not move prices directly, but it reinforces a narrative shift. At the same time, political pressure has surfaced. Senator Bernie Sanders publicly criticized Walmart’s $37.6 billion in stock buybacks while workers rely on government assistance. These are not technical signals — but they shape sentiment and weigh on institutional confidence.
Daily Timeframe: Neutral Bias With Bearish Structural Overhang
The daily chart for Walmart stock paints a neutral picture with bearish undertones. Price holds above the short-term EMA20 but remains trapped below the EMA50 and EMA200. This inversion signals the longer-term trend is still under pressure.
Trend Structure and Key Resistance
On the daily chart, the EMA structure tells a clear story. Price is above the short-term EMA20, but only marginally. Both the EMA50 and EMA200 sit well above current price. That inversion is a bearish configuration. It means any near-term bounce operates against the grain of the dominant structure.
Notably, Bollinger Band positioning adds further nuance. The daily midband sits at $112.01, and WMT closed above it at $113.10. The upper band stands at $115.85, aligning closely with both the EMA50 and the intraday high of $116.03. That cluster of resistance at the $115.85–$116.49 zone is formidable. On the downside, the lower band at $108.17 provides a soft floor. The daily ATR of $2.59 reflects moderate volatility — enough for meaningful daily swings but not an environment of elevated fear.
Momentum Signals and Pivot Levels
The MACD reinforces this cautious reading. The MACD line sits at -1.69, with the signal line at -1.93. However, the histogram has turned positive at +0.24, signaling that bearish momentum is losing steam. This is not a buy signal. It is a deceleration of selling — a subtle but meaningful distinction. The daily RSI at 48.63 is essentially neutral, sitting just below the midpoint without any oversold condition to anchor a reversal case.
Therefore, pivot levels warrant close attention. The daily pivot at $113.99 is relevant — WMT closed below it at $113.10, a mild negative. R1 resistance sits at $115.14, and S1 support lies at $111.95. A close below $111.95 would be technically damaging.
Hourly Picture: Short-Term Momentum Quietly Building
Walmart stock’s hourly chart offers a more constructive short-term view. Price at $113.10 sits above both the 1H EMA20 at $112.10 and EMA50 at $111.55. Notably, the 1H EMA200 at $113.48 is the only moving average currently above price on this timeframe. That level deserves attention as an immediate overhead hurdle.
The 1H MACD is positive, with the line at +0.98 above the signal at +0.81 and a histogram of +0.17. This confirms that intraday buying pressure has been building and has not yet exhausted itself. The 1H RSI at 58.45 supports this reading — elevated without being overbought, leaving room for further upside on the hourly.
Therefore, the daily and hourly views carry a genuine tension. Daily structure is bearish-leaning neutral, while hourly momentum is constructive. This is precisely the kind of conflict that traps swing traders. Short-term buyers have the intraday wind at their backs, but they are pushing into a daily headwind that has not resolved.
15-Minute Context: Intraday Fatigue Setting In
The 15-minute chart for Walmart stock shows early signs of intraday fatigue. Momentum is cooling after a short push higher, with the MACD histogram turning negative at -0.17. The MACD line at +0.03 barely holds above zero. Meanwhile, the RSI at 45.96 has slipped below the midpoint, reflecting short-term cooling after the intraday advance.
Still, the 15m EMA structure remains bullish. Price is above both the EMA50 at $112.72 and EMA200 at $111.70. The 15m ATR is just $0.28, indicating very tight intraday oscillations. This is not a breakout environment. It is a market pausing after a short push. The immediate path depends on whether buyers can reclaim the $113.27–$113.48 zone or whether the session stalls here.
The Bullish Scenario: What Would Support a Move Higher
A bullish case for Walmart stock hinges on the bounce from the $108 area — referenced in recent analyst commentary — back above the daily EMA20 and Bollinger midband. The daily MACD histogram turning positive suggests the worst of the selling pressure may have passed. However, confirmation is still required before conviction can build.
In addition, fundamental tailwinds support the thesis. Walmart’s gains with higher-income shoppers, driven by competitive pricing, faster delivery, and product breadth, represent a structural demand shift. If that trend holds, it provides earnings support going into the next reporting cycle. A daily close above $115.14 — the daily R1 — would be a meaningful technical confirmation. A sustained reclaim of $116.27 would shift the daily structure from neutral back toward bullish.
The Bearish Scenario: Where the Bull Case Breaks Down
The bearish case for Walmart stock carries more structural weight right now. Both the EMA50 and EMA200 sit at $116.27 and $116.49 respectively — a double resistance ceiling that price has failed to reclaim. The Fortune Global 500 leadership change from Walmart to Amazon is largely symbolic. However, it may accelerate a narrative rotation away from WMT as the benchmark defensive retail name.
On the other hand, political pressure around Walmart’s $37.6 billion buyback program and worker compensation practices could resurface as a regulatory or reputational risk. Technically, a break below daily S1 at $111.95 would bring the $108.17 lower Bollinger band back into play. A close below $108 would represent a meaningful deterioration. The daily RSI at 48.63 has room to fall — it is not oversold and offers no contrarian support if selling resumes.
Positioning in an Uncertain Environment
Overall, Walmart stock sits at an inflection point without a clean directional signal. The daily bias is neutral with a bearish structural tilt. The hourly momentum is modestly constructive. The 15-minute chart shows early signs of intraday fatigue near resistance. These three timeframes are not aligned, and that dissonance should temper conviction in either direction.
Volatility, as measured by the daily ATR of $2.59, remains manageable but wide enough for meaningful risk. The $111.95–$115.14 range defines the near-term battlefield. Until WMT breaks decisively out of that band with volume, this is a range-trading environment. A close above the EMA cluster near $116.30 or below $111.95 on the daily would provide needed clarity. In the meantime, disciplined range levels and clear invalidation points matter more than directional conviction.
FAQ
Is Walmart stock in a bullish or bearish trend right now?
Walmart stock is in a neutral daily regime with a bearish structural tilt. Price sits above the EMA20 at $112.71 but remains below both the EMA50 at $116.27 and EMA200 at $116.49, meaning the longer-term trend stays under pressure despite short-term stabilization.
What are the key resistance levels for WMT?
The $115.85–$116.49 zone forms formidable resistance, clustering the daily upper Bollinger Band, the EMA50, and the EMA200. Nearer-term hurdles include the daily R1 at $115.14 and the 1H EMA200 at $113.48.
What would confirm a bullish reversal for Walmart stock?
A daily close above $115.14 — the daily R1 — would provide meaningful technical confirmation. A sustained reclaim of the EMA50 at $116.27 would shift the daily structure from neutral back toward bullish, invalidating the bearish overhang.
What fundamental factors are currently affecting Walmart stock?
Amazon recently displaced Walmart atop the Fortune Global 500, ending a 12-year run. Additionally, Senator Bernie Sanders has publicly criticized Walmart’s $37.6 billion in stock buybacks while workers rely on government assistance. These factors affect sentiment and institutional confidence in the near term.
Disclaimer: This article is for informational purposes only and does not constitute financial advice, an investment recommendation, or a solicitation to buy or sell any financial instrument or cryptocurrency. The analysis provided is not indicative of future results. Investing in crypto assets and financial markets carries a high risk of capital loss. Always do your own research (DYOR) and consult a qualified financial advisor before making any decision.
Article produced with the assistance of artificial intelligence and reviewed by the editorial team.
