




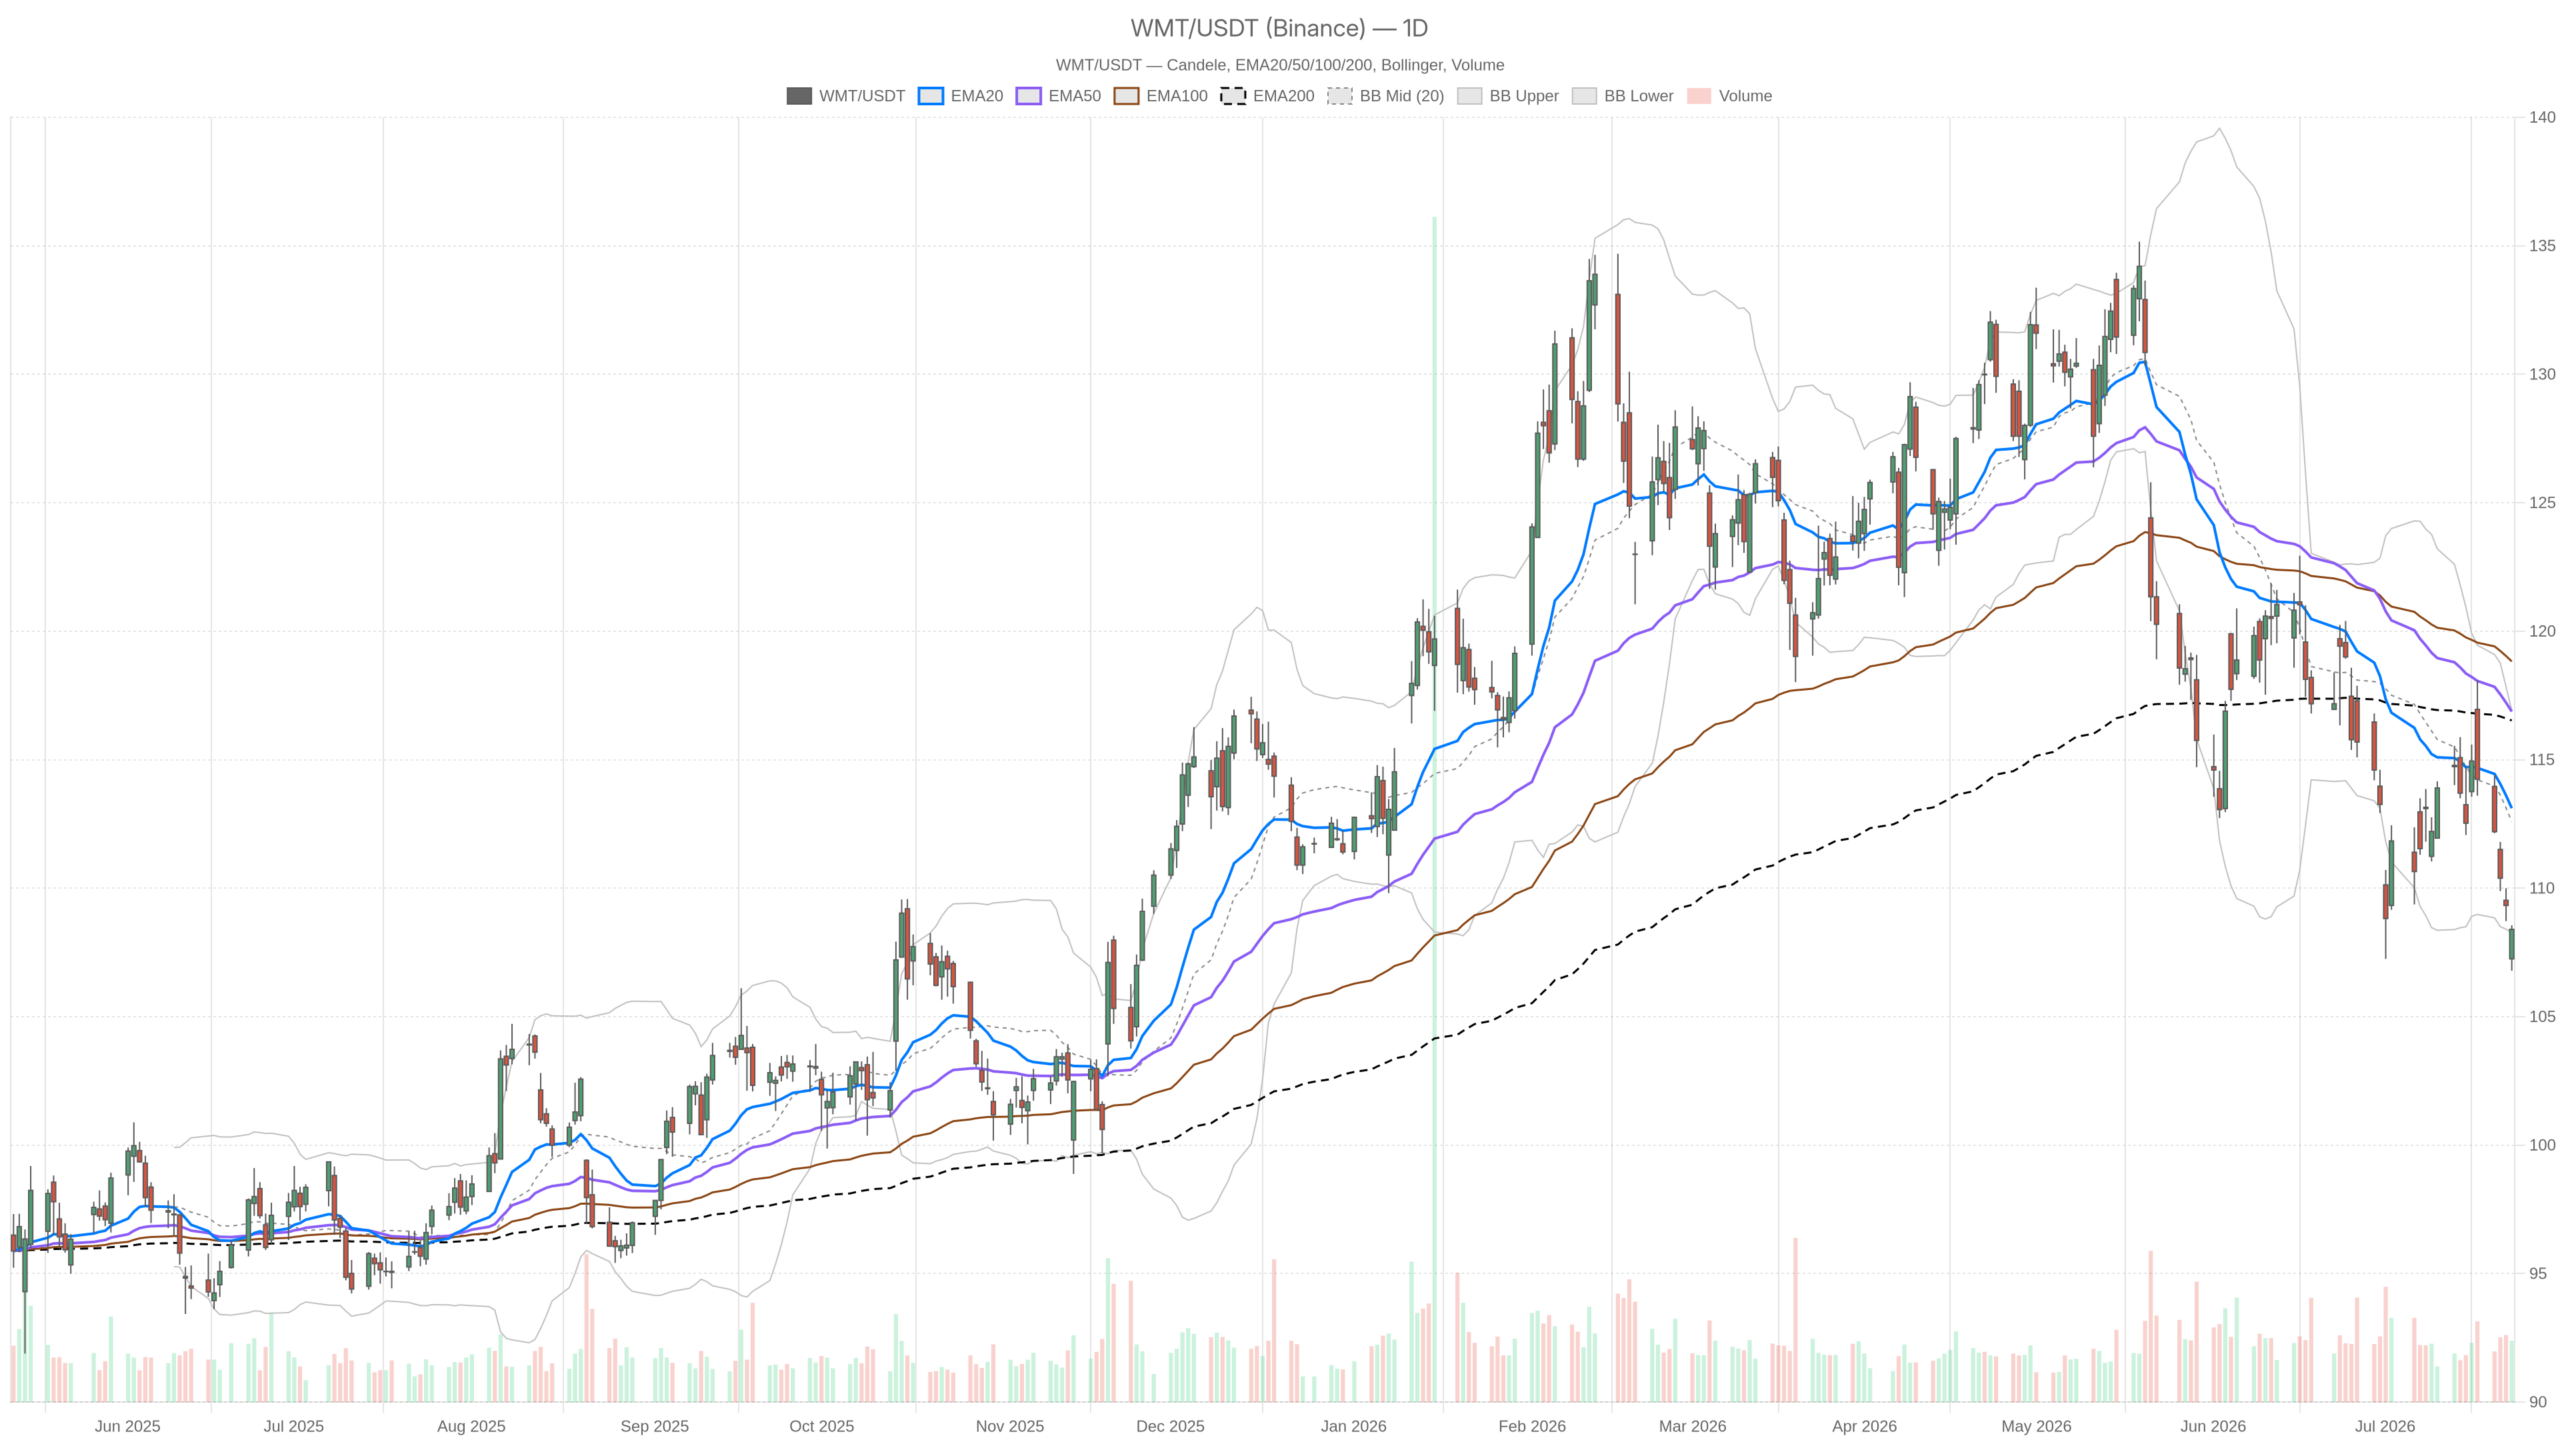
Walmart stock closed at $108.40 on July 23, trading below all key daily moving averages. The technical structure across timeframes confirms a bearish bias. Still, short-term signals suggest the selling pressure may briefly pause near the lower Bollinger Band.
Summary
Key takeaways
- WMT closed at $108.40, below the daily EMA20 ($113.11), EMA50 ($116.88), and EMA200 ($116.53).
- Daily RSI14 at 34.66 approaches oversold territory without crossing it, signaling continued weakness rather than reversal.
- The hourly MACD histogram has turned marginally positive at +0.06, hinting at slowing downside momentum intraday.
- WMT has posted a 6.7% loss over six months while the S&P 500 gained 7.7%, reflecting significant relative underperformance.
- The $107.28–$109.04 range represents the critical near-term pivot zone for directional conviction.
Daily Timeframe: Walmart Stock’s Weakening Trend
The daily chart confirms a clear bearish trend for Walmart stock. Price sits below all three key exponential moving averages, and the RSI is approaching oversold levels. As a result, recovery traction remains limited in this structure.
EMA Stack Confirms Bearish Structure
The daily EMA stack for Walmart stock shows a decisively bearish alignment. The EMA20 sits at $113.11, the EMA50 at $116.88, and the EMA200 at $116.53. Price at $108.40 trades below all three — reflecting months of sustained selling pressure.
Meanwhile, Bollinger Bands place the lower boundary at $108.27, almost exactly where WMT closed. A close near the lower band does not automatically signal a reversal. However, it does indicate the stock is stretched to the downside on a daily basis. The ATR14 of 2.53 suggests daily ranges remain meaningful, giving both bulls and bears room to operate.
Momentum Indicators Flash Caution
The RSI14 on the daily stands at 34.66. That reading approaches oversold territory without crossing it. This typically signals continued weakness rather than imminent reversal. It is a warning sign — not a buy signal, at least not yet.
Notably, the daily MACD shows the line at -2.10 versus a signal at -1.96. This produces a histogram of -0.14. The histogram is marginally negative and slightly widening. The momentum bias for WMT remains bearish, though the pace of deterioration is not accelerating sharply. The daily regime is flagged as neutral, reflecting a market that trends lower but may be losing momentum at current levels.
In terms of structure, daily pivot analysis places the pivot point at $107.92. Resistance R1 sits at $109.04, while support S1 rests at $107.28. WMT currently trades between R1 and the pivot — a zone where directional conviction is often tested. A break above $109.04 would be the first structural hint that buyers are pushing back.
Hourly View: Bearish Control Holds on Walmart Stock
The hourly chart reinforces the bearish narrative for Walmart stock. The regime is explicitly flagged as bearish, with the EMA20 and EMA50 both sitting above current price. Any near-term bounces remain within a downtrend structure.
Trend Structure Remains Intact
The EMA20 at $109.21 and EMA50 at $110.98 both sit above the current price of Walmart stock. This confirms that near-term bounces remain capped within a downtrend. The EMA200 on the hourly at $114.02 adds another layer of overhead resistance.
The hourly RSI at 37.72 remains well below the 50 neutral level. Short-term momentum bias stays firmly negative. Meanwhile, the hourly Bollinger Bands show a midpoint of $109.06, with price trading below it — consistent with bearish structure. Hourly pivot levels place support at $107.95 and resistance at $108.68. This tight range will likely determine the immediate intraday trajectory.
Early Signs of Momentum Exhaustion
However, the hourly MACD offers a small but notable divergence from the daily picture. The MACD line is at -1.19 while the signal stands at -1.25. The histogram has turned marginally positive at +0.06. This is a minor development, but it indicates the rate of decline is slowing at the intraday level. It does not override the trend; it simply introduces caution about chasing shorts at current prices.
15-Minute Context: Short-Term Stability for WMT
The 15-minute chart shows a shift toward stability for WMT. The regime is flagged as neutral, with momentum indicators suggesting modest buying activity into the close. This provides execution-level context rather than a trend-changing signal.
Notably, the RSI14 has climbed to 54.15 — the only timeframe where momentum sits above the neutral midpoint. The 15m MACD histogram is positive at +0.09, confirming modest short-term buying activity into the close of July 23.
Price at $108.38 sits above both the 15m EMA20 ($108.08) and the Bollinger Band midpoint ($108.00). This suggests near-term intraday positioning has tilted slightly constructive. Still, it confirms only that late-session price action was not deteriorating further.
Fundamental Backdrop: Wide Moat, Softer Results for Walmart Stock
The fundamental picture for Walmart stock is mixed but not alarming. On the positive side, Walmart has been highlighted as a wide-moat stock, offering competitive durability and consistent returns. Its dividend track record remains intact, with the company continuing quarterly payouts to shareholders.
In contrast, WMT has posted a 6.7% loss over the past six months. During the same period, the S&P 500 gained 7.7%. That relative underperformance has been attributed partly to softer quarterly results. On the operational side, Walmart’s partnership with ReturnPro reflects a continued push to recover margin from e-commerce return costs — a growing pressure point for large-format retailers.
Bullish Scenario for Walmart Stock
A credible bullish reversal for Walmart stock would require a decisive reclaim of key resistance levels. Without clearing the $109.04 daily R1 pivot, any bounce remains corrective within the broader downtrend.
Specifically, a decisive move above $109.04 would mark the first test. The next meaningful hurdle sits at the $109.21 hourly EMA20. If WMT can close above those levels on volume, it would suggest the lower Bollinger Band is acting as a floor. A rising daily RSI back toward the 40–45 range would add weight to the recovery case. Additionally, the daily MACD histogram turning positive would provide confirmation.
The wide-moat classification and dividend consistency provide a fundamental backdrop that could attract value-oriented buyers if price stabilizes near current levels.
Bearish Scenario: Path of Least Resistance for WMT
The bearish case remains the path of least resistance for Walmart stock. A break below $107.28 — the daily S1 support — would reinforce the dominant downtrend and open the door toward a deeper correction.
With all three daily EMAs stacked well above current price, there is no nearby dynamic support to arrest a move lower. The daily RSI, already approaching oversold levels, would likely deepen before producing a tradeable bounce. The six-month relative underperformance versus the broader market adds to the concern. Continued soft operational results or any broader risk-off rotation would likely accelerate selling pressure in WMT.
Positioning and Volatility Outlook for Walmart Stock
Overall, Walmart stock remains in a technically weak position across timeframes. The daily chart defines a bearish bias, and the hourly confirms it with only faint signs of momentum exhaustion. The stock is compressed near the lower Bollinger Band — a zone that often precedes sharp directional moves.
With ATR running at $2.53 daily, volatility is real but not extreme. The 15-minute frame offers no more than a short-term stabilization signal near the close. Traders should watch the $107.28–$109.04 range closely. A break in either direction is likely to carry conviction.
FAQ
What is the current technical outlook for Walmart stock?
Walmart stock is in a bearish trend as of July 23, trading at $108.40 below all three key daily EMAs. The daily RSI14 at 34.66 and the negative MACD histogram confirm sustained selling pressure, though the hourly MACD shows early signs of momentum exhaustion.
What are the key support and resistance levels for WMT?
The critical support sits at $107.28 (daily S1 pivot), with the lower Bollinger Band near $108.27 providing nearby structural support. On the upside, resistance stands at $109.04 (daily R1) and $109.21 (hourly EMA20). A breakout beyond this $107.28–$109.04 range is likely to carry directional conviction.
Is Walmart considered a fundamentally strong stock?
Walmart is classified as a wide-moat stock with competitive durability and a consistent dividend track record. However, WMT has posted a 6.7% loss over six months while the S&P 500 gained 7.7%, with softer quarterly results contributing to the underperformance.
Disclaimer: This article is for informational purposes only and does not constitute financial advice, an investment recommendation, or a solicitation to buy or sell any financial instrument or cryptocurrency. The analysis provided is not indicative of future results. Investing in crypto assets and financial markets carries a high risk of capital loss. Always do your own research (DYOR) and consult a qualified financial advisor before making any decision.
Article produced with the assistance of artificial intelligence and reviewed by the editorial team.
