



Intel stock faces a rare tension after Q2 earnings. The company delivered its fastest revenue growth in nearly 15 years, yet INTC closed at $100.23 — well below key moving averages and close to daily support. The fundamental catalyst is bullish. The technical structure is not.
Summary
Key takeaways
- Intel delivered 25.4% year-on-year revenue growth in Q2 2026, reaching $16.13 billion and beating Wall Street expectations.
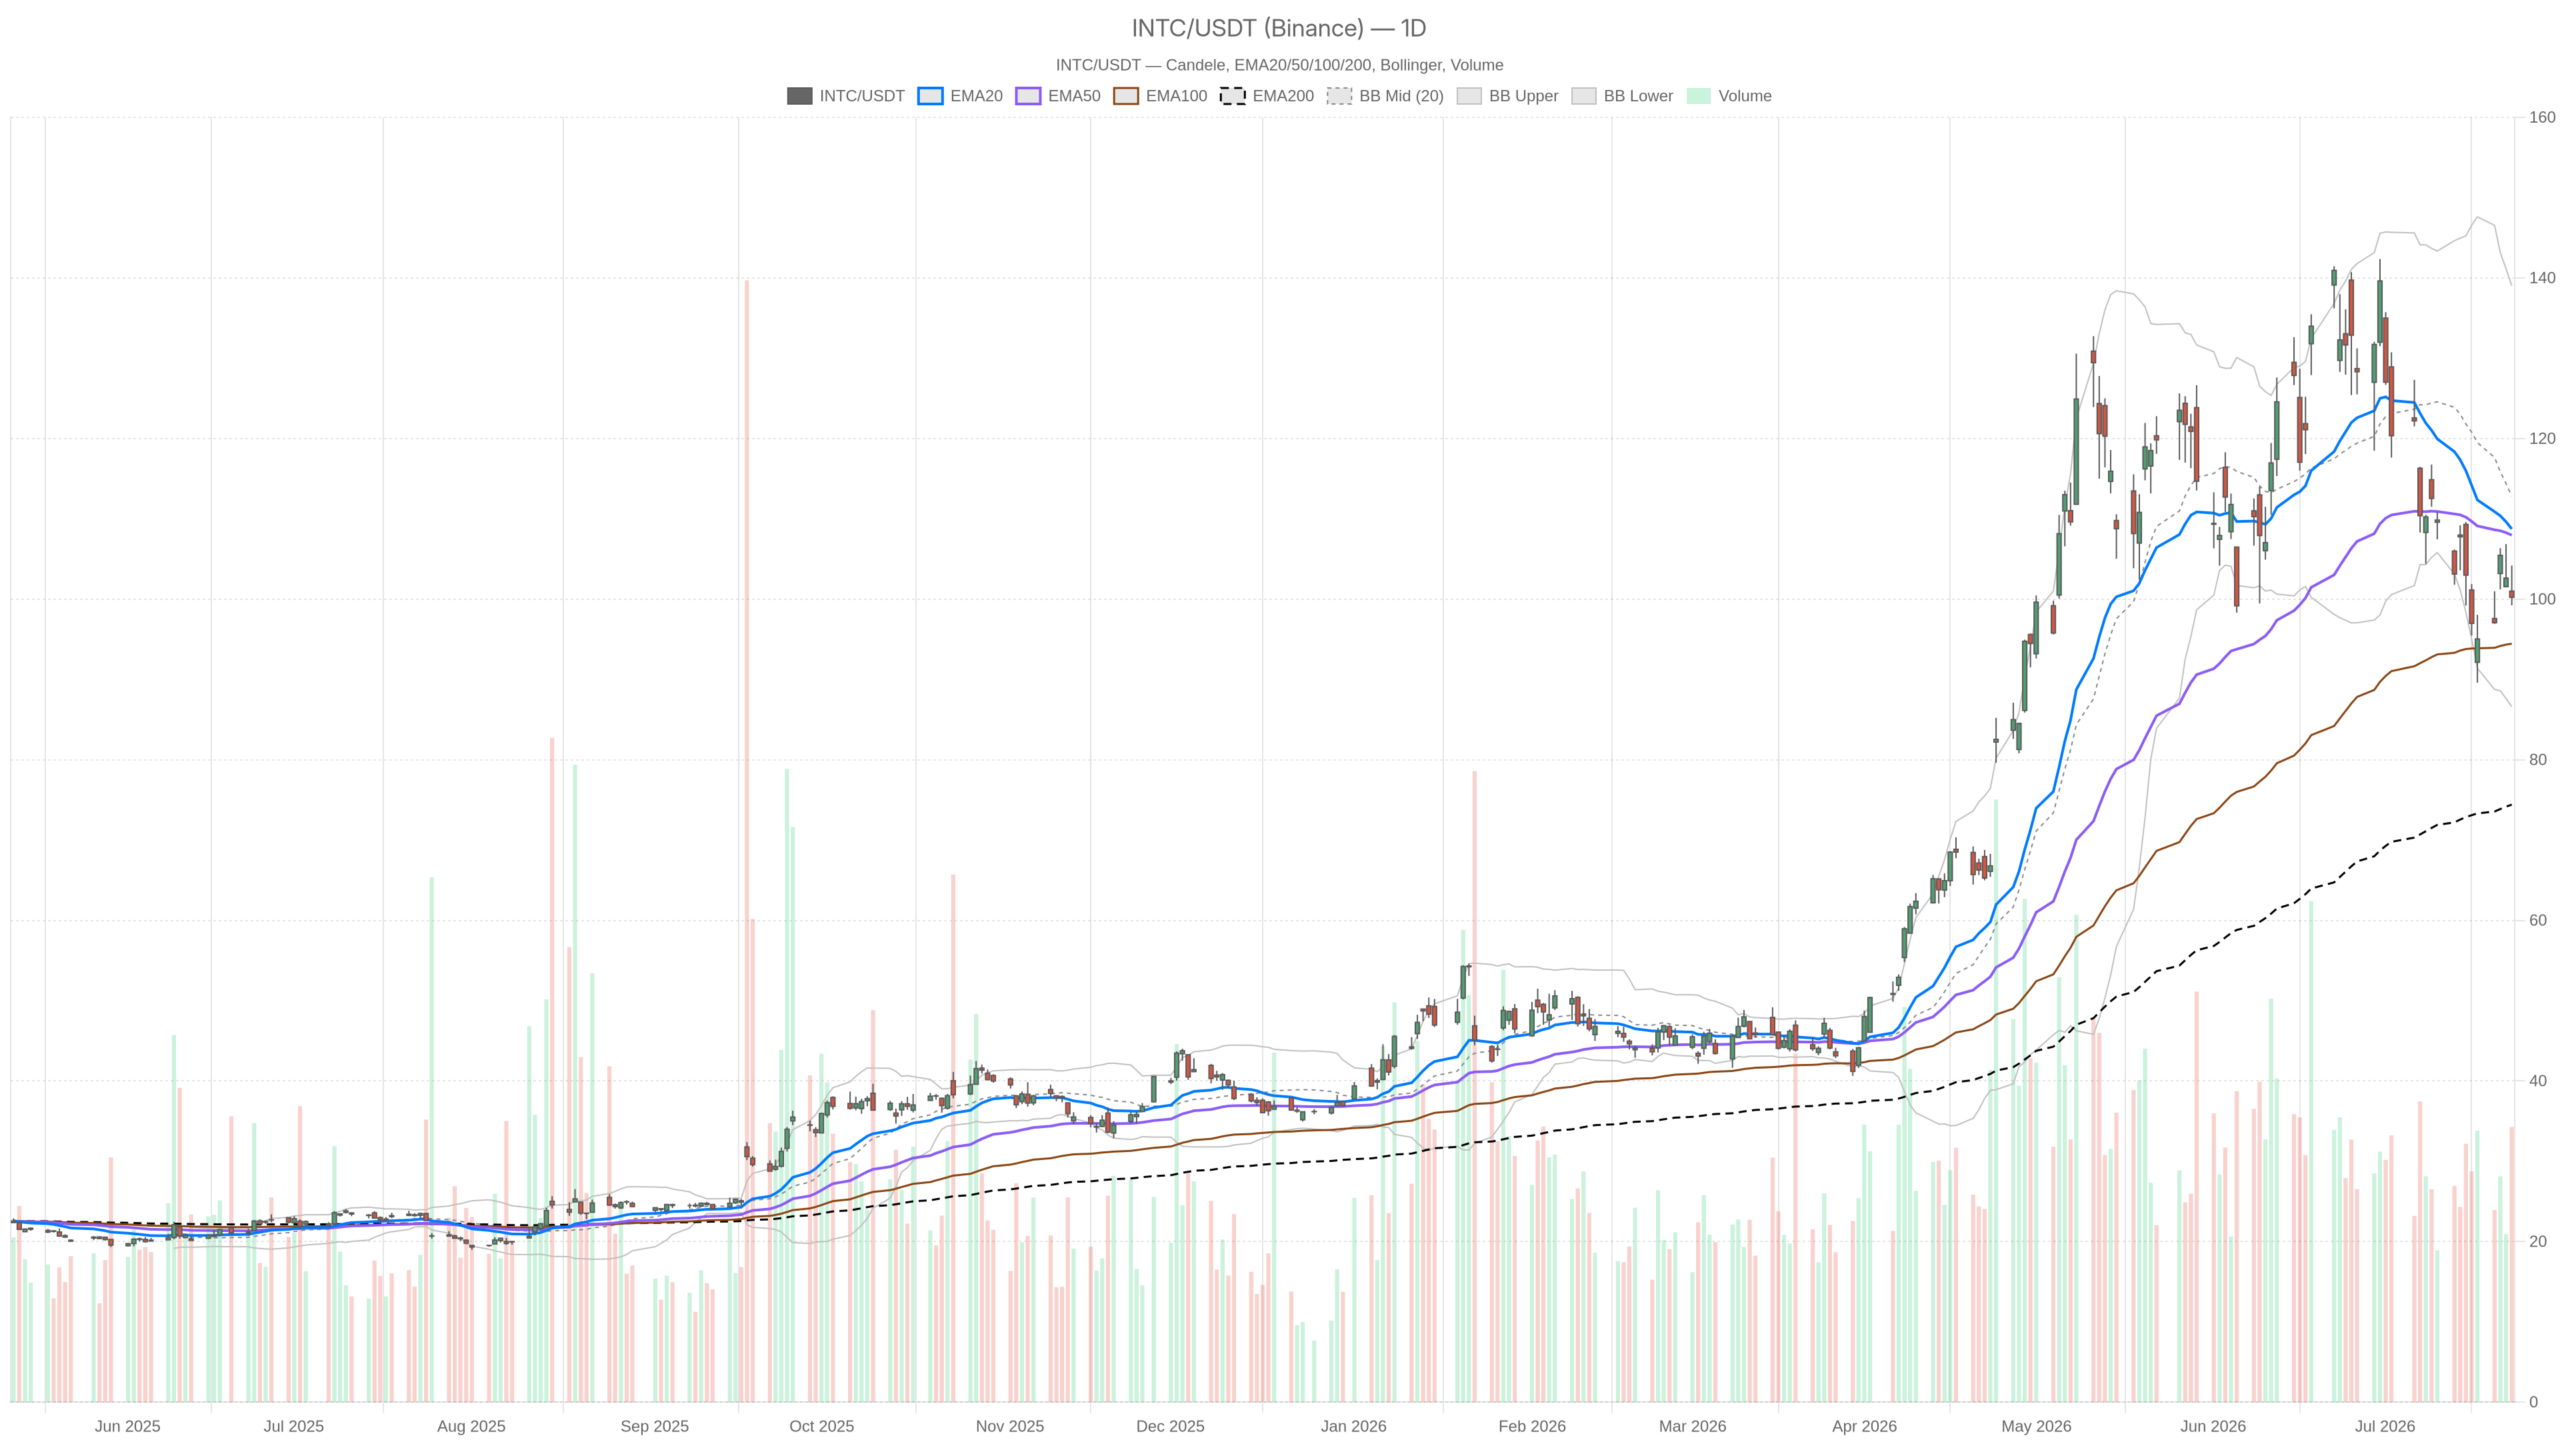
- INTC closed at $100.23 on July 23, trading well below both the daily EMA20 ($108.74) and EMA50 ($107.97).
- Daily RSI sits at 41.89 — below the neutral 50 threshold but not yet oversold, offering no mean-reversion signal.
- The daily ATR of $7.47 signals high volatility, with meaningful two-sided swings likely in post-earnings sessions.
- Forward guidance of $16.3 billion came in 7.8% above analyst consensus, reinforcing the fundamental bull case.
Q2 Earnings Provide a Strong Fundamental Foundation for Intel Stock
Intel’s Q2 2026 results delivered a powerful fundamental foundation for the stock. Revenue reached $16.13 billion, up 25.4% year on year — well ahead of Wall Street expectations. Forward guidance came in at $16.3 billion at the midpoint, 7.8% above analyst consensus.
The quarter was driven by AI advancements and strategic partnerships. Inventory levels also showed improvement. Meanwhile, chipmaking equipment names like ASML, Applied Materials, KLA Corp, and Lam Research rallied on the back of Intel’s capital expenditure increase. This signals the market read the spending as a credible long-term commitment.
That fundamental backdrop is real and meaningful. The question, however, is whether it is enough to reverse a chart that remains under sustained technical pressure.
Daily Timeframe — Bearish Structural Pressure Dominates
Bearish structural pressure remains the dominant bias on the daily chart for Intel stock. INTC closed at $100.23 on July 23, trading beneath both the EMA20 at $108.74 and the EMA50 at $107.97. That gap — roughly 7–8% below short-term trend averages — means the burden of proof still sits with the bulls.
Momentum Indicators Flash Warning Signals
The Bollinger Band midline on the daily chart sits at $112.82, far above current price. INTC is trading in the lower half of the band, with the lower band at $86.61. This positioning reflects a stock under distribution pressure, not one building for a breakout.
At the same time, daily RSI at 41.89 is below the neutral 50 threshold. It is not yet in oversold territory, so there is no classic mean-reversion bounce signal. MACD reinforces the bearish read — the line is at -5.11, the signal at -3.54, and the histogram at -1.57. Momentum is negative and still deteriorating.
The ATR at $7.47 underscores how volatile Intel stock is on a daily basis.
Pivot Levels Highlight Intraday Fragility
Daily pivot sits at $101.22, with R1 at $103.20 and S1 at $98.25. The close of $100.23 places INTC just below the pivot — a subtle but telling detail. The stock failed to hold even this neutral reference point by the close.
Hourly View Confirms the Bearish Lean
The hourly view confirms the bearish lean with no softening of the daily picture. Price at $100.23 sits below the 1H EMA20 at $101.94 and the EMA50 at $102.74. It also trades deeply below the EMA200 at $111.54.
All three EMAs are stacked against the bulls on an intraday basis. The 1H RSI at 44.29 mirrors the daily — subdued, not oversold, not recovering. Meanwhile, the 1H MACD histogram is at -0.59, with the line below the signal line. Selling pressure on the hourly is active, not fading.
The Bollinger midline on the 1H is at $103.46, again above price. This confirms INTC is trading in a weakened zone relative to its recent mean. The 1H ATR of $2.15 suggests meaningful intraday swings remain possible.
Hourly pivots show R1 at $100.88 and S1 at $99.48. The close at $100.23 sits between these two levels. This compressed range offers little directional conviction in the immediate term.
15-Minute Chart: One Small Positive Amid the Noise
The 15-minute chart offers one small positive amid the noise — a slightly positive MACD histogram. However, the regime remains bearish overall. Price stays below all three EMAs — the EMA20 at $100.70, the EMA50 at $101.82, and the EMA200 at $102.24.
The MACD histogram on the 15m has turned slightly positive at +0.09. This is a minor and early signal. It does not reverse the broader picture, but it does suggest the selling impulse may be momentarily losing velocity at the micro level.
Overall, the 15m ATR of $0.81 and the tight Bollinger band range of $98.87–$102.15 indicate the stock was compressing into the close. This kind of compression often precedes a directional move — though the direction remains the open question.
The Bullish Scenario: Can Intel Stock Reclaim Lost Ground?
The bullish case is straightforward — a Q2 beat of this magnitude should force a repricing of Intel stock. Revenue growth of 25.4% and guidance 7.8% above consensus provide the fundamental fuel. If institutional buyers step in following the earnings release, INTC could push back above the daily pivot at $101.22. From there, it could challenge R1 at $103.20.
A sustained move above $103–$104 would start threatening the EMA50 at $107.97 and the EMA20 at $108.74. Reclaiming both on the daily would represent a genuine structural shift. Notably, the EMA200 at $74.41 sits far below current price — a long-term positive confirming the secular trend remains intact.
Still, for the bullish scenario to materialize, volume must confirm. The daily session saw 128.5 million shares change hands — an elevated reading reflecting earnings-day interest. Follow-through buying in subsequent sessions would be the key signal to watch.
The Bearish Scenario: When Technical Structure Overrides the Narrative
The bearish scenario warns that a strong earnings report does not automatically fix a broken chart. Technical structure could override the fundamental narrative if Intel stock fails to hold key levels. A slip through daily S1 at $98.25 would open the path toward the lower Bollinger band at $86.61 — a considerable distance requiring serious deterioration in sentiment.
In contrast to the bullish read, the daily MACD is still deepening in negative territory. RSI has not shown a bottom. If the earnings gap fades quickly — as happens when buy-the-rumor dynamics have already played out — the stock could revert toward its recent breakdown zone. The industry supply challenges noted in the earnings call provide a narrative for bears to hold onto.
The timeframe conflict is the crux of the analysis. Daily and hourly indicators are bearish in structure. The news flow is fundamentally bullish. This kind of divergence is exactly where many traders get caught on the wrong side — too early on a reversal, or too dismissive of a genuine fundamental shift.
Positioning, Volatility, and the Road Ahead for Intel Stock
Intel stock enters the post-earnings session in a technically fragile but fundamentally reinvigorated position. The daily ATR of $7.47 makes this a high-volatility name, where meaningful swings in either direction should be expected. Positioning without clear confirmation carries substantial two-sided risk — whether a breakout above $108 or a breakdown below $98.
The earnings story is compelling. But the price structure demands patience. Until INTC reclaims its daily EMAs and the MACD histogram turns positive on the daily chart, the technical bias remains weighted to the downside — regardless of the fundamental narrative. Conviction should follow confirmation, not precede it.
FAQ
Is Intel stock a buy after Q2 2026 earnings?
Intel’s Q2 2026 results were strong, with revenue up 25.4% year on year to $16.13 billion and forward guidance beating consensus by 7.8%. However, the technical picture remains bearish — INTC closed at $100.23, well below its daily EMAs. The fundamental and technical narratives are in conflict, and confirmation in either direction has not yet materialized.
What are the key technical levels to watch for Intel stock?
On the upside, Intel stock needs to reclaim the daily pivot at $101.22 and then challenge R1 at $103.20. A sustained move above $103–$104 would threaten the EMA50 at $107.97 and EMA20 at $108.74. On the downside, a break below S1 at $98.25 could open the path toward the lower Bollinger band at $86.61.
What is driving Intel’s fundamental strength?
Intel’s Q2 2026 performance was driven by AI advancements, strategic partnerships, and improving inventory levels. The company’s increased capital expenditure also lifted chipmaking equipment stocks like ASML, Applied Materials, KLA Corp, and Lam Research, signaling market confidence in Intel’s long-term commitment.
Disclaimer: This article is for informational purposes only and does not constitute financial advice, an investment recommendation, or a solicitation to buy or sell any financial instrument or cryptocurrency. The analysis provided is not indicative of future results. Investing in crypto assets and financial markets carries a high risk of capital loss. Always do your own research (DYOR) and consult a qualified financial advisor before making any decision.
Article produced with the assistance of artificial intelligence and reviewed by the editorial team.
