



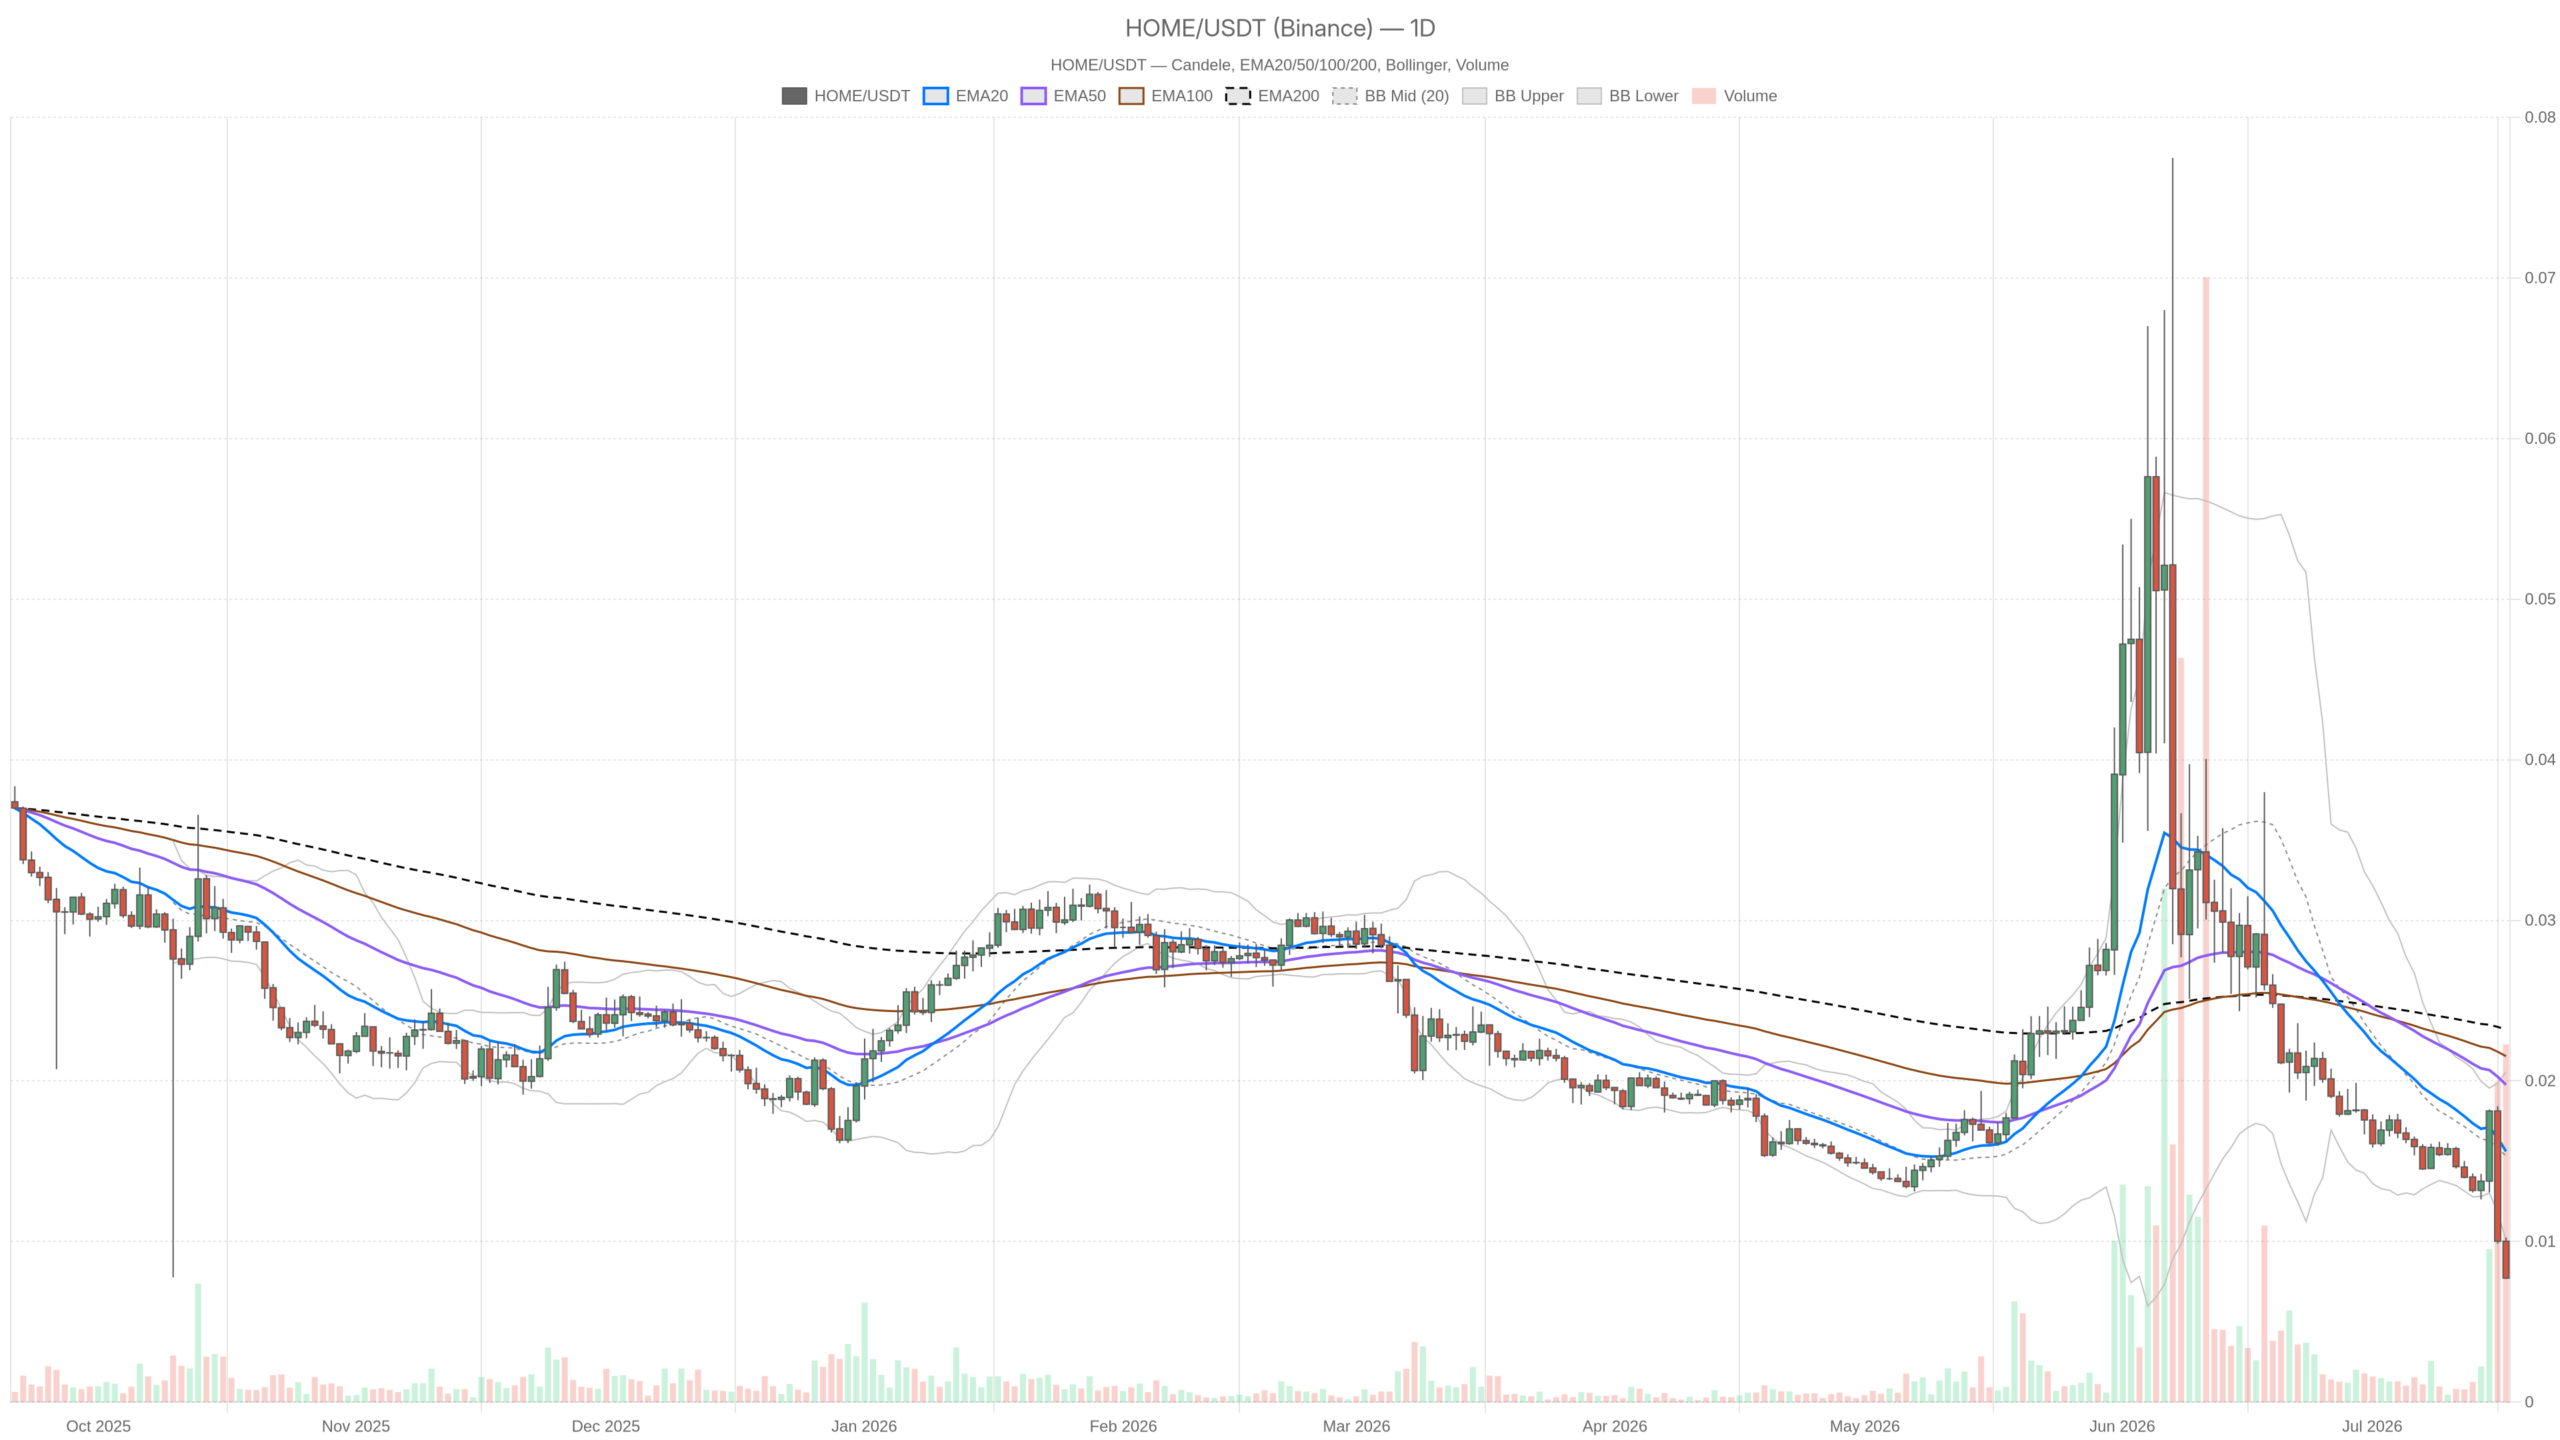
As of July 17, 2026, the HOME crypto market is flashing one of the most unambiguous distress signals in recent months, trading at $0.01 against USDT with every timeframe aligned bearish and momentum oscillators pinned in extreme oversold territory.
Summary
Key takeaways
- HOME is trading at $0.01, a 50% discount to all major EMAs clustered at $0.02 on the daily chart.
- Daily RSI sits at 31.24, while the hourly and 15-minute RSI readings have collapsed to 18.05 and 18.43 respectively.
- The Fear & Greed Index stands at 27, with Bitcoin dominance above 56% and total crypto market cap at approximately $2.247 trillion.
- No volume surge, bullish divergence, or structural base formation is present on any timeframe.
- DEX liquidity conditions are thinning, with Curve DEX fees down over 63% in the past week alone.
Daily timeframe: the macro bias is unambiguously bearish
The daily chart answers the question of trend direction without any ambiguity. HOME closed at $0.01 while the EMA20, EMA50, and EMA200 are all positioned at $0.02. That means price trades at a 50% discount to every major moving average simultaneously. The alignment is not a warning; it is a verdict the market has already rendered on HOME’s near-term trajectory. Moreover, every recovery attempt has been systematically sold into, reinforcing the bearish regime classification.
Moreover, the Bollinger Bands on the daily frame confirm the same conclusion: the mid-band sits at $0.02 while price has collapsed to the lower band at $0.01. When price rides the lower Bollinger Band for extended periods without reclaiming the mid, it signals sustained selling pressure rather than a mean-reversion setup. There is no squeeze, no consolidation — only ongoing distribution. The RSI on the daily comes in at 31.24, just above the classical oversold threshold. However, an RSI hovering near oversold without bouncing often signals a market in genuine downtrend, not one preparing to reverse.
Hourly and 15-minute: no relief, just confirmation
The lower timeframes do not simply confirm the daily picture — they amplify it. The RSI on the hourly chart has plunged to 18.05, a reading that qualifies as deeply oversold by any standard. All EMAs on this timeframe — 20, 50, and 200 — are converged at $0.01, indicating the asset has run out of downward price discovery room but is not attracting buyers either. There is no divergence, no base formation, and no volume surge to suggest accumulation is underway.
Similarly, the 15-minute frame echoes the same message with an RSI of 18.43. Across all three timeframes, the oscillators are screaming oversold in unison, yet price is not responding with any meaningful bounce. That divergence between indicator readings and price behavior is itself a signal — and it is not a bullish one. It suggests selling pressure is so dominant it overpowers what would normally be technical bounce conditions. For execution purposes, there is no credible entry signal on the 15-minute chart. Attempting to fade this move without a clear structural reversal means fighting a very determined crowd.
DEX landscape and market microstructure
Taking a broader view of the DeFi trading environment, data from DefiLlama shows Uniswap V3 leading DEX fee generation with a 7-day increase of 76.06%, though it posted a 1-day decline of 25.32%. Uniswap V4 showed a 30-day gain of 25.06% but a slight 7-day pullback of 4.74%. Curve DEX, however, is struggling notably, with fees down 63.59% over 7 days and 72.62% over 30 days — a sign that certain liquidity pools are seeing dramatically reduced activity.
For a low-cap asset like HOME, thin DEX liquidity translates directly into amplified price swings and wider effective spreads. Moreover, in an environment where even major DEX protocols face daily fee compression, trading conditions for smaller tokens become increasingly hostile.
The bullish case — and what it would need
However, a bullish scenario for HOME crypto requires a fairly specific set of conditions. The extreme RSI readings across all three timeframes — daily at 31.24, hourly at 18.05, 15-minute at 18.43 — do create the raw material for a sharp short-covering rally. If the broader market finds footing and the Fear & Greed Index begins recovering from 27, a rotation back into higher-beta assets is plausible. In that scenario, HOME could attempt to reclaim the $0.02 level where all its EMAs are clustered. That would represent a 100% move from current levels — dramatic, but precisely the math when a coin has lost half its value against its own moving averages.
Nevertheless, the invalidation for this bullish thesis is straightforward: continued price stagnation at $0.01 without any RSI recovery on the daily frame would confirm that the oversold readings are merely a feature of a trending downmarket, not a reversal signal. A decisive close below the lower Bollinger Band support would reinforce that conclusion decisively.
The bearish case — already in progress
The bearish scenario, however, is not hypothetical — it is the current reality. Price remains below every meaningful moving average, the daily regime is classified as bearish, and the Fear & Greed Index sits deep in fear territory with the broader market cap contracting. The MACD across all timeframes shows a flat histogram, which in this context reflects not neutrality but exhaustion of any bullish impulse. When MACD goes flat at the bottom of a downtrend, it can mean price is pausing before the next leg lower, not recovering.
What would invalidate the bearish case? A strong daily candle reclaiming $0.02 with volume confirmation would be the minimum bar. Without that, every intraday bounce should be treated as a potential distribution event rather than a trend change. The pivot levels on the daily — with PP, R1, and S1 all converging at $0.01 — offer virtually no useful reference points at current prices. That itself reflects how far price has moved from any previously meaningful structure.
Positioning and risk considerations
In summary, HOME is in a technically compromised position across every timeframe that matters. The convergence of bearish regime classifications, price trading at a steep discount to all EMAs, and RSI readings in extreme oversold territory without any corresponding price bounce creates an environment where the risk of further downside is very real. The broader context — a contracting total market cap, Bitcoin dominance above 56%, and a Fear & Greed Index at 27 — does nothing to improve the odds for speculative recovery plays in the near term.
Traders considering any engagement with HOME at these levels need to be clear-eyed about one thing: extreme oversold does not mean immediate reversal. In trending markets — and this is very much a trending market to the downside — momentum indicators can stay suppressed for far longer than seems rational. The only thing that changes the calculus here is a genuine shift in buying behavior, confirmed by price structure, not just by an oscillator hitting a number. Until that evidence arrives, patience remains the most defensible position of all.
FAQ
Why is HOME’s price stuck at $0.01?
HOME is pinned at $0.01 because selling pressure has overwhelmed all technical support levels. Every major EMA on the daily chart sits at $0.02, meaning the asset trades at a 50% discount to its moving averages. The Fear & Greed Index at 27 and Bitcoin dominance above 56% further indicate that capital is rotating away from speculative assets like HOME and into large caps.
Can HOME recover from these oversold levels?
A recovery is possible but requires specific conditions: a strong daily close above $0.02 with volume confirmation, RSI recovery on the daily timeframe, and a broader market shift away from fear. Without these, the oversold readings are more likely a feature of a sustained downtrend than a reversal signal. Traders should wait for structural confirmation rather than relying solely on oscillator extremes.
Is now a good time to buy HOME?
Based on the current technical setup, there is no credible entry signal across any timeframe. The daily, hourly, and 15-minute charts all show bearish regimes with no bullish divergence, no base formation, and no volume surge. Extreme oversold conditions can persist far longer than expected in trending markets, and attempting to fade the move without confirmation carries significant risk.
Disclaimer: This article is for informational purposes only and does not constitute financial advice, an investment recommendation, or a solicitation to buy or sell any financial instrument or cryptocurrency. The analysis provided is not indicative of future results. Investing in crypto assets and financial markets carries a high risk of capital loss. Always do your own research (DYOR) and consult a qualified financial advisor before making any decision.
Article produced with the assistance of artificial intelligence and reviewed by the editorial team.
