




Merck stock surged on July 16 after the FDA approved Lipfendra, its oral PCSK9 inhibitor for hypercholesterolemia. MRK shares jumped from $124.33 to close at $127.63. The daily chart structure had already been improving. The catalyst simply sharpened the edge.
Summary
Key takeaways
- Merck stock jumped from $124.33 to $127.63 on July 16 after the FDA approved Lipfendra, an oral PCSK9 inhibitor targeting hypercholesterolemia.
- Daily EMA stacking — EMA20 at $123.78, EMA50 at $120.78, EMA200 at $110.05 — confirms a firmly bullish trend for MRK.
- Analyst price targets range from $138 to $155, well above the fair value estimate of $132.78, with Guggenheim reiterating a Buy rating.
- Hourly RSI at 70.11 signals overbought conditions, suggesting a short-term pullback or consolidation is likely.
- The bullish case remains intact above daily S1 support at $124.78; a close below EMA20 at $123.78 would raise caution.
Merck Stock Daily Trend: Bullish Structure Holds Firm
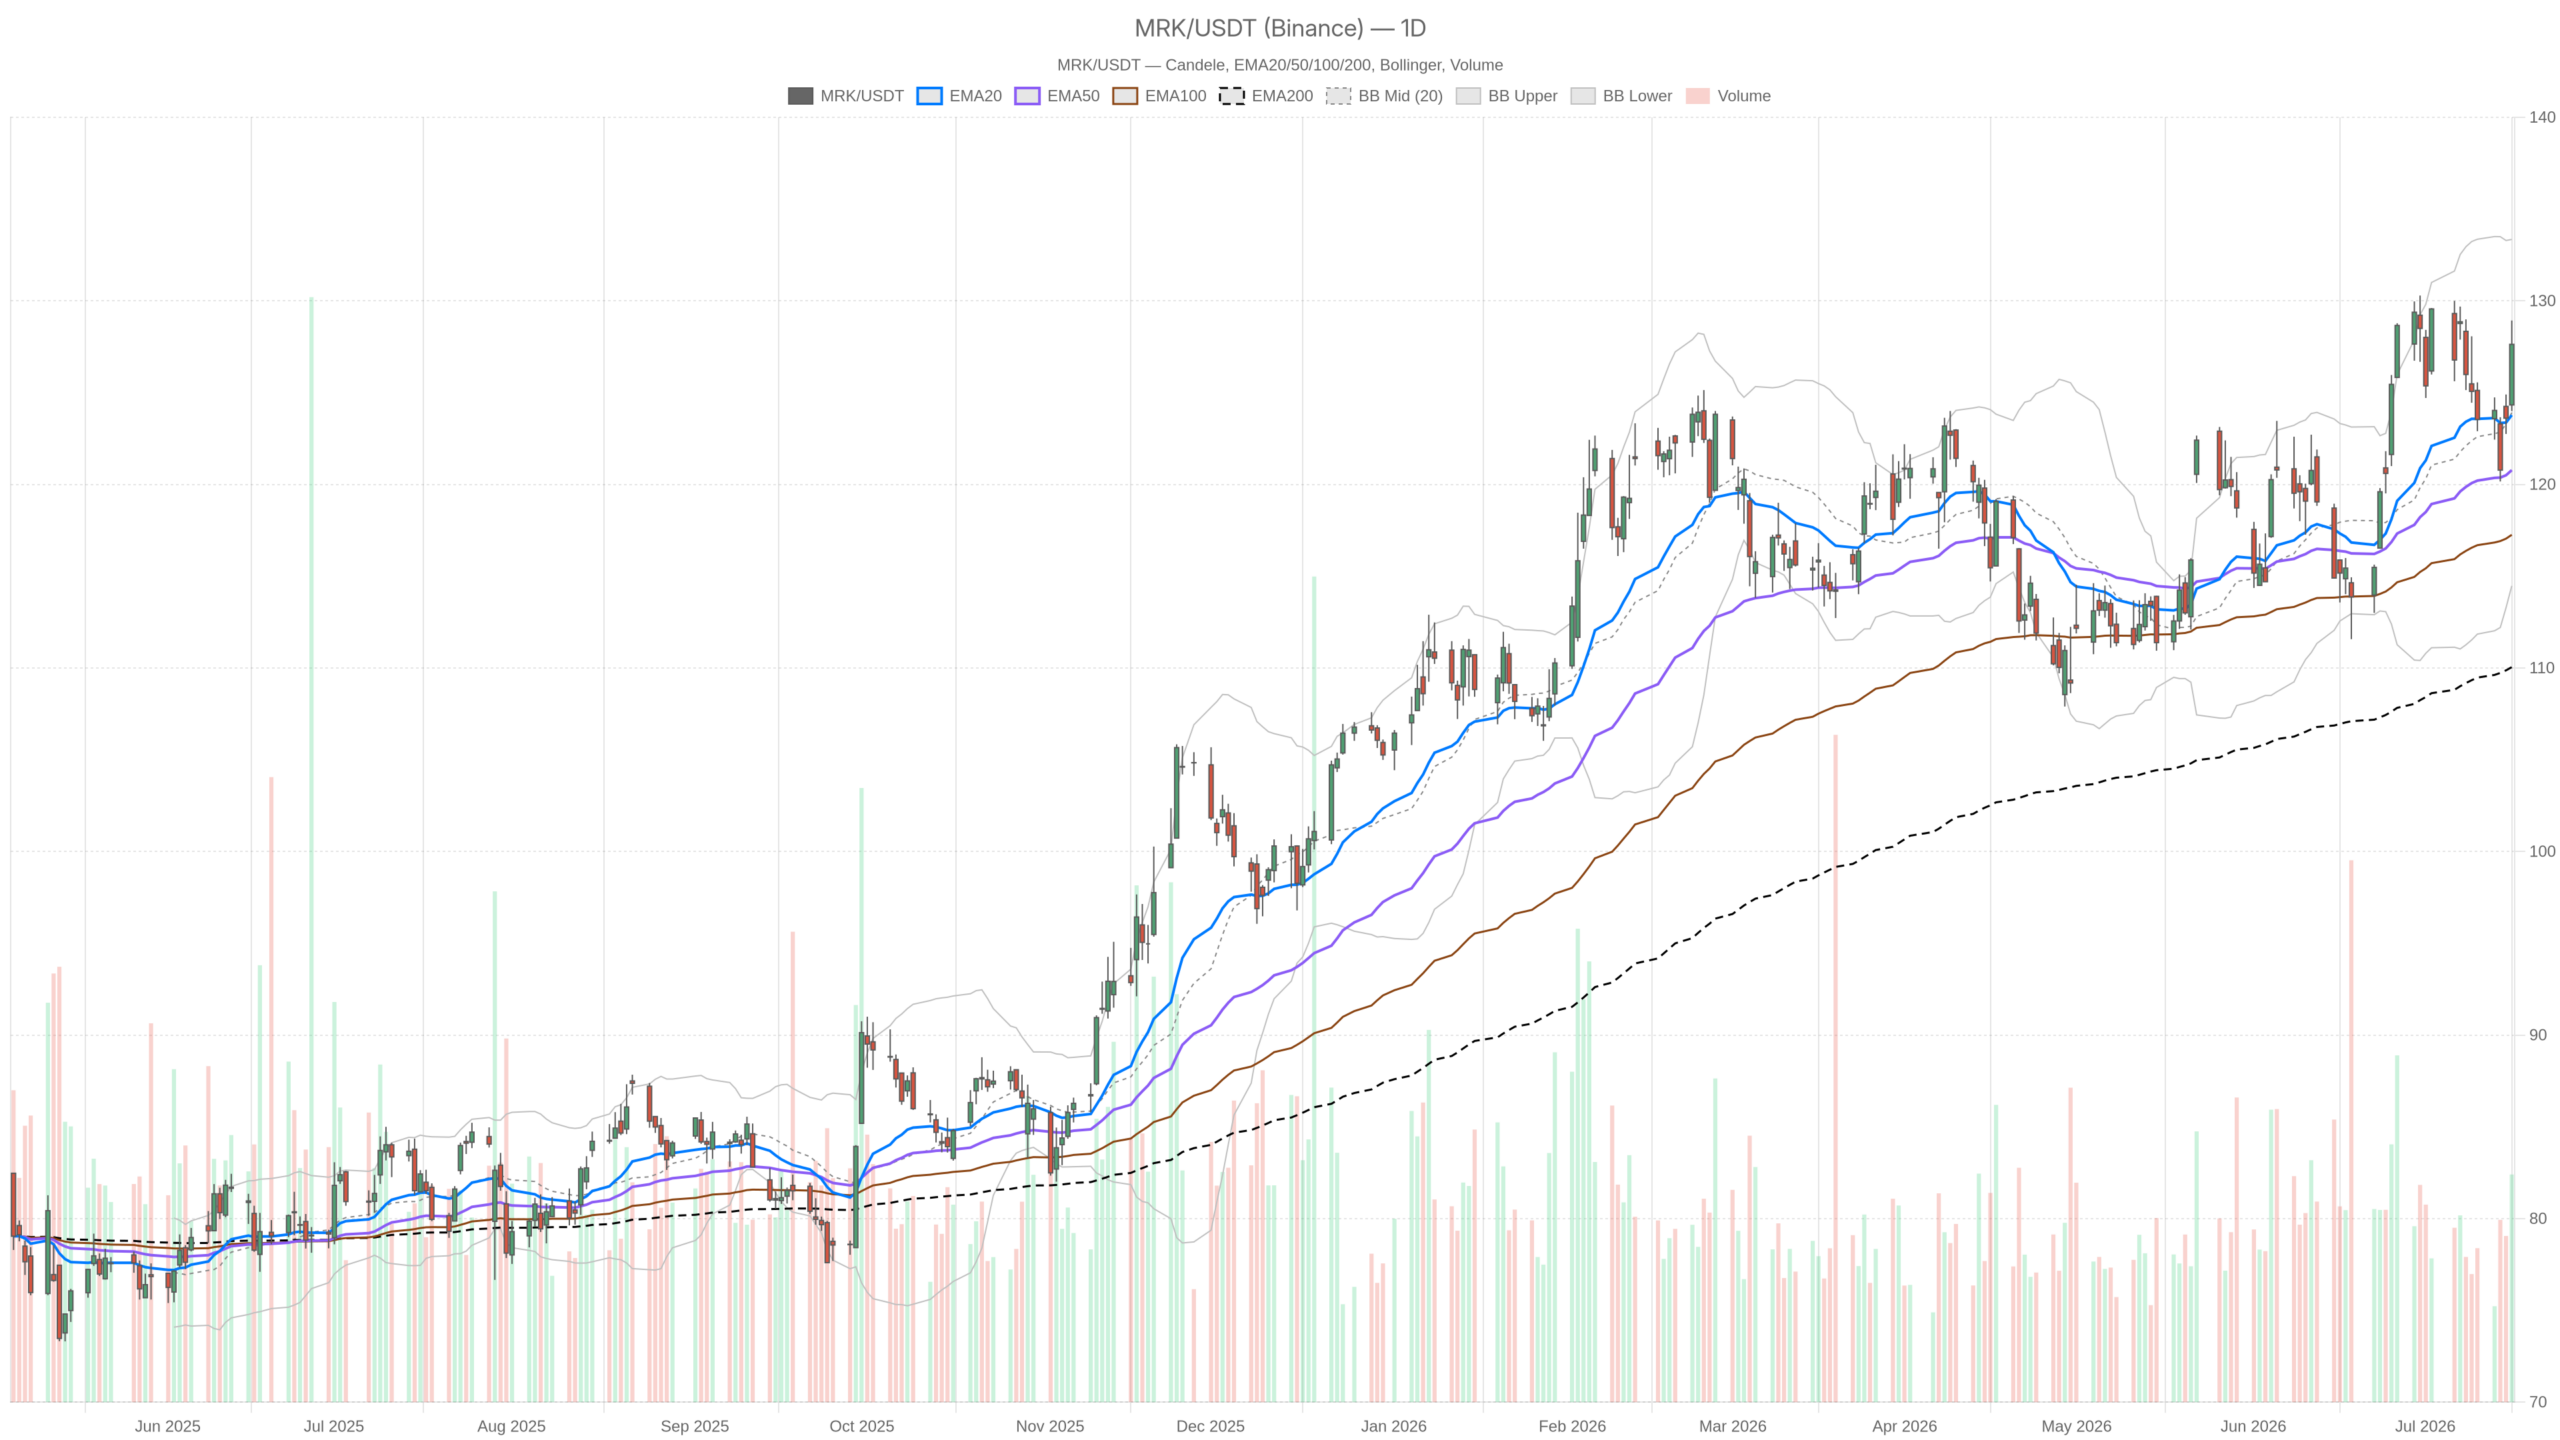
Merck stock’s daily chart structure is unambiguously bullish. Price closed at $127.63, well above all three key exponential moving averages. The stacking alignment reflects a trend that has been building steadily, not one born of a single-day spike.
EMA Stacking Confirms the Trend
Notably, the EMA20 sits at $123.78, the EMA50 at $120.78, and the EMA200 at $110.05. Price closed comfortably above all three. The distance between current price and EMA200 is particularly telling. More than $17 of separation indicates the longer-term mean is far from threatening.
Momentum Signals: Constructive with a Caution
Meanwhile, daily RSI sits at 58.13, placing MRK in constructive territory. There is firm momentum without the overbought excess that typically precedes sharp reversals. Room remains before that ceiling becomes a concern. The MACD, however, tells a more nuanced story. Its line at 1.65 remains above zero. But the signal line at 2.03 has crossed above it, producing a histogram of -0.38. This signals a short-term deceleration in momentum rather than a trend reversal — a normal pause within an uptrend.
Bollinger Bands and Pivot Framework
Bollinger Bands further support this reading. With the midband at $123.91 and price at $127.63, MRK trades in the upper half of the channel. The upper band at $133.35 leaves meaningful room before statistical overextension. Meanwhile, the lower band at $114.47 underscores how far the floor has moved. Daily ATR of $3.66 reflects elevated but manageable volatility following a significant regulatory catalyst.
Daily pivot levels, meanwhile, provide a clean framework. The pivot point sits at $126.85, and price closed above it. R1 resistance at $129.71 is the next logical reference for bulls. S1 support at $124.78 matters on any intraday retest. A close below it would shift short-term tone.
Hourly Structure: Momentum Running Hot on Merck Stock
On the 1H chart, Merck stock’s bullish posture is reinforced — but with one key caution. The hourly RSI has reached 70.11, placing it squarely at the overbought threshold. Price sits well above all hourly EMAs: EMA20 at $125.39, EMA50 at $124.84, and EMA200 at $122.56. The trend on this timeframe is clean and steep.
Hourly MACD is also constructive. The MACD line at 1.18 sits above the signal at 0.61, generating a positive histogram of 0.57. This is a genuine continuation signal rather than a corrective bounce. However, the RSI reading at 70.11 warrants attention. It does not invalidate the daily thesis. Yet it does suggest the stock may need to consolidate or pull back before the next leg higher.
Hourly pivot structure shows R1 resistance at $127.98, extremely close to the close of $127.67. This proximity, combined with an overbought oscillator, creates a short-term friction zone. In contrast, S1 support at $127.15 is tight, reflecting the compressed intraday range.
The Bollinger Band upper on the 1H sits at $129.91, leaving room within the channel. Still, the position near the upper band confirms the stock is stretched short-term. Hourly ATR at $1.17 remains contained, suggesting volatility has not become disorderly.
15-Minute View: Execution Context Only
The 15-minute frame is useful strictly for timing. The regime is bullish. But the 15m MACD histogram has turned negative at -0.25, while RSI has pulled back to 57.48. Price trades just below the 15m EMA20 of $127.55 and above the EMA50 at $126.11. The Bollinger midband on this timeframe sits at $127.97, slightly above current price. This hints at a micro consolidation rather than a breakdown. Overall, the 15m picture reflects a brief digestion of the day’s strong gains. ATR at $0.43 reflects minimal intraday volatility at this granularity.
The Bullish Scenario for Merck Stock
The bullish case for Merck stock is well-supported by both technicals and fundamentals. A sustained hold above the daily pivot at $126.85 keeps the constructive structure intact. Holding above S1 at $124.78 is equally important. Analyst price targets extending to $155 offer substantial runway from current levels.
Notably, the Lipfendra FDA approval opens a new commercial chapter. It delivers a once-daily oral pill that rivals injectable therapies in a large, underpenetrated cardiovascular market. Bloomberg framed it as Merck targeting “high-risk patients” in treating “the leading cause of death in the world.” This is not hyperbole. It signals an addressable market of significant scale.
Furthermore, the broader market context on July 16 was notable. Healthcare names, including MRK, outperformed as chip stocks dragged the Nasdaq lower. That defensive rotation adds a layer of relative strength to the MRK thesis. Analysts appear to have revised Q2 earnings assumptions upward. If these confirm the pipeline narrative, Merck stock has a credible path toward the $132.78 fair value estimate and beyond.
The Bearish Scenario and Key Risks
The bearish case is a real possibility, even if it is not the base scenario. The daily MACD histogram turning negative — however modestly — flags that buying pressure is losing intensity at the daily level. An hourly RSI above 70 is rarely sustained without consequence. Therefore, a short-term pullback into the $124–$125 zone is entirely plausible without breaking the broader trend.
On the other hand, a more serious invalidation would require a daily close below EMA20 at $123.78. That would suggest the FDA-driven move has fully unwound. A break below $120.78 — the EMA50 — would challenge the entire medium-term bullish thesis. Broader market deterioration could also pull MRK lower. This is especially true if defensive rotation reverses as risk appetite returns to technology. Any negative development on the Q2 earnings front would be equally damaging. The stock is now priced with some optimism baked in.
Positioning and Volatility Outlook
Merck stock arrives at an interesting inflection point. The daily structure is clean and bullish. The catalyst is real, and analyst conviction is building. Yet the hourly timeframe is stretched. Near-term resistance sits just overhead at $127.98–$129.71. The daily MACD is also flagging modest momentum fatigue. This combination argues for patience rather than urgency on new entries.
Therefore, a consolidation toward $124.78–$126.85 would offer a more measured risk framework. Ideally, it would come with contracting ATR. This would set up a cleaner extension toward the analyst consensus targets. The Merck stock trend remains constructive. But chasing it at the top of an intraday surge rarely ends cleanly.
FAQ
What drove Merck stock higher on July 16?
The FDA approved Lipfendra, Merck’s oral PCSK9 inhibitor for adults with hypercholesterolemia. MRK shares surged from an open of $124.33 to close at $127.63. Guggenheim also reiterated its Buy rating on the stock.
Is Merck stock overbought after the FDA catalyst?
On the hourly timeframe, RSI has reached 70.11, which sits at the overbought threshold. This suggests a short-term consolidation or pullback is likely. However, daily RSI at 58.13 remains constructive, indicating the broader trend still has room to run.
What are the key support levels for Merck stock?
Critical support sits at S1 near $124.78. Below that, the daily EMA20 at $123.78 marks the line where the FDA-driven move would be considered fully unwound. A break below the EMA50 at $120.78 would challenge the medium-term bullish thesis.
Can the Merck stock rally continue toward analyst targets?
Analyst price targets extend to $155, with a fair value estimate of $132.78. The bullish structure remains intact above $124.78. However, near-term resistance at $127.98–$129.71 and an overbought hourly RSI suggest a period of consolidation may be needed before the next leg higher.
Disclaimer: This article is for informational purposes only and does not constitute financial advice, an investment recommendation, or a solicitation to buy or sell any financial instrument or cryptocurrency. The analysis provided is not indicative of future results. Investing in crypto assets and financial markets carries a high risk of capital loss. Always do your own research (DYOR) and consult a qualified financial advisor before making any decision.
Article produced with the assistance of artificial intelligence and reviewed by the editorial team.
