



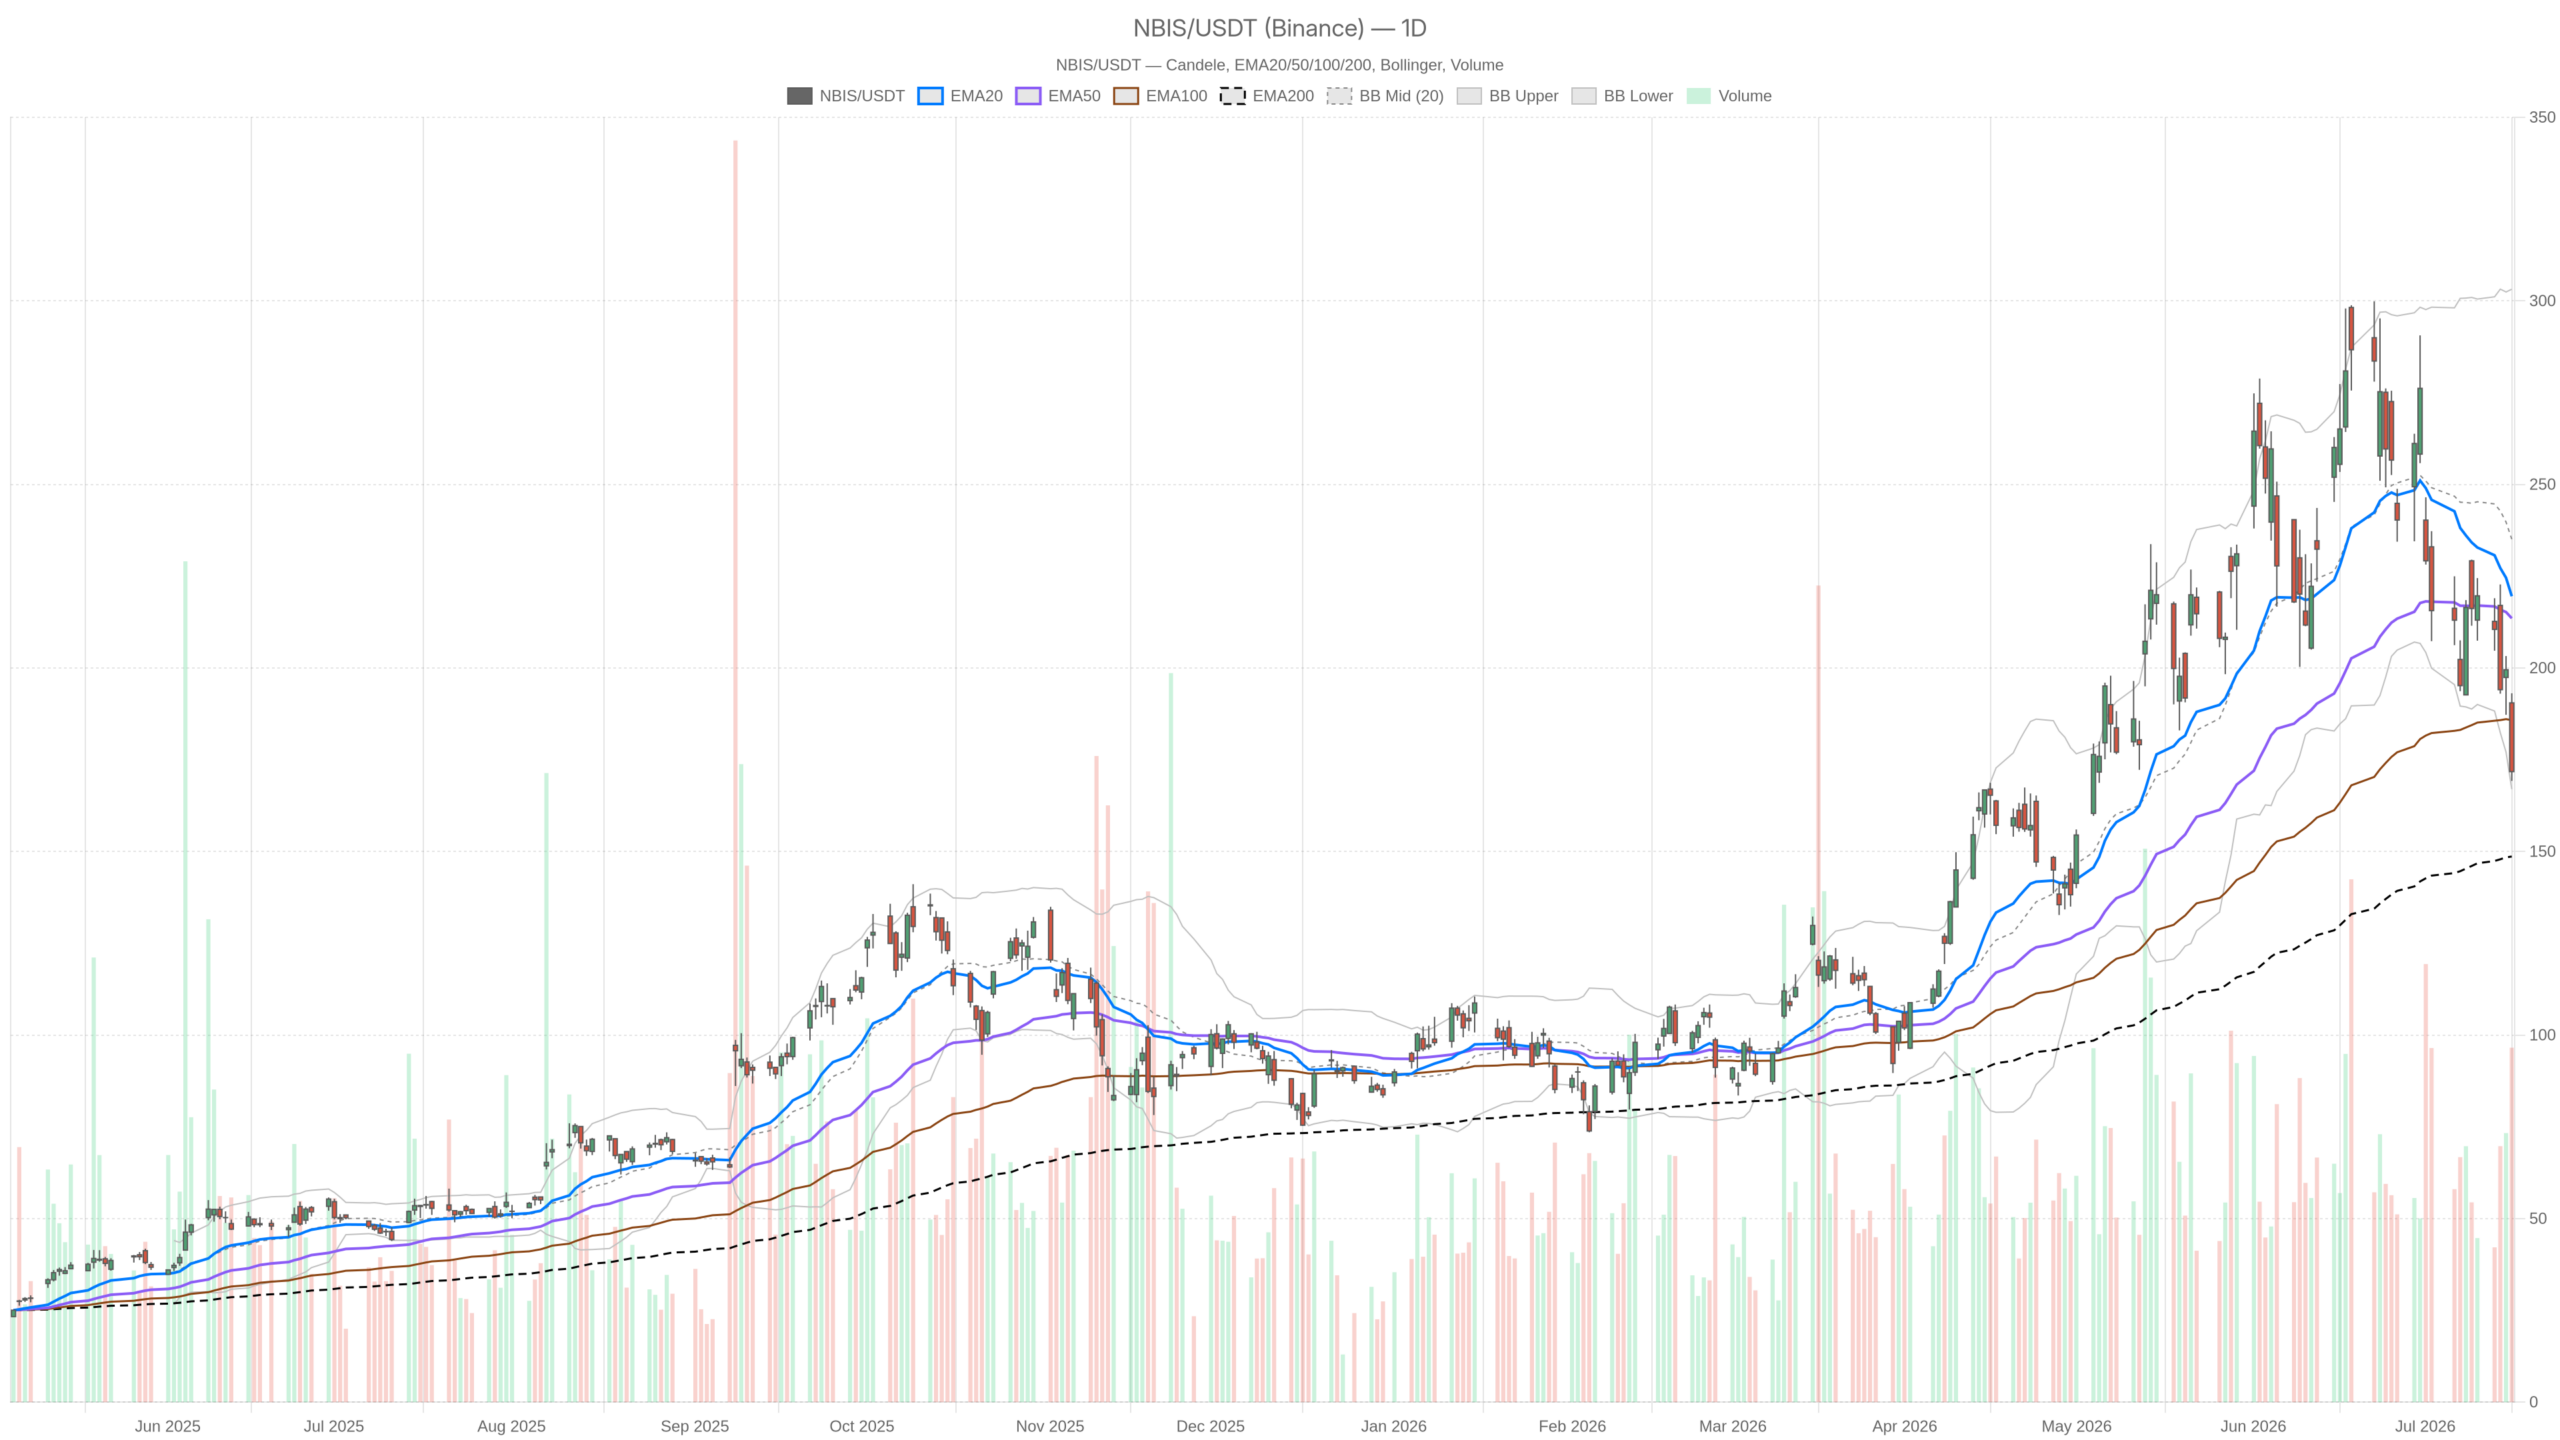
Nebius Group N.V. stock dropped sharply on July 16, falling from an intraday high of $193.10 to close at $171.77 — a nearly $24 range. With momentum deteriorating across multiple timeframes, the burden of proof rests squarely with the bulls.
Summary
Key takeaways
- NBIS closed at $171.77 on July 16, down from an intraday high of $193.10, carving a daily range of nearly $24.
- The stock trades well below its 20-day EMA at $219.54 and 50-day EMA at $213.53, though the 200-day EMA at $148.63 remains a structural floor.
- The daily RSI at 35.48 approaches oversold but has not reached it, while the MACD shows deeply negative divergence with a histogram of -7.79.
- The 1-hour regime is explicitly bearish, with the RSI at 27.17 in oversold territory beneath a descending stack of moving averages.
- Nebius launched an asset-light AI cloud partnership model and Nebius Echo on July 16, yet the stock sold off despite constructive news flow.
Daily Bias — Bearish Pressure Tests Long-Term Support
The daily chart signals heavy distribution in Nebius Group N.V. stock. Price sits well beneath both the 20-day and 50-day EMAs, though the 200-day EMA at $148.63 still holds.
Closing at $171.77, the stock has fallen far below the 20-day EMA at $219.54 and the 50-day EMA at $213.53. This wide gap confirms the dominant short-to-medium term trend has broken down. However, the 200-day EMA at $148.63 sits well below current levels — preserving the broader uptrend for now. In the near term, the stock is deeply extended below its key averages. That alone warrants defensive positioning.
The daily RSI at 35.48 is nearing oversold territory but has not crossed that threshold. Selling pressure could therefore persist before any technical exhaustion emerges. Meanwhile, the MACD paints a more troubling picture. The MACD line sits at -10.95 against a signal line of -3.17, producing a histogram of -7.79. That reading is deeply negative and reflects accelerating downside momentum. No cross or convergence is visible yet.
Additional context comes from the daily Bollinger Bands. The lower band sits at $166.98 and the midline at $235.08. Price trades near the lower band, signaling elevated volatility and extended selling. The daily ATR of 25.30 confirms how wide the swings have become. Notably, the pivot point rests at $178.03, with R1 at $186.84 and S1 at $162.97. The close at $171.77 places the stock between the pivot and S1 — a structurally weak zone.
Hourly View — Bearish Regime Takes Full Control
The 1-hour chart flips the regime from neutral to outright bearish in Nebius Group N.V. stock. Every key moving average now sits overhead as resistance, with no near-term catalyst visible to reverse that alignment.
On the 1-hour chart, price at $171.72 trades below the EMA20 at $188.63, the EMA50 at $201.73, and the EMA200 at $225.95. All three averages form resistance layers above current price. The structure is classically bearish — a descending stack of exponential averages with no reversal trigger in sight.
The 1H RSI at 27.17 has crossed into oversold territory. While an RSI below 30 can precede short-term bounces, it is not a standalone buy signal. Oversold conditions can persist in strongly trending moves. The 1H MACD remains negative at -9.08 with a signal line of -7.29. The histogram of -1.78 shows marginal narrowing, hinting at a possible deceleration in selling pace. Still, this falls short of an actual reversal signal.
For further reference, the lower Bollinger Band on the 1H chart sits at $169.52, with price trading just above it. This may provide a short-term floor. The 1H pivot is $172.10, with R1 at $174.96 and S1 at $168.85. The close near the pivot suggests the stock hovers at a decision level. Any hourly close below $168.85 would confirm a fresh leg lower.
15-Minute Lens — Stabilization Without Reversal
The 15-minute chart shows marginal stabilization in Nebius Group N.V. stock, but nothing resembling a tradable reversal. The broader intraday trend remains firmly bearish.
Price closed the last candle at $171.72, within a tight range between $169.23 and $172.90. The 15m MACD histogram turned slightly positive at 0.56 — the only genuinely constructive signal in the current data set. This hints at marginal short-term stabilization. However, the broader 15m trend remains bearish, with price below the EMA20 at $176.55, EMA50 at $184.43, and EMA200 at $204.32.
Meanwhile, the 15m RSI at 32.68 sits near oversold but not at it, mirroring the daily reading. Tick-by-tick volatility remains elevated, with the ATR on this timeframe at 2.82 relative to the tight intraday range. The 15m Bollinger lower band at $169.63 aligns closely with the $169.23 intraday low. This confluence makes $169.00–$169.50 a critical short-term support zone. Overall, the 15m data works best as a tactical lens rather than a trend guide.
Nebius Group N.V. Stock Catalyst — Asset-Light Pivot Meets Market Skepticism
Company-driven news on July 16 should have supported Nebius Group N.V. stock. Instead, the market sold off sharply — a divergence that is itself highly informative.
The company launched an asset-light partnership model for its AI cloud platform. This allows infrastructure partners to deploy Nebius technology in their own data centers, with initial agreements already in place. The structure reduces capital spending while expanding potential AI capacity for customers. It marks a meaningful strategic pivot that could accelerate growth over time.
Additionally, Nebius unveiled Nebius Echo, a built-in AI agent, alongside new cloud platform features. These include orchestration tools, cost controls, security improvements, storage updates, and developer programs. The announcements signal genuine product momentum. Yet market participants appeared unconvinced on the day. The stock sold off even as the news flow was constructive.
Notably, one July 16 assessment described the stock as fairly valued at current levels. After a very large one-year return, the share price appears roughly in line with earnings-based multiples. It also carries a low overall value score. This valuation framing may be contributing to the absence of fresh buyers at elevated prices.
Bullish Scenario — What Recovery Would Require
The bull case for Nebius Group N.V. stock is not dead, but it demands clear evidence of stabilization. Buyers must reclaim specific levels to shift the narrative.
For bulls to regain control, NBIS would need to reclaim the daily pivot at $178.03 on a closing basis. A sustained recovery toward the 1H R1 at $174.96, followed by a close above $178, would be an early sign the selloff is exhausting. The real test would then be whether the stock can reclaim the 20-day EMA at $219.54 over multiple sessions. The asset-light model and product pipeline provide a credible fundamental thesis for such a recovery. This would be especially true if partner deployments accelerate and Nebius Echo gains traction with enterprise users.
At the same time, the 200-day EMA at $148.63 remains a significant structural floor. A pullback to that level, while painful, would not necessarily break the longer-term trend. Mean-reversion toward the daily Bollinger midline at $235.08 represents a wide potential recovery range from current levels.
Bearish Scenario — Where Momentum Takes Over
The bears hold momentum in Nebius Group N.V. stock right now. A break below the $169.00–$169.50 support zone would likely accelerate selling toward deeper levels.
A break below the $169.00–$169.50 zone — where the 1H and 15m lower Bollinger Bands converge with the intraday low — would likely drive selling toward daily S1 at $162.97. Below that, the 200-day EMA at $148.63 becomes the next meaningful level. The daily MACD remains deeply negative with no sign of stabilization. The 1H regime is explicitly bearish. Unless momentum indicators begin reversing, the path of least resistance points lower.
Furthermore, the valuation concern is a headwind. If the stock is no longer seen as a clear bargain after its one-year run, marginal buyers will be slow to emerge. This holds true even with genuinely positive product announcements. The combination of stretched valuation and deteriorating technicals creates a difficult setup for any rapid recovery.
Positioning and Outlook — A Market at Crossroads
Nebius Group N.V. stock navigates a difficult moment, caught between a compelling growth narrative and a technically broken short-term chart. The uncertainty is real and demands disciplined risk management.
The fundamental story — asset-light cloud expansion, new AI products, and growing infrastructure partnerships — remains intact and arguably compelling. Yet the technical picture across all three timeframes is predominantly bearish. Both daily and hourly frames show price well below key moving averages, with momentum tilted to the downside. The slight 15m MACD histogram recovery is worth monitoring. However, it does not override the broader trend.
With a daily ATR of $25.30, volatility is high and positions can swing sharply in either direction. Traders should treat $169.00 as the near-term line in the sand. Meanwhile, $178.03 stands as the first meaningful hurdle for any recovery attempt. This is a market caught between a credible growth narrative and a broken short-term chart — and that tension defines the current risk environment.
FAQ
What caused Nebius Group N.V. stock to drop on July 16?
The stock fell from an intraday high of $193.10 to close at $171.77 — a nearly $24 range — despite the company announcing an asset-light AI cloud partnership model and the Nebius Echo AI agent. The selloff reflects deteriorating technical momentum and valuation concerns rather than any negative company-specific news.
What are the key support levels for NBIS right now?
The immediate support zone sits at $169.00–$169.50, where the 1H and 15m lower Bollinger Bands converge with the intraday low. Below that, daily S1 at $162.97 and the 200-day EMA at $148.63 serve as the next significant structural levels.
Is Nebius Group N.V. stock oversold?
The 1H RSI at 27.17 has crossed into oversold territory, but the daily RSI at 35.48 has not. Oversold readings can precede bounces, but they are not standalone buy signals — particularly when the broader regime across multiple timeframes is bearish.
What fundamental catalysts could support a recovery in NBIS?
The asset-light AI cloud partnership model reduces capital spending while expanding capacity. Additionally, the Nebius Echo AI agent and new cloud platform features — including orchestration tools, cost controls, and security improvements — provide genuine product momentum that could support a recovery if enterprise adoption accelerates.
Disclaimer: This article is for informational purposes only and does not constitute financial advice, an investment recommendation, or a solicitation to buy or sell any financial instrument or cryptocurrency. The analysis provided is not indicative of future results. Investing in crypto assets and financial markets carries a high risk of capital loss. Always do your own research (DYOR) and consult a qualified financial advisor before making any decision.
Article produced with the assistance of artificial intelligence and reviewed by the editorial team.
