




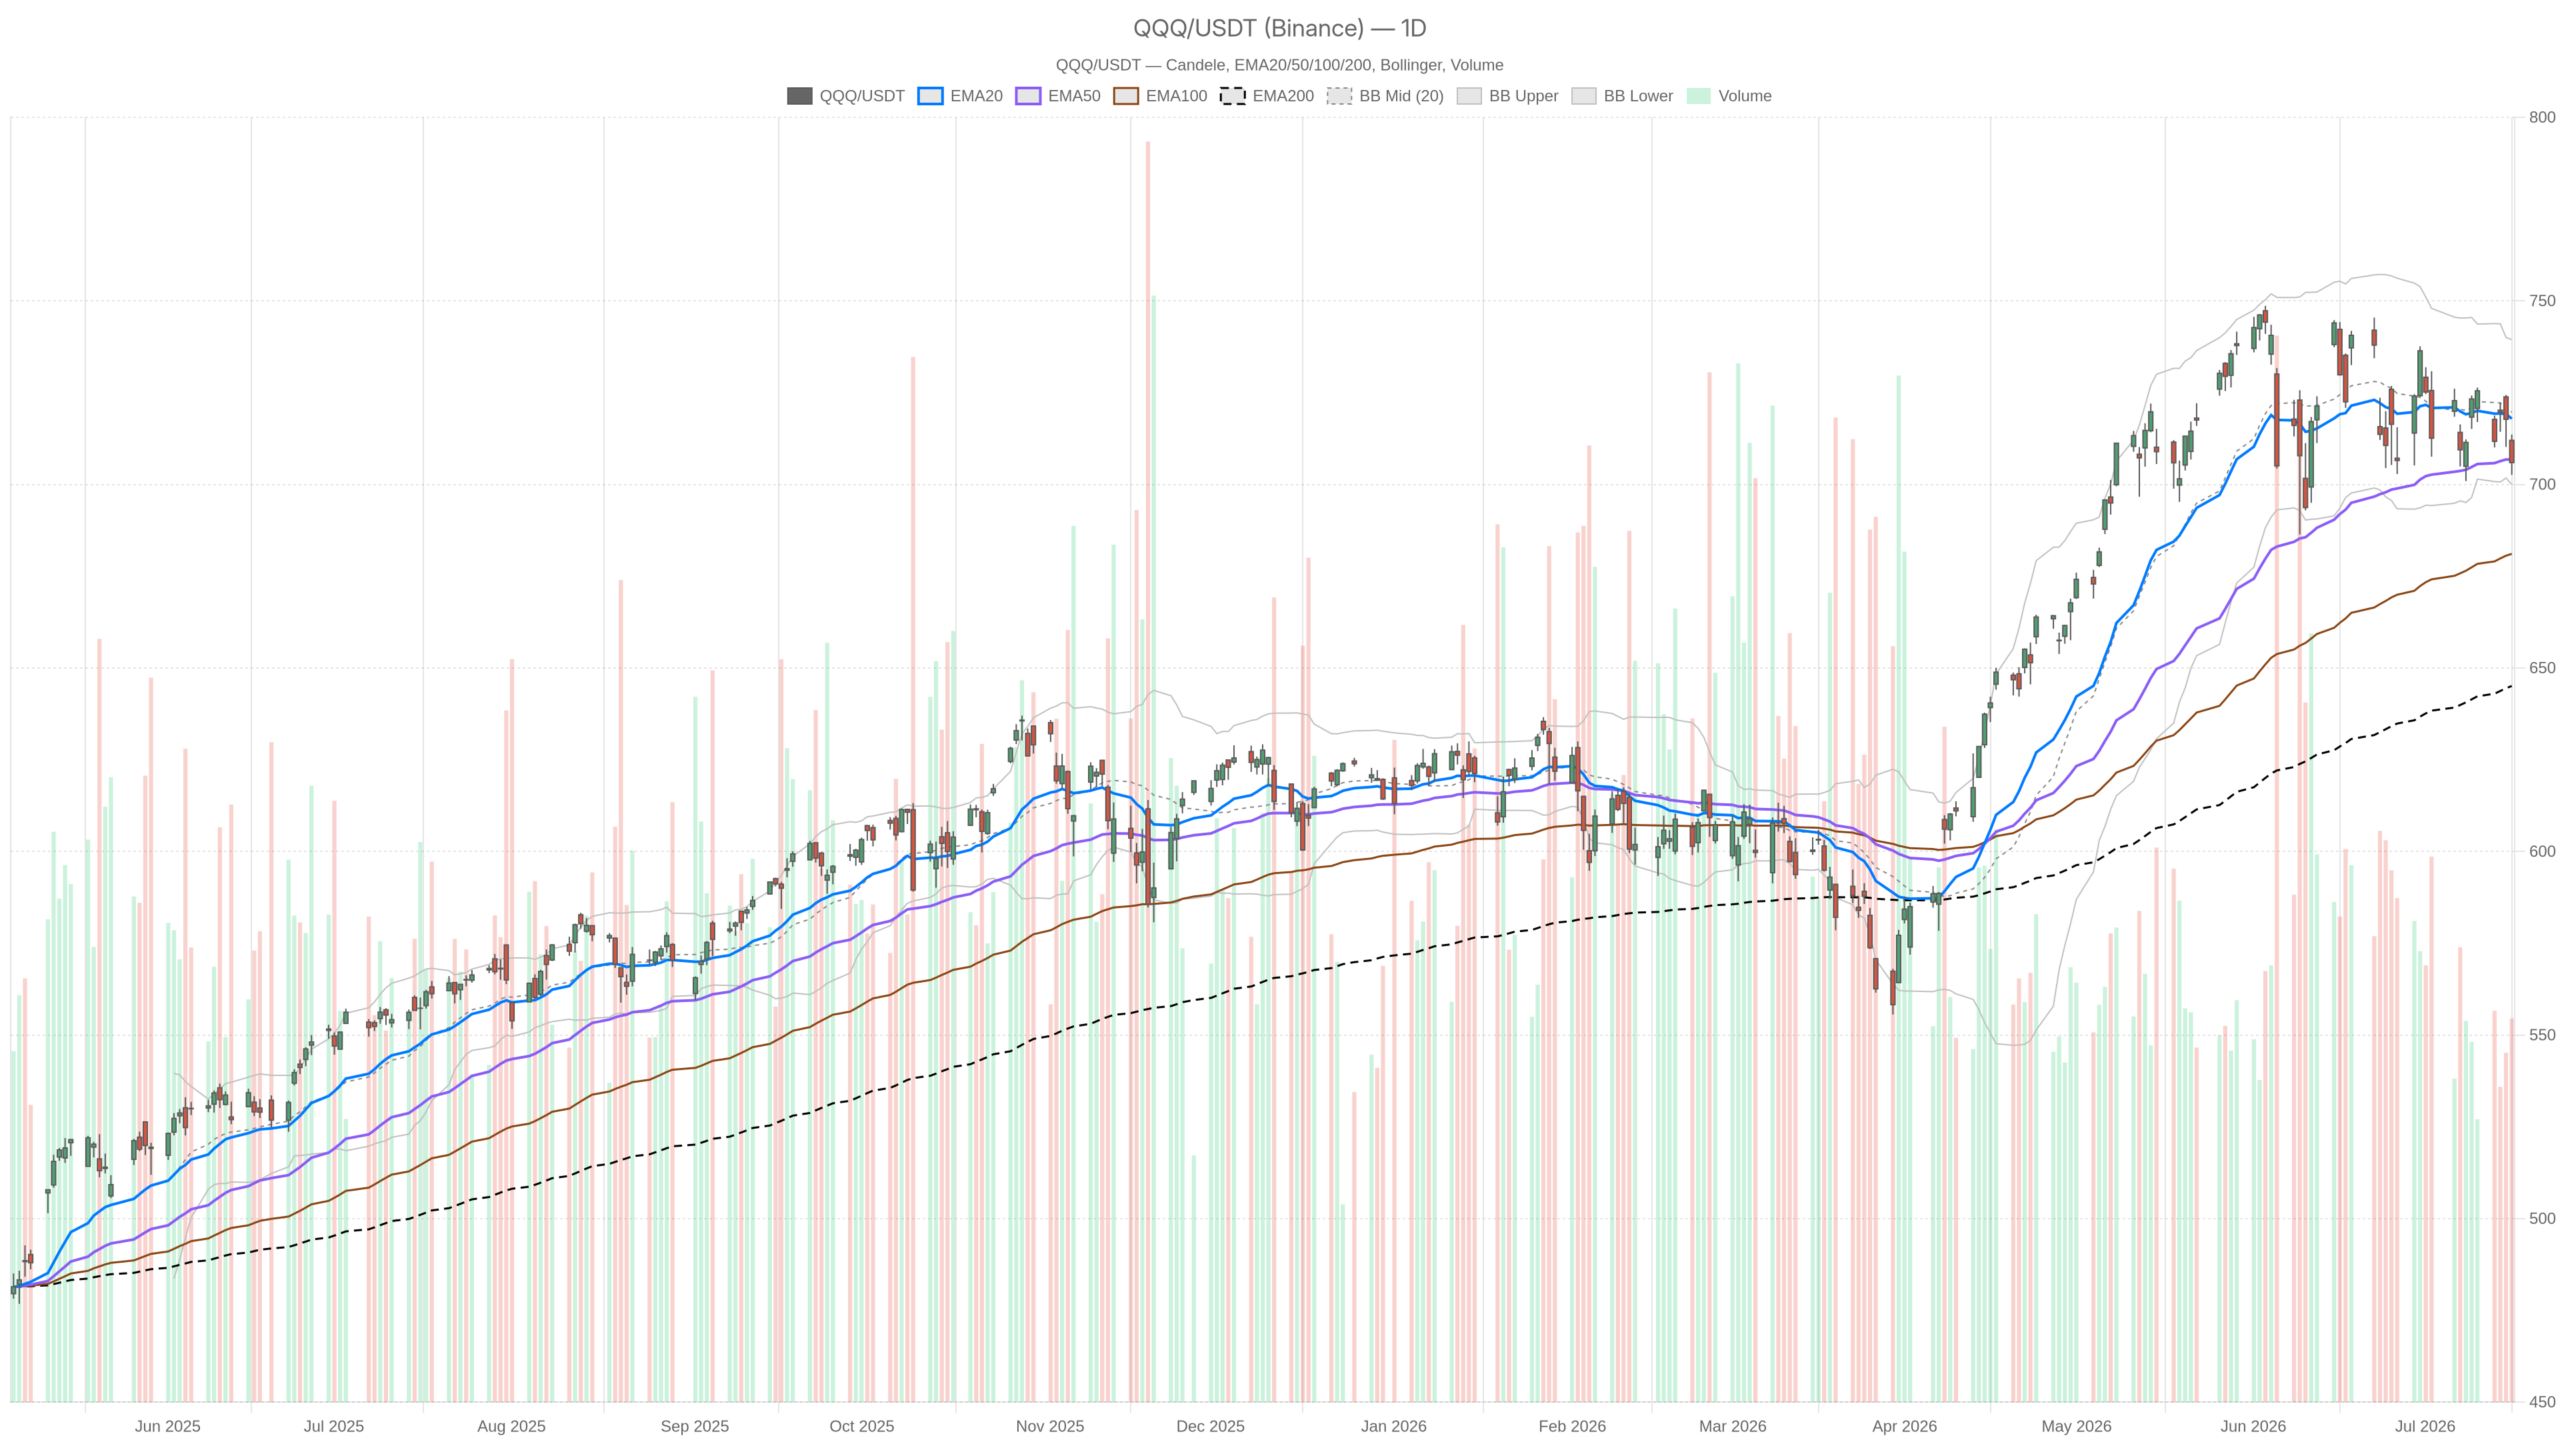
The Invesco QQQ Trust, Series 1 stock closed at $705.94 on July 16, clinging to the EMA50 as momentum deteriorates. The daily chart shows a neutral regime with a softening bias, while intraday timeframes signal outright bearish pressure.
Summary
Key takeaways
- QQQ closed at $705.94 on July 16, just below the daily pivot of $707.38.
- Daily RSI14 at 45.57 signals fading momentum without reaching oversold territory.
- The 1-hour chart is fully bearish, with all three EMAs stacked in bearish order.
- Critical support sits at $701.17 (S1) and the lower Bollinger band at $699.97.
- The long-term uptrend remains intact, anchored by the daily EMA200 at $645.09.
Invesco QQQ Trust, Series 1 Stock Faces a Critical Juncture
The Invesco QQQ Trust, Series 1 stock has broken below its daily EMA20 and now clings to the EMA50 — the last nearby support before a potential acceleration lower.
The trust closed at $705.94 on July 16, sitting just above the daily EMA50 at $706.76. The daily EMA20 at $717.90 has already been lost, confirming that short-term momentum has reversed. Meanwhile, the daily Bollinger midline at $719.70 remains well above current price. The lower band at $699.97 defines the gravitational pull if support gives way.
Daily Structure: Neutral Label, Bearish Undertone for QQQ
The daily chart for the Invesco QQQ Trust, Series 1 stock carries a neutral classification, yet the weight of momentum indicators points clearly toward a bearish tilt.
Momentum Indicators Signal Distribution
Daily RSI14 stands at 45.57, below the neutral midpoint of 50 without reaching oversold territory. This reflects a market that has lost upside energy but has not yet capitulated. There is room for further downside before any meaningful bounce becomes technically justified.
Momentum indicators reinforce that concern. The MACD line at -0.36 sits below the signal line at 1.44, producing a histogram of -1.80. The spread is widening in the negative direction. This is not a market consolidating before a breakout — it is one where momentum is actively shifting in sellers’ favor.
Pivot and Volatility Context
ATR14 on the daily chart is $14.42, underscoring that volatility remains elevated. Intraday swings of that magnitude are not uncommon. In a declining momentum environment, however, elevated ATR tends to favor trend continuation rather than reversal.
Pivot analysis adds useful context. The daily pivot sits at $707.38, with R1 at $712.15 and S1 at $701.17. Closing at $705.94 — just below the pivot — is a soft bearish signal for the next session. S1 at $701.17 becomes the natural downside target on any acceleration lower.
Hourly Timeframe Confirms the Pressure on QQQ
The 1-hour chart for the Invesco QQQ Trust, Series 1 stock leaves no room for ambiguity — the regime is explicitly bearish, with all three EMAs aligned in perfect bearish order.
EMA Stack and Momentum Breakdown
Price at $706.02 trades below the 1H EMA20 at $712.58, the EMA50 at $715.63, and the EMA200 at $719.85. Meanwhile, all three moving averages are stacked in perfect bearish order. This kind of full alignment across short-term moving averages rarely reverses quickly.
Hourly RSI14 at 36.66 is approaching oversold territory without yet reaching it. That positioning is concerning for bulls. Oversold bounces typically require RSI to dip below 30 first. At 36.66, the market may have further room to weaken before any meaningful relief rally materializes.
MACD and Bollinger Band Dynamics
The 1H MACD is also deeply negative. The MACD line at -3.09 sits well below the signal at -1.93, with the histogram at -1.16. Momentum is negative and still deteriorating on this timeframe. In contrast to the daily chart, where MACD divergence remains early-stage, the hourly version is firmly entrenched in bearish territory.
The 1H Bollinger Band places current price just above the lower band at $703.74. Price hugging the lower band is consistent with a trend in motion. A decisive close back above the 1H midline at $714.72, however, would be required to change that picture.
15-Minute Context: Execution Layer Signals Stabilization Attempt
The 15-minute chart for Invesco QQQ Trust, Series 1 stock remains bearish, though the most aggressive selling impulse shows signs of temporary exhaustion.
Zooming in further, the MACD histogram has nearly zeroed out at -0.02. This suggests the most aggressive selling on this timeframe may be temporarily exhausted. Price closed the last 15-minute candle at $706.02 — right at the 15m pivot resistance of $707.45.
That positioning puts traders in a precarious spot. RSI14 at 40.94 on the 15-minute frame is not yet oversold. ATR14 at $1.77 implies tight, compressed movement at the micro level. Overall, the 15-minute picture reflects a brief pause within a broader downward drift — not a reversal setup.
Bullish Scenario: What Would Need to Happen
For the Invesco QQQ Trust, Series 1 stock to reverse higher, it must reclaim the daily EMA50 and push back above the daily R1 at $712.15 on a closing basis.
Technical Requirements for a Reversal
A bullish recovery requires specific catalysts and structural confirmation. First, QQQ would need to reclaim the daily EMA50 at $706.76 and hold it convincingly on a closing basis. Beyond that, a push back above $712.15 — the daily R1 — would signal that buyers are regaining control of the immediate range.
Sentiment and Long-Term Context
On the sentiment front, Stocktwits data noted retail sentiment on QQQ remained bullish heading into the session. That provides a minor supportive data point. Retail sentiment, however, is a lagging and often contrarian indicator when combined with deteriorating technical structure. It offers no structural edge on its own.
Notably, the daily EMA200 at $645.09 remains far below current price. This confirms the longer-term uptrend is structurally intact. Any pullback that stays above that level remains a correction within an uptrend, not a trend reversal. That context supports the idea that dip-buyers may eventually re-engage at lower levels.
Bearish Scenario: The Path Lower
If the Invesco QQQ Trust, Series 1 stock loses the daily S1 at $701.17, a breakdown toward the $700 psychological level and the lower Bollinger band becomes the primary risk scenario.
Support Levels and Breakdown Risk
On the bearish side, if QQQ fails to hold $701.17 (daily S1), the lower Bollinger band at $699.97 becomes the next reference. A close below $700 would be technically significant. It would represent a Bollinger band breakdown on the daily chart and a clear loss of the $700 psychological level.
Macro and Momentum Headwinds
The macro backdrop adds another layer of uncertainty. Nasdaq futures showed weakness around Iran tensions and chip sector softness. Specific names like NVDA and TSM were flagged as headline risks. QQQ, with its heavy technology weighting, is directly exposed to any further deterioration in semiconductor sentiment.
Furthermore, the daily MACD histogram at -1.80 is still expanding negatively. Until that histogram starts to contract and the MACD lines begin to converge, the path of least resistance remains lower. That exogenous pressure compounds the technical vulnerability.
Positioning, Volatility, and the Road Ahead
The Invesco QQQ Trust, Series 1 stock sits in a fragile equilibrium — the daily chart says neutral, but the weight of evidence skews toward continued softness.
Right now, the picture is one of fragile equilibrium. The evidence — from MACD, EMA stack, Bollinger positioning, and hourly alignment — skews toward continued softness. The $706.76 EMA50 and $701.17 S1 are the two most important near-term levels to watch.
Volatility, as measured by the daily ATR14 of $14.42, remains high enough to produce sharp moves in either direction. Traders should account for that range when sizing any position. The long-term structural uptrend, anchored by the EMA200 at $645.09, is not in question. In the near term, however, until QQQ can recapture its EMA20 and daily pivot on a closing basis, the bears hold a technical edge.
FAQ
What is the current price of Invesco QQQ Trust, Series 1 stock?
QQQ closed at $705.94 on July 16, sitting just below the daily pivot of $707.38 and slightly under the daily EMA50 at $706.76.
Is QQQ in a bearish trend?
The daily chart remains classified as neutral, but the 1-hour timeframe is explicitly bearish with all three EMAs stacked in bearish order. The daily MACD histogram at -1.80 continues to expand negatively, signaling that selling momentum is still accelerating.
What are the key support levels for QQQ?
The most critical near-term supports are the daily EMA50 at $706.76, the daily S1 pivot at $701.17, and the lower Bollinger band at $699.97. A close below $700 would mark a significant technical breakdown.
Is the long-term uptrend for QQQ still intact?
Yes. The daily EMA200 sits far below current price at $645.09, confirming the longer-term uptrend remains structurally intact. Any pullback that stays above that level is a correction within an uptrend rather than a trend reversal.
Disclaimer: This article is for informational purposes only and does not constitute financial advice, an investment recommendation, or a solicitation to buy or sell any financial instrument or cryptocurrency. The analysis provided is not indicative of future results. Investing in crypto assets and financial markets carries a high risk of capital loss. Always do your own research (DYOR) and consult a qualified financial advisor before making any decision.
Article produced with the assistance of artificial intelligence and reviewed by the editorial team.
