



AAPL closed at $318.01 on July 13 after touching an intraday record of $323.42. The daily trend is firmly bullish, with price well above all key moving averages. However, a new OpenAI lawsuit and analyst margin warnings are complicating the fundamental backdrop ahead of Q3 earnings.
Summary
Key takeaways
- AAPL closed at $318.01 on July 13, just below the daily pivot point of $319.27
- The daily EMA stack confirms a strong uptrend, with EMA20 at $303.59 and EMA200 at $271.27
- Daily RSI at 64.57 signals robust momentum without entering overbought territory
- Citi raised its price target to $365, implying roughly 15% upside from current levels
- Intraday rejection from the daily Bollinger upper band at $323.30 flags near-term exhaustion risk
Daily Timeframe — Strong Trend Structure Meets Upper Boundary Risk
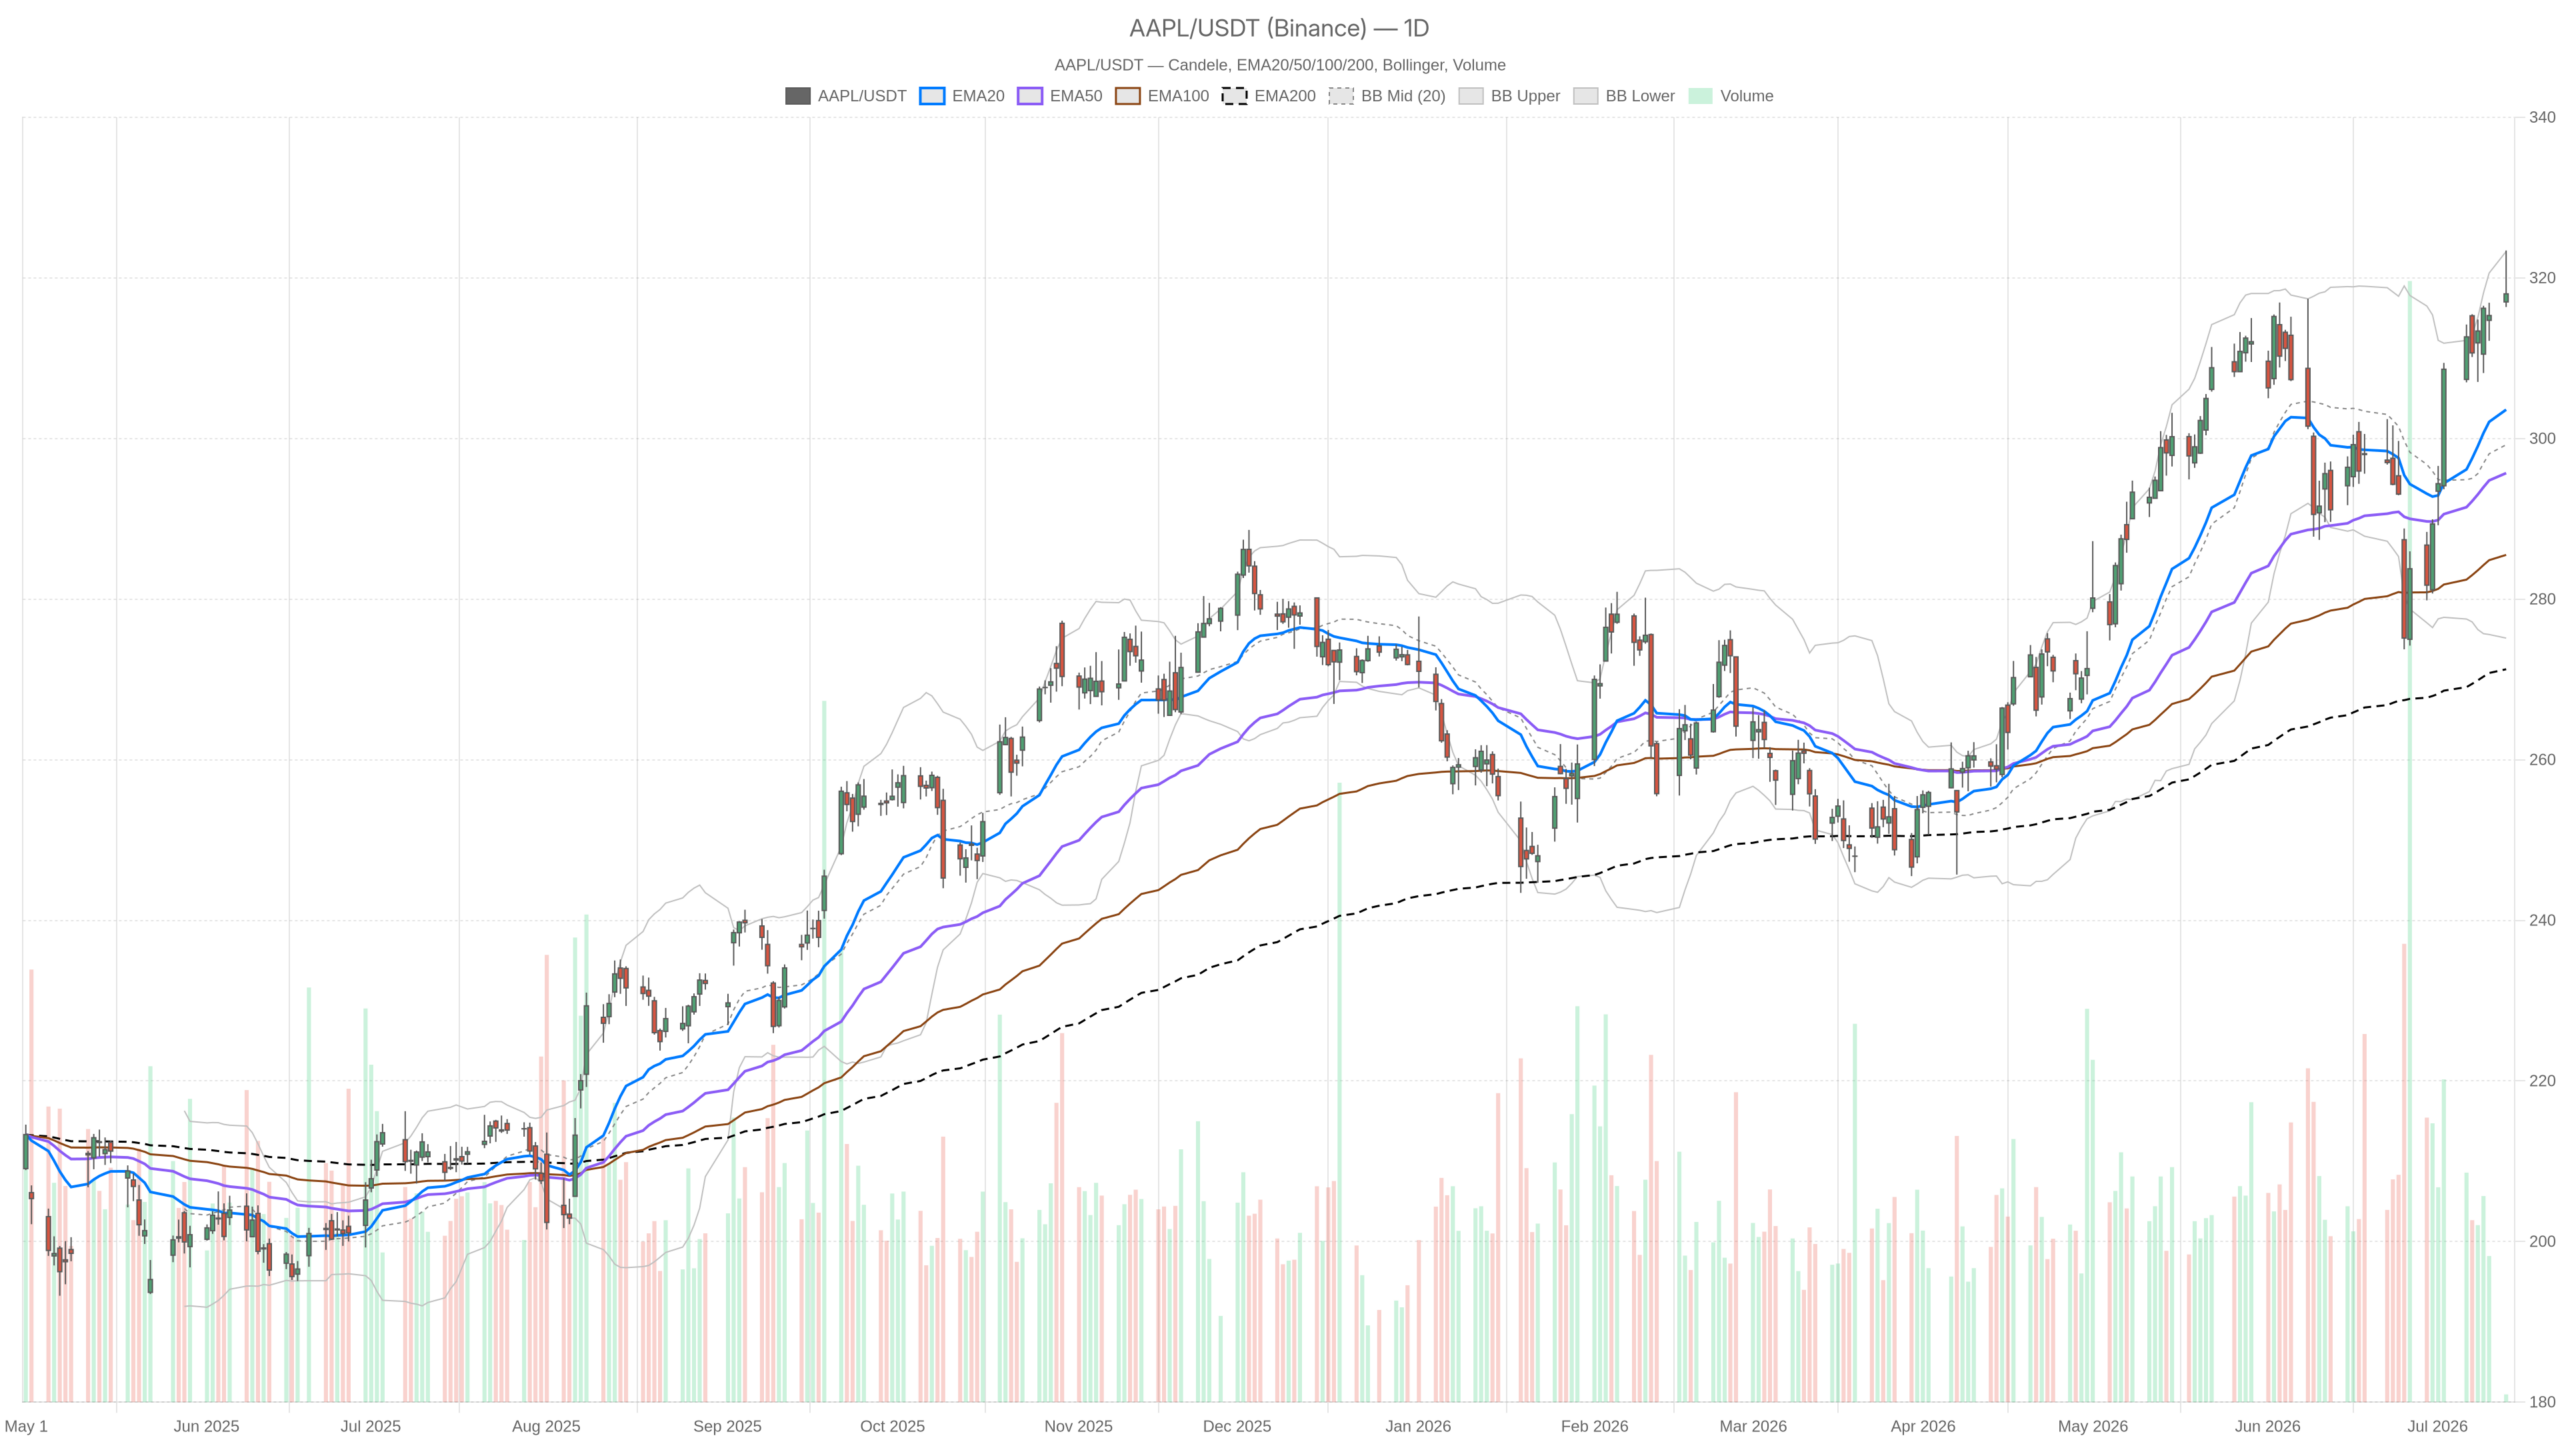
The daily chart confirms a well-established uptrend for Apple stock. Price at $318.01 sits meaningfully above all three key exponential moving averages, with no signs of internal deterioration.
The EMA20 stands at $303.59, the EMA50 at $295.70, and the EMA200 at $271.27. The spread between EMA20 and EMA200 alone exceeds $32. This reflects sustained buying pressure accumulated over multiple months. Such structural alignment deserves respect from both bulls and bears.
The daily RSI at 64.57 is elevated but not yet in overbought territory. It signals strong momentum without flashing an immediate exhaustion warning. Meanwhile, the MACD reinforces the same read. The MACD line at 5.30 sits above the signal line at 2.57, with a histogram of 2.72. That is a positive crossover with meaningful separation. Momentum is not only present — it is still expanding.
However, the Bollinger Bands add a critical nuance. The upper band sits at $323.30 and price tagged it intraday. This means AAPL is stretched at the top of its volatility envelope. It does not invalidate the trend. But it does flag the risk of mean reversion toward the midline at $299.22 if buying pressure fades.
Daily pivot analysis places the pivot point at $319.27. The current close of $318.01 sits fractionally below that level. Resistance at R1 of $322.16 aligns closely with the recent intraday high and the Bollinger upper band. This zone has already attracted sellers once. Support at $315.12 is the first meaningful floor on any pullback. The daily ATR of 9.12 reflects a wide intraday range environment. Traders should factor in that volatility when sizing positions or placing stops.
Hourly Timeframe — Momentum Stalling Near the Top
The hourly chart broadly supports the daily bullish bias but signals near-term momentum exhaustion. AAPL is pressing against the 1H Bollinger upper band and the MACD histogram has nearly flatlined.
Price remains above the 1H EMA20 at $314.73, EMA50 at $309.54, and EMA200 at $301.44. All three are stacked in bullish order — a constructive configuration. Yet the hourly Bollinger Bands tell a more nuanced story. The upper band sits at $318.36. The current close of $318.01 is essentially pressing against that ceiling.
Notably, the session opened at $320.22 and traded as high as $320.29 before fading. Price closed near the lower portion of the hourly range. That intraday reversal pattern matters for short-term traders.
The 1H RSI at 62.83 remains healthy but has been drifting lower from more extended readings. Meanwhile, the hourly MACD histogram has compressed dramatically. At just 0.04, it is barely positive. The MACD line and signal line are nearly identical at 2.09 and 2.05 respectively. This near-convergence points to a loss of short-term momentum. It does not signal a reversal, but it does suggest the hourly upside is temporarily exhausted.
The 1H pivot point is at $318.71, with R1 at $319.59 and S1 at $317.13. Price is currently sandwiched between S1 and the pivot. This is a neutral-to-slightly-weak short-term position that reflects the session’s indecisive close.
15-Minute Timeframe — Quiet Consolidation Without a Catalyst
The 15-minute chart shows a market in consolidation mode with no clear directional catalyst. Price hugs the $318 area on minimal volume and neutral momentum readings.
The last candle printed between $317.83 and $318.14, with volume at just 11,956 shares. The 15m RSI at 55.08 is neutral, leaning slightly bullish. The MACD histogram is a near-flat 0.03. In short, the 15m chart reflects a market in wait-and-see mode. It is consolidating after the morning’s push to highs.
There is no 15m momentum to drive a breakout in either direction without a fresh catalyst. The 15m ATR of 1.61 reflects tight near-term volatility. This timeframe is purely about execution context for active traders.
Bullish Scenario for AAPL — New CEO, Citi Upgrade, and iPhone Cycle
The bullish case for Apple stock rests on institutional support and product cycle catalysts. Citi’s $365 price target and the upcoming iPhone launch provide credible upside fuel.
Citi raised its price target to $365 ahead of earnings, citing iPhone share gains, a September launch catalyst, and Siri AI improvements boosting services revenue. That target implies roughly 15% upside from current levels — meaningful institutional conviction. On the daily chart, reclaiming and holding above the $319.27 pivot would shift the short-term bias back to bullish momentum. R1 at $322.16 and the record intraday high near $323.42 would then serve as the next targets in sequence.
Additionally, new CEO John Ternus brings a product-focused leadership style. His clear on-device AI strategy adds a strategic dimension to the bull case. If Q3 earnings deliver on iPhone growth and services expansion, the technical picture could justify a sustained move toward the Citi target. A breakout above $323.42 on strong volume would technically confirm that the all-time high is a launchpad, not a ceiling.
Bearish Scenario for AAPL — Margin Pressure, Lawsuit, and Stretched Valuations
The bearish case is anchored in legal risk and margin compression fears. The OpenAI lawsuit and rising component costs create tangible headwinds that could weigh on sentiment heading into earnings.
The OpenAI lawsuit accuses the company of coordinating theft of Apple’s most sensitive hardware secrets. It landed at the worst possible time — just as OpenAI prepares for what is described as the most anticipated AI IPO in history. The legal uncertainty could weigh on sentiment if it escalates further. At the same time, Seeking Alpha’s analysis points to an impending margin crisis. Soaring NAND and DRAM costs threaten to compress earnings ahead of Q3 results.
Technically, the daily close below the pivot point at $319.27 adds weight to the idea that AAPL may need to digest recent gains. This is reinforced by the intraday rejection from the daily Bollinger upper band at $323.30. A close below S1 at $315.12 would open the door to a deeper retest of the EMA20 at $303.59. A sustained break of that level would meaningfully challenge the bullish narrative. That outcome is not the base case given current trend strength, but it deserves monitoring.
Positioning and Final Outlook for AAPL Stock
AAPL’s technical outlook favors bulls on the daily timeframe, but chasing at current levels carries elevated risk. A pullback toward $315–$316 would offer a more favorable entry for trend-aligned traders.
The trend structure is intact, momentum indicators are positive, and institutional coverage remains supportive. In contrast, the short-term hourly picture shows clear signs of fatigue near resistance. The fundamental news flow also carries real uncertainty.
Overall, the AAPL stock price is within touching distance of all-time highs. However, proximity to the Bollinger upper band and the pivot point rejection argue against chasing here. Patience is warranted. With the daily ATR elevated at $9.12, volatility remains a defining feature of this tape — in both directions.
FAQ
What is the current AAPL stock price and key technical level?
Apple stock closed at $318.01 on July 13, just below the daily pivot point of $319.27. The intraday high reached $323.42, which touched the daily Bollinger upper band at $323.30.
Is Apple stock still in a clear uptrend?
Yes. The daily EMA stack confirms a strong uptrend, with price well above the EMA20 at $303.59, EMA50 at $295.70, and EMA200 at $271.27. The daily RSI at 64.57 and expanding MACD histogram at 2.72 both support continued bullish momentum.
What are the main risks facing AAPL stock right now?
Two key risks stand out: the OpenAI lawsuit alleging theft of Apple hardware secrets, and rising NAND and DRAM costs threatening margins ahead of Q3 earnings. Technically, rejection from the Bollinger upper band at $323.30 also signals near-term exhaustion risk.
What is Citi’s price target for Apple stock?
Citi raised its AAPL price target to $365 ahead of earnings, implying roughly 15% upside from the July 13 close of $318.01. The upgrade cites iPhone share gains, a September launch catalyst, and Siri AI improvements.
Disclaimer: This article is for informational purposes only and does not constitute financial advice, an investment recommendation, or a solicitation to buy or sell any financial instrument or cryptocurrency. The analysis provided is not indicative of future results. Investing in crypto assets and financial markets carries a high risk of capital loss. Always do your own research (DYOR) and consult a qualified financial advisor before making any decision.
Article produced with the assistance of artificial intelligence and reviewed by the editorial team.
