




AAPL hit an all-time high of $318.79 on July 13, confirming its structurally intact bullish trend. Price sits above every major moving average and momentum points higher. Yet intraday momentum is starting to thin, and a cluttered news backdrop adds meaningful near-term uncertainty.
Summary
Key takeaways
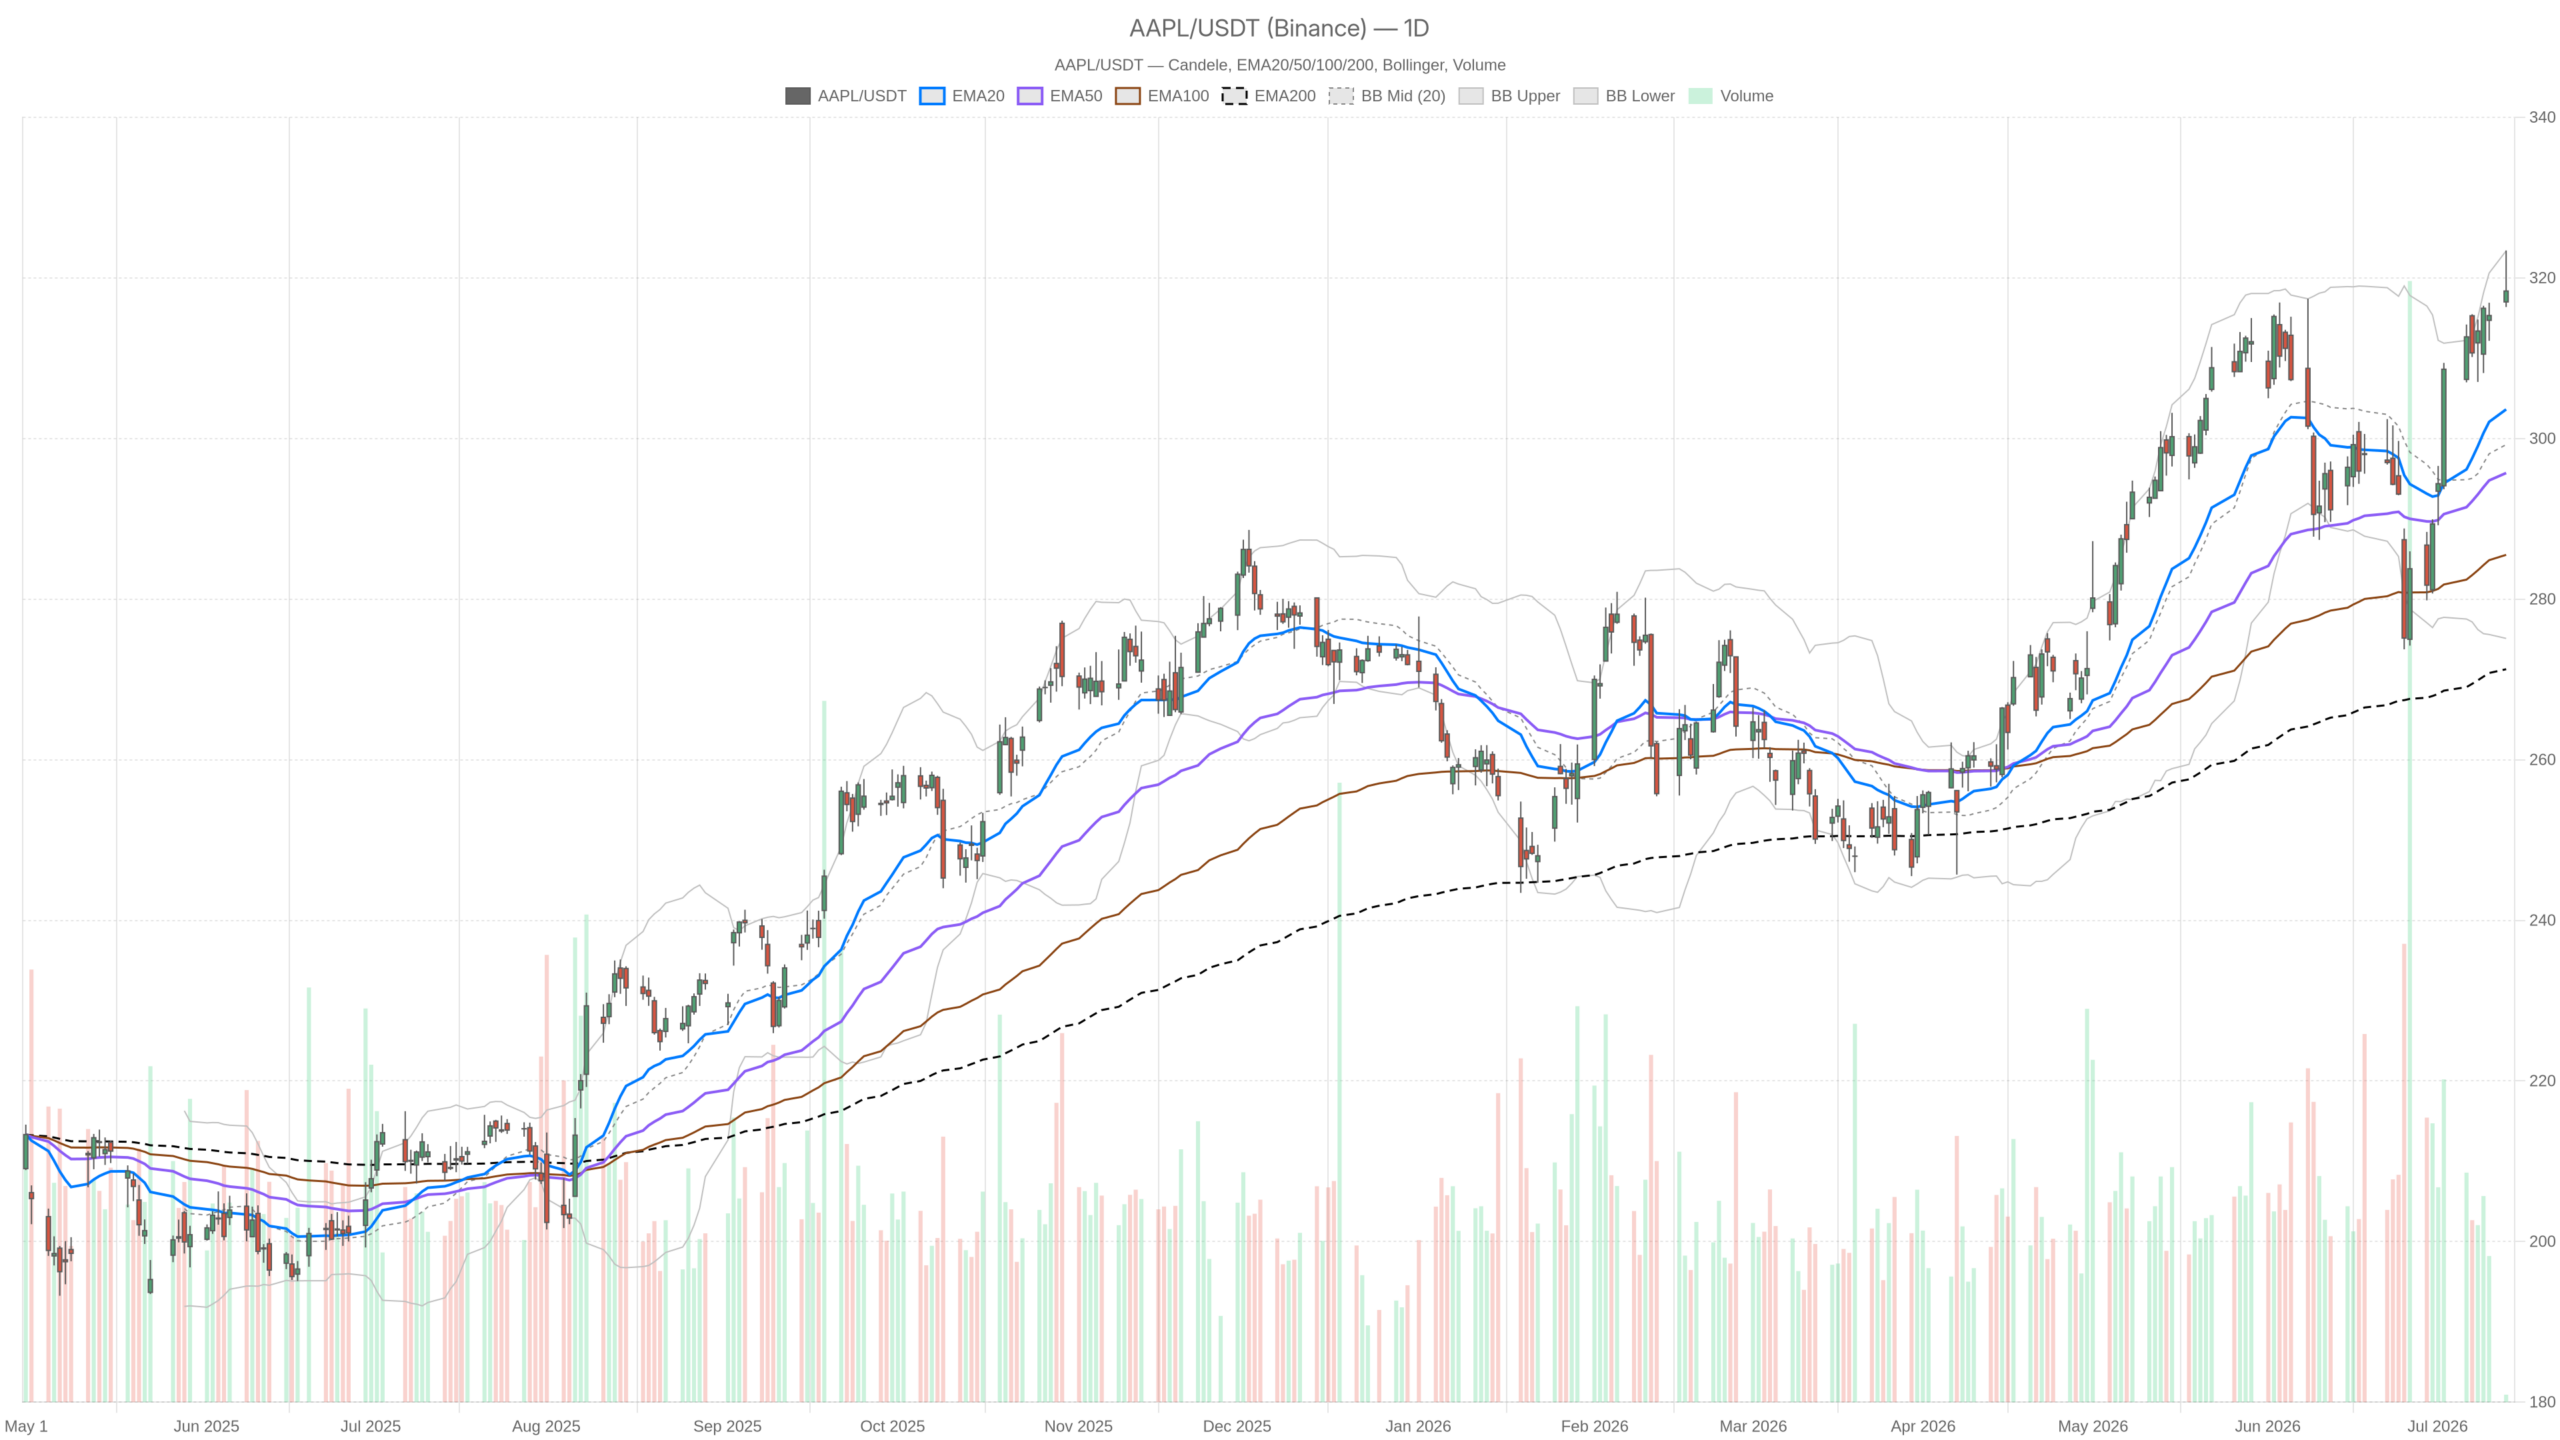
- AAPL reached an all-time high of $318.79, trading above the EMA20 at $303.63, EMA50 at $295.71, and EMA200 at $271.27
- Daily RSI at 64.78 leaves room to run before overbought; the daily MACD remains firmly positive with a histogram of 2.74
- Both daily and hourly Bollinger Bands show price at upper extremes, signaling short-term overextension across timeframes
- Citi raised its Apple price target to $365; offset by margin pressure risks tied to rising NAND and DRAM costs and an OpenAI lawsuit
- The $315.36 daily S1 support marks the line in the sand — a break below would threaten the entire bullish structure
Daily Timeframe Confirms AAPL’s Bullish Structure With One Caveat
The daily chart confirms AAPL remains in a strong bullish trend with no credible reversal signals. However, price has tagged the upper Bollinger Band, hinting at short-term overextension.
AAPL closed at $318.37. The stock sits above the EMA20 at $303.63, the EMA50 at $295.71, and the EMA200 at $271.27. This stacked moving average configuration reflects a trend built with conviction over a sustained period. Price is not just above trend — it is meaningfully above it.
The daily MACD reinforces the point. The MACD line at 5.32 sits above the signal line at 2.58. A positive histogram of 2.74 points to active upward momentum, not a tired or fading move. Meanwhile, the RSI at 64.78 adds important context. The stock is approaching overbought territory but has not crossed into it. There is still technical room to run before momentum exhaustion becomes a primary concern.
Bollinger Bands Flash an Overextension Warning
However, the Bollinger Band picture warrants attention. The upper band on the daily sits at $323.37 — just above today’s intraday high of $323.42. Price effectively tagged the upper band before pulling back to close at $318.37. That behavior is a classic sign of short-term overextension. It does not break the bullish thesis. But it suggests the market may need consolidation before attempting another leg higher.
The daily ATR of $9.12 reflects a wide-ranging environment. Volatility is elevated. Traders should factor that into any position sizing decision. Intraday swings can be sharp even within a trending move. The daily pivot point sits at $319.39, with resistance at $322.40 and support at $315.36. AAPL is currently trading just below its own pivot — a mild technical negative at the close.
Hourly Chart: AAPL Remains Bullish, But Momentum Is Nearly Exhausted
The hourly timeframe remains bullish but shows momentum that is nearly exhausted. Price holds above key moving averages, yet the MACD histogram has thinned to a negligible reading.
Price remains above the H1 EMA20 at $314.76, EMA50 at $309.56, and EMA200 at $301.44. All three sit in a clean upward sequence. That alignment confirms the daily trend is filtering down to shorter timeframes without disruption.
Bollinger Bands and MACD Align on a Warning
At the same time, the hourly MACD histogram tells a different story. The histogram reading of just 0.07 is paper-thin. The MACD line at 2.12 barely clears its signal at 2.05. This near-convergence signals that hourly bullish momentum has nearly exhausted itself. A crossover to the downside would not reverse the trend. But it would likely trigger short-term selling pressure.
Notably, the Bollinger Bands on the H1 frame add a sharper warning. The upper band sits at $318.44. AAPL closed at exactly $318.37 — essentially touching the upper band. On the hourly scale, that is a direct signal of short-term overextension. Combined with the fading MACD histogram, it argues against aggressive long entries at current levels without a pullback first.
The H1 RSI at 64.05 mirrors the daily reading almost exactly. Neither overbought nor neutral, it reflects a market that is extended but not yet screaming reversal. The H1 pivot at $319.01 puts resistance at $319.65, with support at $317.72. This tight range frames current price action clearly.
15-Minute Chart: AAPL Pauses Within the Bullish Structure
The 15-minute chart reflects a pause for consolidation within the larger bullish structure. It offers no directional signal of its own but provides useful execution context for short-term traders.
Price closed at $318.37, just off its 15m high of $319.22. The RSI on the 15m sits at 56.72 — noticeably cooler than both the daily and hourly readings. That divergence is meaningful. As the higher timeframes show elevated RSI, the 15m has already started to release some of that pressure.
The 15m MACD is still positive with a histogram of 0.19, but it is small. The 15m ATR of $1.61 suggests short-term moves are contained. For short-term traders, this pause may offer a better entry on a minor dip toward the $317–$318 zone rather than chasing the current print.
AAPL’s News Layer Blends a Bullish Upgrade With Genuine Risk Factors
The fundamental backdrop is mixed, with an analyst upgrade offset by a CEO transition, an OpenAI lawsuit, and margin concerns. Citi’s bullish call gives the bull case institutional weight, but multiple risk factors complicate the picture.
On the bullish side, Citi raised its Apple price target to $365 ahead of earnings. The upgrade cites iPhone share gains, September launch catalysts, and an AI-driven services boost from Siri. That analyst note gives institutional weight to the bull case. It helps explain why AAPL was trading at record highs today.
Legal, Leadership, and Margin Headwinds
In contrast, the picture is complicated by multiple risk factors that surfaced simultaneously. Apple has reportedly sued OpenAI, alleging a coordinated effort to steal sensitive hardware secrets. The lawsuit emerged at what reporting describes as a particularly delicate moment for OpenAI. The company is preparing for an anticipated AI IPO. The legal and reputational dimensions are unquantifiable in the short term, but the timing is not ideal.
Meanwhile, a new CEO transition is underway, with John Ternus stepping into the role. His product-focused background and on-device AI strategy have generated optimism. Still, the market is not yet certain whether that is enough to outperform the broader index over his first year. Leadership transitions carry inherent uncertainty, regardless of the individual’s credentials.
On top of that, Seeking Alpha flagged a potential margin crisis heading into Q3 earnings. The pressure is driven by rising NAND and DRAM costs. If margin compression materializes in the earnings report, the technical picture could shift quickly. That risk is real. It makes the current all-time high a less comfortable entry point for investors without a defined risk plan.
Bullish Scenario: What Would Keep AAPL Moving Higher
The bull case remains viable if AAPL holds above $315.36 and reclaims the daily pivot at $319.39. A strong Q3 earnings report that dispels margin concerns would provide the catalyst needed to push beyond current resistance.
From there, the path toward the Citi price target of $365 remains structurally open. Clearing the daily Bollinger upper band near $323.37 would be the first confirmation that buyers are stepping in with conviction.
Additionally, the new CEO’s on-device AI strategy could become a re-rating event. This would require the September product cycle to land well with consumers. A further Siri upgrade cycle could accelerate services revenue — the margin-accretive part of the business. Any positive headline on that front would reinforce the daily bullish regime. It would also pull in incremental institutional buying.
Bearish Scenario: What Would Break AAPL’s Bull Case
A break below $315.36 would be a genuine warning sign for AAPL. That level sits about $3 below the current close — within a single day’s ATR range. A breach could trigger a retest of the $303–$300 zone.
A break on earnings-driven volume would be particularly damaging. The $303–$300 zone is where the EMA20 and EMA50 cluster on the daily chart. Losing that area would shift the intermediate-term structure from bullish to neutral at best.
The margin pressure narrative is the biggest fundamental threat. If Q3 earnings show meaningful gross margin deterioration from NAND and DRAM cost inflation, the technical support levels will struggle to hold. In that scenario, the Bollinger Band mean at $299.24 would become the logical downside target. The OpenAI lawsuit, while uncertain in outcome, adds headline risk that could amplify any selloff triggered by weak earnings.
AAPL Positioning and Outlook: Conviction in the Trend, Caution in the Timing
AAPL’s trend warrants conviction, but current levels call for patience rather than urgency on new long entries. The stock is trading at its upper Bollinger Band on both daily and hourly charts simultaneously, while hourly MACD momentum is nearly flat.
The daily regime has not shown any credible signs of reversal across all three timeframes. Still, the simultaneous upper-band touch on two timeframes is a rare alignment. It historically precedes consolidation. That makes chasing the all-time high a lower-probability trade than waiting for a pullback.
Therefore, the most rational positioning approach is to monitor how AAPL behaves around the $315–$319 range over the coming sessions. A clean hold and bounce from that zone, with a reset in momentum indicators, would provide a much cleaner risk-reward entry. Ahead of Q3 earnings, volatility is likely to stay elevated. The daily ATR of $9.12 makes that clear. Conviction is warranted in the trend; caution is warranted in the timing.
FAQ
Is AAPL stock still in a bullish trend?
Yes. AAPL closed at $318.37, trading above the EMA20 at $303.63, EMA50 at $295.71, and EMA200 at $271.27 on the daily chart. The daily MACD remains positive with a histogram of 2.74, and the RSI at 64.78 has not reached overbought territory.
What is the key support level for AAPL right now?
The most important near-term support sits at $315.36 — the daily S1 pivot level. A break below that would be a genuine warning sign and could trigger a retest of the $303–$300 zone where the EMA20 and EMA50 cluster on the daily chart.
What risks could derail the AAPL bull case?
Margin pressure from rising NAND and DRAM costs is the biggest fundamental threat heading into Q3 earnings. An ongoing OpenAI lawsuit adds headline risk. Additionally, the CEO transition under John Ternus carries inherent uncertainty despite optimism around his on-device AI strategy.
What is the analyst price target for Apple stock?
Citi recently raised its Apple price target to $365, citing iPhone share gains, September launch catalysts, and an AI-driven services boost from Siri. Current resistance sits near $323.37 at the daily Bollinger upper band.
Disclaimer: This article is for informational purposes only and does not constitute financial advice, an investment recommendation, or a solicitation to buy or sell any financial instrument or cryptocurrency. The analysis provided is not indicative of future results. Investing in crypto assets and financial markets carries a high risk of capital loss. Always do your own research (DYOR) and consult a qualified financial advisor before making any decision.
Article produced with the assistance of artificial intelligence and reviewed by the editorial team.
