




Caught between conflicting signals, Ethereum is attempting a daily recovery even as hourly momentum deteriorates. As of July 13, 2026, the Ethereum price today sits at $1,778.96 — a level that places ETH directly at the crossroads of two opposing technical narratives.
Summary
Key takeaways
- ETH trades at $1,778.96, above the daily EMA20 but below the critical $1,799–$1,800 resistance zone
- The daily MACD has printed a bullish crossover, while the 1-hour chart remains firmly under seller control
- The Fear & Greed Index sits at 28, and Bitcoin dominance at 56% continues to weigh on altcoin performance
- Uniswap V3 fees surged 48.84% in 24 hours, signaling active repositioning rather than clear accumulation
- A decisive close above $1,800 is required to validate the recovery thesis; failure risks a slide toward $1,753
How Is Ethereum Performing on the Daily Timeframe?
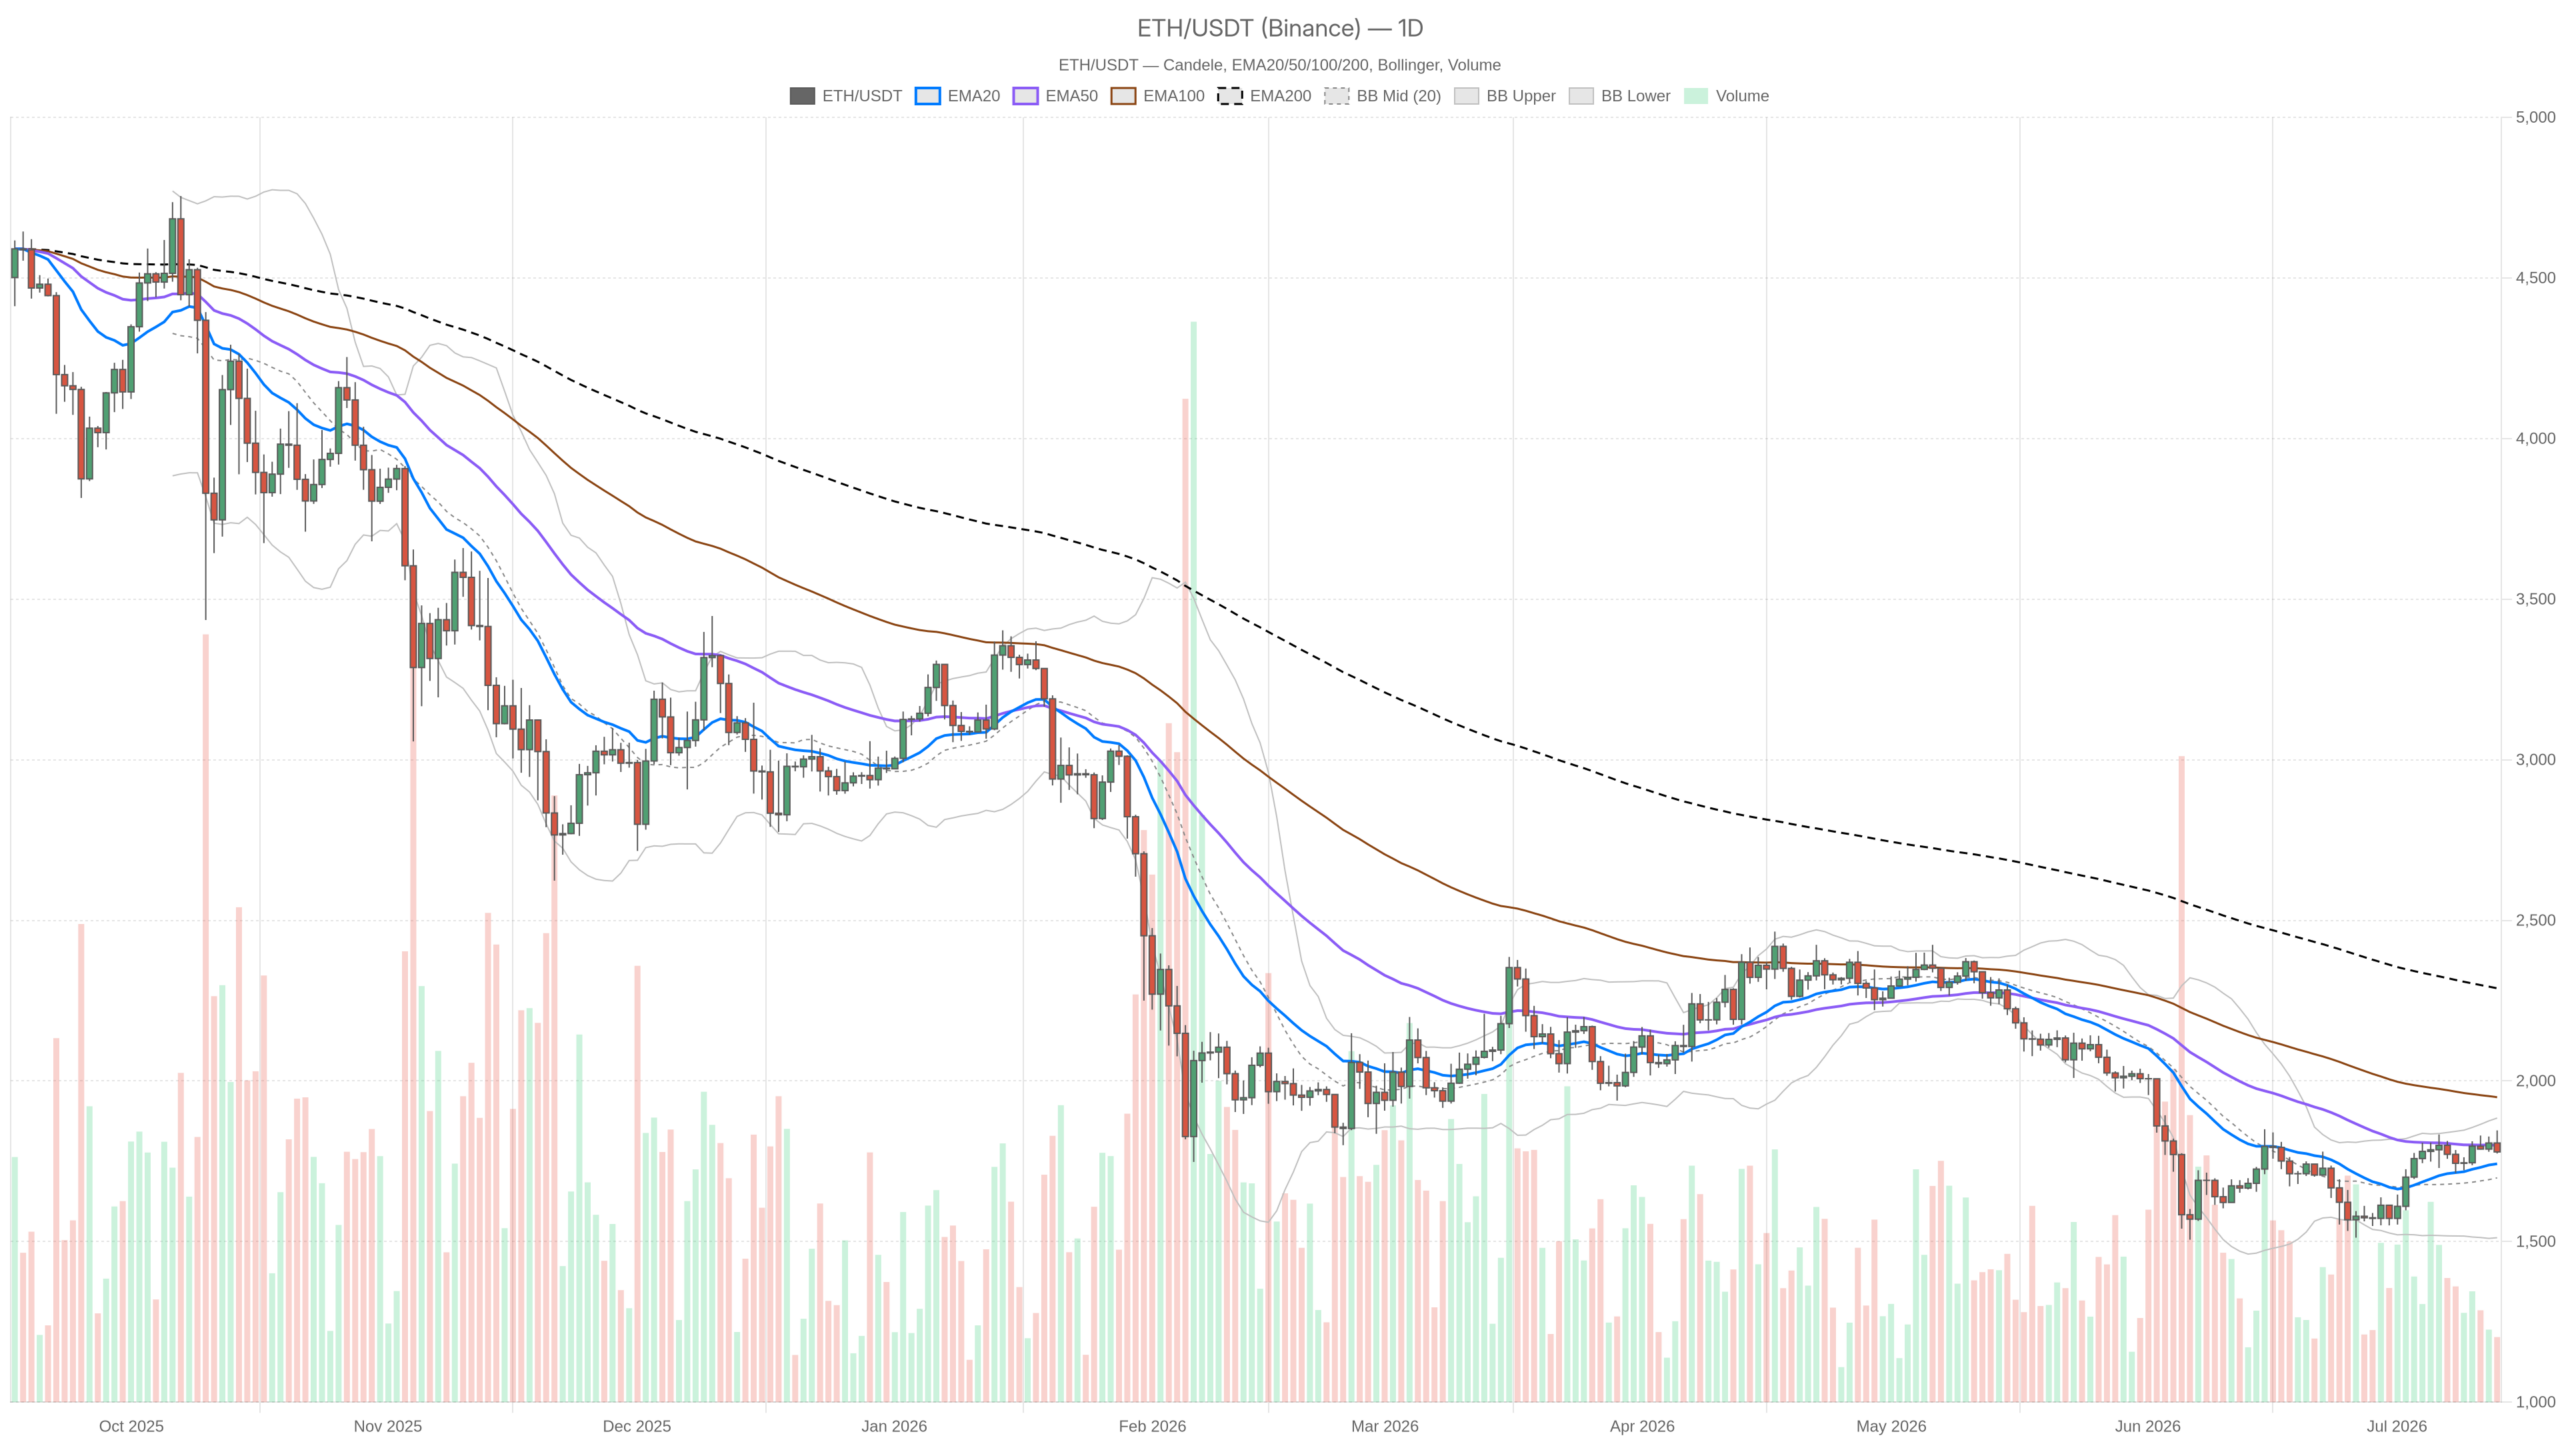
Ethereum’s daily chart shows a tentative recovery, with price above the EMA20 and a fresh MACD bullish crossover. The close at $1,778.96 sits above the EMA20 at $1,742.05, which is constructive. The MACD line has crossed above the signal (+14.20 vs. -3.22), and the histogram at +17.42 confirms expanding bullish momentum. RSI at 54.42 remains neutral-to-positive with room to run before reaching overbought territory.
However, the broader structure demands caution. The EMA200 at $2,288.50 means ETH trades roughly 22% below its long-term moving average — a damaged chart attempting to stabilize, not a confirmed recovery. The EMA50 at $1,799.73 and the daily pivot at $1,799.65 converge to make the $1,799–$1,800 zone the most critical level. R1 at $1,825.31 represents the next test above, while S1 at $1,753.30 provides the first defensive floor. With a daily ATR of 71.31, swings of that magnitude are entirely routine.
What Does the 1-Hour Chart Reveal About Short-Term Momentum?
The 1-hour chart is unambiguously bearish. ETH trades below both the EMA20 at $1,799.10 and the EMA50 at $1,800.62, confirming the $1,799–$1,800 zone as active resistance. RSI has dropped to 36.15 — approaching oversold but not yet there, meaning additional downside momentum could still bleed out before a natural bounce emerges. The MACD is clearly negative, with the line at -7.08 versus the signal at -2.54 and a histogram of -4.55 showing sellers have not relented.
Nevertheless, the one constructive element at this timeframe is the EMA200 at $1,768.70, which sits below current price and keeps the medium-term hourly structure intact. ETH is pinned in a compression zone: overhead resistance at $1,799–$1,800, with support from the hourly Bollinger lower band at $1,772.90 and the EMA200. Whichever boundary breaks with conviction will define the next directional move.
On the 15-minute chart, the regime is classified as bearish — the only timeframe carrying a directional label. Price at $1,778.79 sits below every relevant EMA. That said, the MACD histogram has ticked to +0.50, the first positive print after a stretch of negative readings. This micro-divergence is not a reversal signal, but it hints that selling pressure may be decelerating near current levels.
What Are the Bullish and Bearish Scenarios for ETH?
The path forward hinges entirely on whether Ethereum can reclaim the $1,800 level. A decisive hourly close above that threshold — clearing the EMA20/50 cluster and the daily pivot — would shift the near-term structure in favor of buyers. The daily MACD momentum and an RSI at 54 would then support a run toward R1 at $1,825.31 and potentially the upper Bollinger band at $1,884.48. Invalidation arrives with a sustained break below $1,753.30, exposing the lower range toward $1,511.96.
The bear case, conversely, requires little imagination. If price continues to reject $1,799–$1,800 and the hourly RSI breaks below 30, a retest of $1,753.30 becomes the base case. Below that level, a genuine structural gap exists before meaningful support re-emerges. The daily ATR of 71.31 means a single adverse session could cover that entire distance. The macro backdrop — Fear index at 28, BTC dominance at 56%, and total crypto market cap declining 1.2% — provides the wind for this scenario. Invalidation would require a strong daily bullish engulfing candle closing above $1,825.
What Does DeFi Activity Tell Us About Market Sentiment?
Spiking DEX volumes suggest active repositioning among market participants, though in a Fear-dominated environment this does not necessarily indicate bullish accumulation. According to DefiLlama data, Uniswap V3 fees jumped 48.84% in the last 24 hours and 119.54% over seven days. Curve DEX similarly recorded a 47.77% single-day increase, with a 7-day surge of 137.14%. Elevated on-chain trading where the Fear & Greed Index reads 28 is as likely to reflect panic rotation as genuine buying interest — a data point to monitor, not a catalyst to lean on.
The tension between timeframes makes Ethereum price today a study in conflicting signals. The daily MACD crossover is genuine, yet acting on it without hourly confirmation above $1,800 means buying directly into a resistance cluster. The volatility implied by the daily ATR of 71.31 is substantial enough that wrong-side positioning can become painful quickly. Until the $1,800 question resolves, patience and disciplined sizing remain the only reliable edges available.
FAQ
What is the current price of Ethereum?
As of July 13, 2026, Ethereum trades at $1,778.96, positioned above the daily EMA20 but below the critical $1,799–$1,800 resistance zone formed by the EMA50 and the daily pivot point.
Is Ethereum’s daily chart bullish or bearish right now?
The daily chart presents a cautiously constructive picture: ETH has closed above the EMA20, and the MACD has printed a bullish crossover with an expanding positive histogram. However, price remains 22% below the EMA200, indicating a damaged longer-term structure that is attempting to stabilize rather than clearly recovering.
What is the most important level to watch for Ethereum?
The $1,799–$1,800 zone is the fulcrum for ETH right now. It combines the daily EMA50, the daily pivot point, and the 1-hour EMA20/EMA50 cluster. A decisive close above this zone would validate the bullish recovery thesis, while continued rejection strengthens the bearish case toward $1,753.30 support.
Why did Uniswap and Curve fees surge recently?
Uniswap V3 fees rose 48.84% in 24 hours and Curve DEX fees increased 47.77%, according to DefiLlama. Elevated DEX activity often signals active repositioning or hedging by market participants, which in a Fear-driven environment can reflect panic rotation as much as genuine accumulation.
Disclaimer: This article is for informational purposes only and does not constitute financial advice, an investment recommendation, or a solicitation to buy or sell any financial instrument or cryptocurrency. The analysis provided is not indicative of future results. Investing in crypto assets and financial markets carries a high risk of capital loss. Always do your own research (DYOR) and consult a qualified financial advisor before making any decision.
Article produced with the assistance of artificial intelligence and reviewed by the editorial team.
