



The macro backdrop places Bitcoin at a crossroads: bears hold the line near $62,900 as inflation fears return amid surging oil prices. Sentiment sits firmly in fear territory at 28 on the Fear & Greed Index.
Summary
Key takeaways
- Bitcoin trades near $62,900 on July 13, 2026, below both the EMA20 and EMA50 on the daily timeframe.
- Fear & Greed Index at 28 confirms persistent bearish sentiment across the crypto market.
- Daily RSI at 48.05 signals there is still room for further downside before oversold conditions emerge.
- Uniswap V3 and Curve DEX fees surged over 60% and 98% respectively in 24 hours, signaling heightened on-chain repositioning.
- Critical support rests at $62,125 (daily S1); losing it with volume opens the path toward $58,397.
The daily regime is bearish — and the structure confirms it
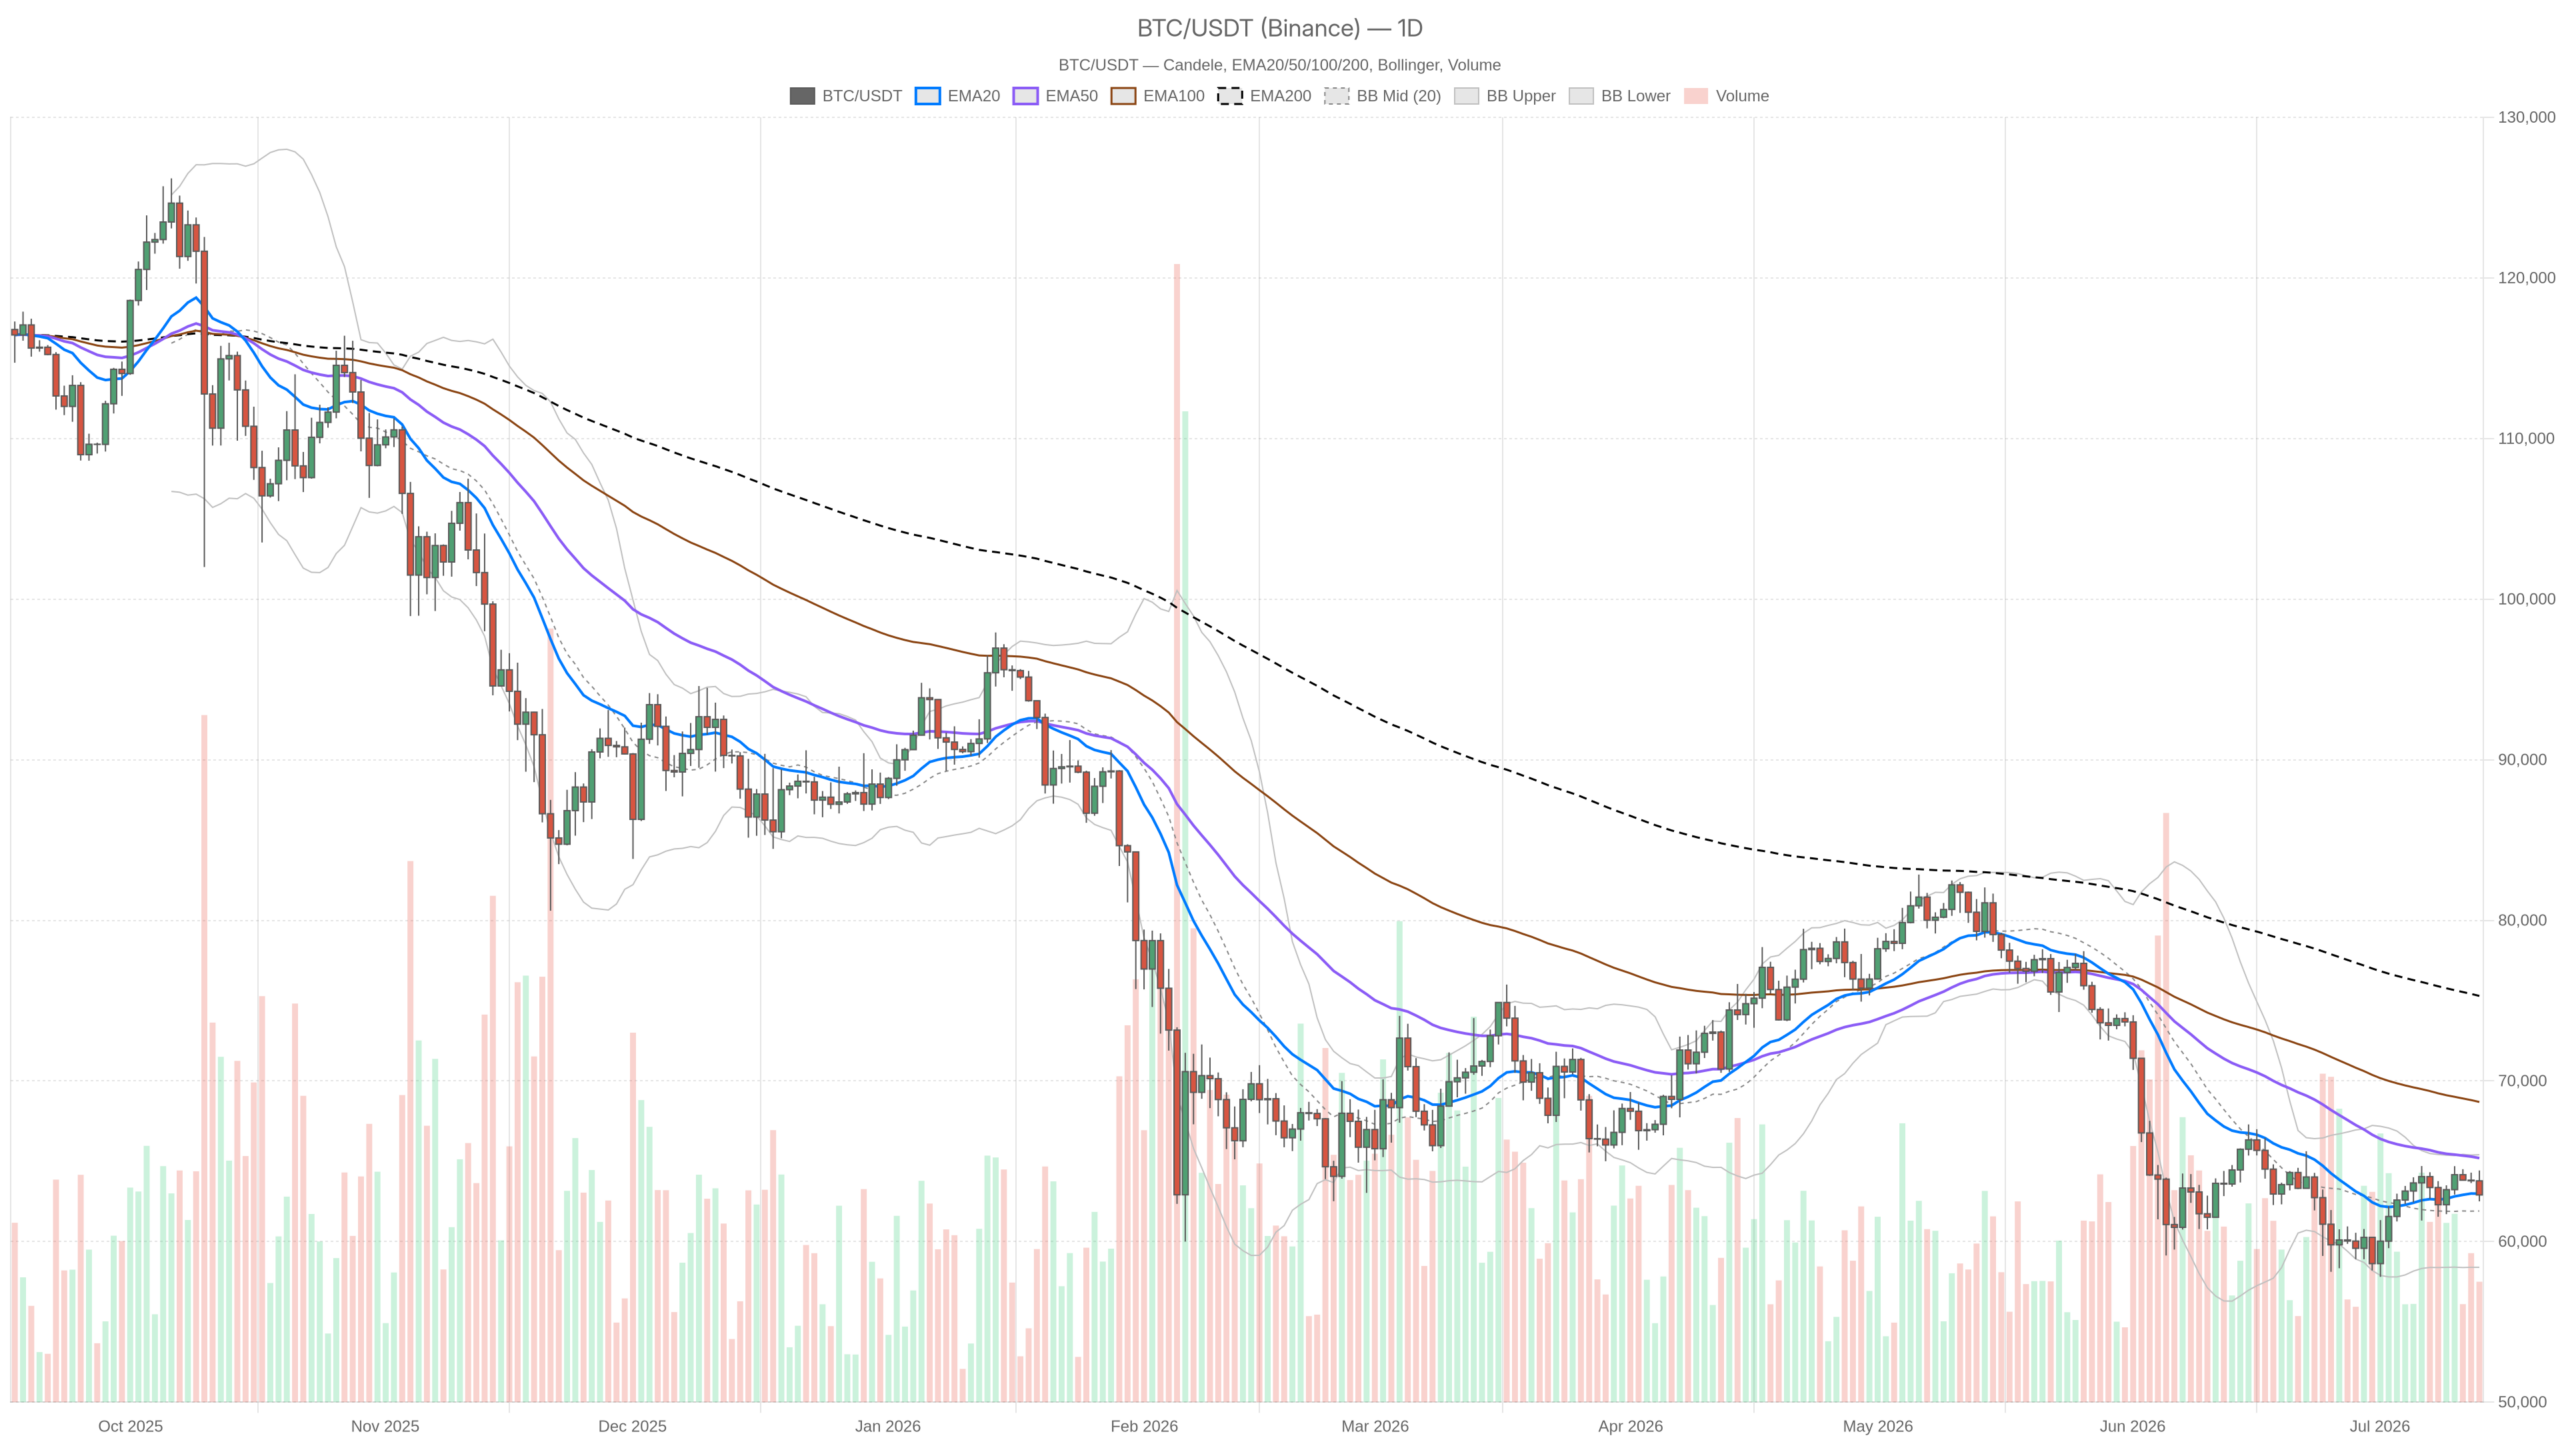
The daily trend is structurally bearish. Price at $62,900 trades below both the EMA20 at $62,981 and EMA50 at $65,195, with the EMA200 sitting far higher at $75,292. That gap confirms a prolonged downtrend rather than a mere dip. The stacked EMAs pointing downward leave the path of least resistance lower, and bulls would need to reclaim at minimum the EMA20 on a daily close to build any credible recovery case.
Daily RSI at 48.05 sits just below the neutral midpoint — a quiet grind that is more dangerous than a capitulation flush to 30. It suggests the market is not yet exhausted, and there remains room to fall before buyers step in with conviction. The MACD, however, offers a more nuanced picture: the line at -225.27 against a signal of -661.81 yields a histogram reading of +436.54. The positive and widening histogram signals that bearish momentum is losing velocity, cautioning against aggressive short positioning even though no bullish reversal has formed yet.
Bollinger Bands frame support at $58,396 and resistance at $65,403, with the midline at $61,900. Price consolidates in the upper half of the range without enough energy to challenge the band’s ceiling. Daily ATR at $1,908 confirms that moves remain wide enough to inflict damage in both directions — this is a choppy, directionally indecisive market with real bite.
Hourly tension: caught between structure and a potential exhaustion low
The 1-hour chart shows a clean bearish alignment, yet momentum is slowing. Price at $62,890 sits below the EMA20 ($63,288), EMA50 ($63,612), and EMA200 ($63,156) — a textbook bearish arrangement across all three averages. The regime is classified as neutral only because the pace of decline is decelerating. RSI at 35.99 approaches oversold territory without tipping into it, a level where short-term bounces become statistically likely but rarely sustain without daily trend cooperation.
The hourly MACD remains negative: line at -298.43 versus signal at -269.01, histogram at -29.42. Bearish momentum on this timeframe has not reversed. However, the small histogram suggests deceleration is underway. Combined with RSI near 36, a relief bounce is possible but would likely stall around the $63,288–$63,612 zone where hourly EMAs cluster — the first resistance wall any recovery must navigate.
The 15-minute frame adds execution-level nuance. The regime there shifts back to bearish, with RSI at 41.66 and price below all three EMAs. Pivot support on the 15M sits at $62,845, while daily S1 rests at $62,125. A conviction break below $62,845 opens the next meaningful level at daily S1 — the zone intraday traders must monitor closely.
DeFi activity offers a divergent on-chain signal
On-chain activity is diverging from price action, providing a rare counterpoint to the broader bearishness. Uniswap V3 fees surged 61.45% in 24 hours and 138.14% over the past week. Curve DEX fees jumped even more sharply — 98.29% in a single day and 218.21% over seven days. These spikes suggest traders are actively repositioning rather than sitting idle. Sharply rising DEX fees in a fear-driven environment often signal that smart money is moving, though whether this represents hedging or early accumulation remains an open question worth tracking closely.
The bull case and what it requires
A credible bullish reversal demands several sequential steps. First, price must hold above daily S1 at $62,125, then reclaim the daily pivot at $63,275 on a closing basis. A sustained move back above the EMA20 on the daily — currently $62,981 — would shift the short-term structure from distribution to something more constructive. If the daily MACD histogram continues expanding and eventually crosses into a bullish signal, combined with RSI pushing back above 50, a recovery toward $65,000 and the upper Bollinger Band becomes a legitimate scenario. The bull case is invalidated immediately if price loses $62,125 with volume, opening the door toward $58,397.
The bear case and where it leads
The bearish scenario remains dominant and requires little to stay in control. As long as price stays below the EMA20 and EMA50 on the daily and the macro narrative around oil-driven inflation suppresses risk appetite, sellers hold the structural advantage. A failed recovery attempt at the $63,275–$63,612 cluster — where daily pivot and hourly EMAs converge — followed by a break of $62,125 would confirm the next leg down. With daily ATR at $1,908, the move could be aggressive once triggered. Only a strong daily close above $63,612 invalidates this scenario by breaking the pattern of lower highs.
Positioning in an uncomfortable market
This market punishes those leaning too hard in either direction. The daily trend is bearish but momentum decelerates. The hourly approaches short-term oversold levels that historically generate bounces, while the 15-minute continues distributing. These timeframes in tension usually resolve with a sharp move — the question is direction, not whether volatility arrives.
The Fear & Greed reading of 28 and the oil-inflation narrative are real headwinds that should not be dismissed. Yet a recovering daily MACD histogram and an RSI that has not yet reached deeper capitulation levels suggest this is not a one-way street lower. Anyone positioning here should respect the $62,845–$62,125 support cluster as a critical zone. Price behavior around that range over the next few sessions will likely define the near-term trajectory, and Bitcoin at a crossroads: bears hold the line near $62,900 as inflation fears return is the defining condition for every trading decision in the sessions ahead.
FAQ
What is the current Bitcoin price and why is it under pressure?
Bitcoin is trading near $62,900 as of July 13, 2026. A spike in oil prices has reignited inflation concerns and, according to Bloomberg, this is actively weighing on Bitcoin as a risk asset. The Fear & Greed Index at 28 confirms that bearish sentiment is already entrenched.
What are the key support and resistance levels to monitor?
Key support sits at $62,125 (daily S1), with a break below opening the path toward $58,397, the daily lower Bollinger Band. Resistance clusters between $63,275 (daily pivot) and $63,612, where hourly EMAs converge. A daily close above the EMA20 at $62,981 would be the first constructive step for bulls.
Are there any bullish signals despite the bearish macro environment?
Yes, there are two notable divergences. The daily MACD histogram is positive and widening at +436.54, indicating bearish momentum is losing velocity and a crossover could be forming. Additionally, DEX fees on Uniswap V3 and Curve have surged over 60% and 98% respectively in 24 hours, signaling active on-chain repositioning that sometimes precedes volatility bursts.
What would invalidate the current bearish outlook?
A strong daily close above $63,612 would break the pattern of lower highs and invalidate the dominant bearish scenario. A sustained reclaim of the EMA20 ($62,981) combined with RSI pushing back above 50 would further support a recovery case toward $65,000 and the upper Bollinger Band at $65,403.
Disclaimer: This article is for informational purposes only and does not constitute financial advice, an investment recommendation, or a solicitation to buy or sell any financial instrument or cryptocurrency. The analysis provided is not indicative of future results. Investing in crypto assets and financial markets carries a high risk of capital loss. Always do your own research (DYOR) and consult a qualified financial advisor before making any decision.
Article produced with the assistance of artificial intelligence and reviewed by the editorial team.
