



Oracle’s price action in 2026 has been brutal. After shedding 35% in June alone, Orcl stock now trades near $142, far below every key daily moving average. The dominant thesis is unambiguously bearish. But extreme oversold readings warrant more nuance than a simple sell narrative implies.
Summary
Key takeaways
- ORCL has lost roughly 35% in June 2026 alone — its worst monthly performance since September 1990.
- Daily RSI at 28.78 sits deep in oversold territory, signaling deteriorating risk-reward for aggressive short positions.
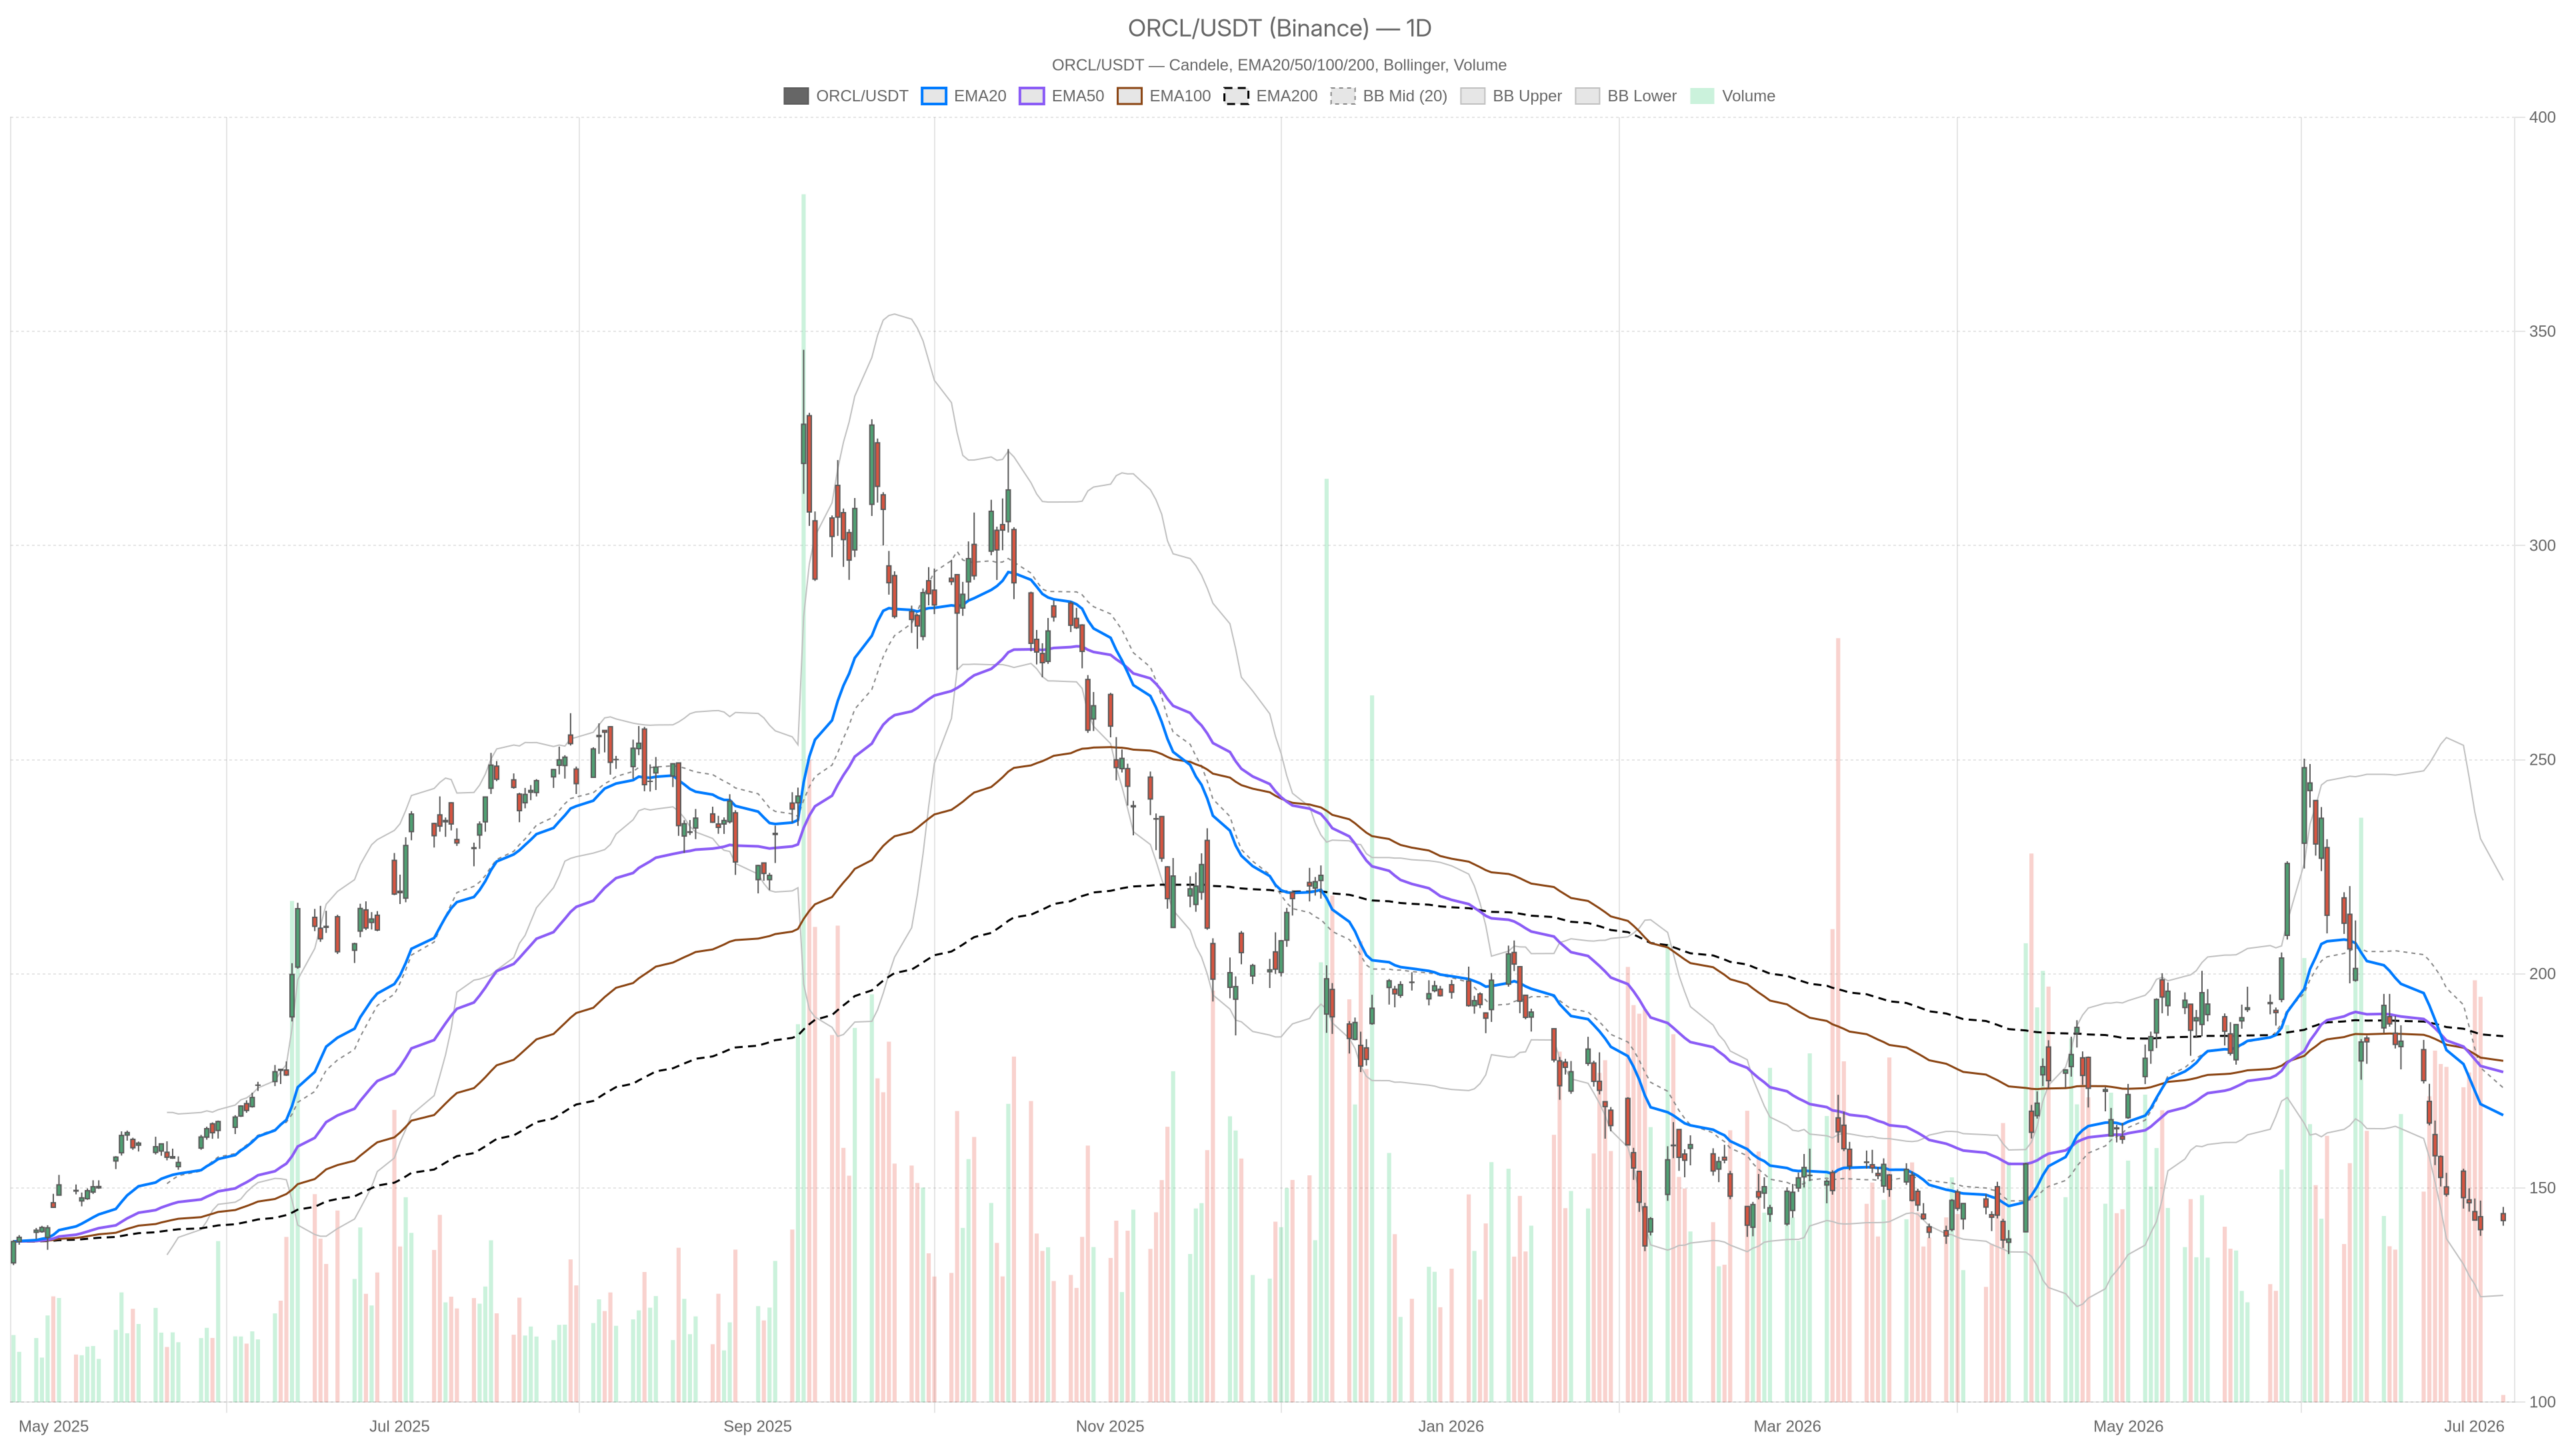
- Price trades well below all three daily EMAs — 20-day at $167, 50-day at $177, 200-day at $185 — defining a textbook bearish regime.
- Intraday 15-minute chart shows tentative stabilization, but no confirmed daily reversal signal exists yet.
- A daily close above $144.92 (R1) would be the first structural evidence of a potential trend shift.
Orcl Stock Daily Chart: A Textbook Bearish Regime
Orcl stock is locked in a textbook bearish regime. Price sits beneath all three major daily exponential moving averages, with each acting as a progressively stronger layer of overhead resistance.
In fact, the daily timeframe leaves no room for ambiguity. The 20-day EMA at $167, the 50-day EMA at $177, and the 200-day EMA at $185 stack in declining order. Price near $142 sits well below all three. A meaningful recovery would need to clear every single one of these levels before the broader bias could shift. Until that happens, the trend structure remains firmly bearish.
Oversold Signals and Momentum: Deteriorating Risk for Shorts
Daily momentum indicators confirm the bearish trend. However, they also signal that the risk-reward for aggressive short positions is now deteriorating rapidly.
At 28.78, the daily RSI sits firmly in oversold territory. This approaches the 30-level threshold that historically marks exhaustion in selling pressure. Crucially, however, this is not a contrarian buy signal on its own. In deeply damaged trends, RSI can remain depressed for extended periods. It does indicate that fading momentum blindly carries real risk.
Downward momentum, meanwhile, dominates the MACD picture. The MACD line at -14.83 sits well below the signal line at -10.57. This produces a negative histogram reading. No crossover, flattening, or divergence is visible. Momentum remains intact and continues accelerating on a macro basis.
Orcl Stock Volatility Context: Wide Bands and Elevated Risk
Volatility in Orcl stock has surged dramatically following the June selloff. Bollinger Band width and elevated ATR confirm the market has repriced uncertainty sharply higher.
The daily Bollinger Band midline sits at $173.39. The lower band stands at $124.93 and the upper band at $221.85. Price at $142.39 trades in the lower half of a very wide envelope. This extreme width directly reflects the violent June selloff. A mean-reversion toward the midline would require a move back toward $173. That level aligns with the EMA cluster resistance. It also represents a significant distance from current levels.
At the same time, the daily ATR at 8.14 confirms a still-elevated volatility environment. A single trading day can realistically cover an $8 range. Swing positions therefore require wider stops and smaller sizing.
Meanwhile, the daily pivot structure places support at $140.53 (S1) and resistance at $144.92 (R1). The pivot point sits at $143.05. Price currently oscillates just below the pivot. This makes today’s session a genuine pivot test for Orcl stock.
Intraday Timeframes: Early Signs of Stabilization
The hourly and 15-minute charts offer a more granular view. The 15-minute chart has shifted to neutral, hinting at tentative intraday stabilization in Orcl stock.
The hourly timeframe confirms the bearish bias but adds one fragile nuance. The 1H MACD histogram has flipped fractionally positive at +0.17. The MACD line at -2.63 narrows slightly toward the signal line at -2.79. This is a very early and fragile signal. It does not reverse the hourly trend. All three EMAs remain steeply stacked to the downside. Price sits well below the 200-hour EMA at $175.81. Still, the histogram shift hints that intraday selling pressure may be easing marginally. The 1H RSI at 36.5 remains weak but is not oversold. This leaves room for further hourly downside before a genuine bounce materializes.
On the 15-minute chart, however, the picture shifts notably. The regime has moved to neutral. RSI at 55 is above the midline, indicating short-term buying momentum. The 15m MACD histogram is positive at +0.40.
Price has climbed above the 15m EMA20 at $141.33 and is now testing the EMA50 at $142.62. The 15m Bollinger upper band at $142.40 marks where price is currently capped. A clean breakout above that level would open a short-term path toward the $142.94 R1 pivot. This is purely intraday context. Still, it suggests the session has found at least temporary footing.
Fundamental Ambition Meets Brutal Price Reality
Oracle’s fundamental story and Orcl stock’s price action tell sharply divergent narratives. The company’s AI infrastructure ambitions are massive, but the market has voted emphatically against the stock.
Oracle’s AI infrastructure buildout reflects genuine long-term ambition. OCI cloud revenue is reportedly up 93% year-over-year. The FY2027 revenue target of $90 billion underscores the scale of the vision. A third cohort within Oracle’s Defense Ecosystem signals continued strategic expansion. Piper Sandler’s rating reiteration provides at least a thin layer of analyst support.
However, the market has voted clearly. Investors question whether Oracle’s spending pace can generate returns fast enough to justify the valuation. June’s historic selloff was price discovery in action. In stark contrast to the long-term story, Orcl stock has lost a quarter of its value year-to-date. Cisco’s 46% gain against Oracle’s 25% decline illustrates the violent rotation. Even within the tech universe, the market has pulled away from ORCL decisively.
Orcl Stock Scenarios: Bullish and Bearish Paths Forward
Two distinct scenarios define the path ahead for Orcl stock. The bearish case remains the path of least resistance, but a bullish reversal has defined levels to watch.
Bullish Scenario
A bullish reversal requires a daily close above the $144.92 R1 level. This must be followed by a sustained reclaim of the $167 EMA20. That sequence would represent the first real structural evidence of a trend shift. If it unfolds alongside a narrowing daily MACD and an RSI climb back through 40, a short-term relief trade toward $155–$160 becomes plausible. Positive AI-related earnings revisions or a meaningful quarterly beat could serve as the fundamental catalyst.
Bearish Case
The bearish case, however, remains the path of least resistance. A failure to hold the $140.53 S1 support on a daily close would expose the lower Bollinger Band at $124.93. That becomes the next meaningful downside reference. All daily EMAs point south. MACD remains deeply negative. Any bounce that stalls below $150 should be treated as a dead-cat move until proven otherwise.
Overall, Orcl stock sits in a structurally damaged downtrend. No confirmed reversal signal exists on the daily timeframe. The daily RSI approaching oversold extremes and the early 15m stabilization are worth monitoring. But they represent timing signals rather than trend-change evidence. Positioning here demands discipline. The risk of catching a falling knife is real. Volatility remains elevated at over $8 per day. Any long exposure should be sized accordingly. The long-term AI thesis may ultimately prove compelling. However, the market has not yet decided when it wants to price that in.
FAQ
Is Orcl stock a buy right now?
No confirmed daily reversal signal exists. The daily RSI at 28.78 and oversold extremes suggest deteriorating risk-reward for shorts. However, with price below all major EMAs and MACD still deeply negative, there is no structural evidence of a trend shift. Waiting for a daily close above $144.92 R1 is prudent.
What are the key support and resistance levels for Orcl stock?
Key support sits at $140.53 (S1). A break below exposes the lower Bollinger Band at $124.93 as the next major downside reference. Resistance stands at $144.92 (R1). The 20-day EMA at $167 represents the first significant structural hurdle overhead.
Why did Orcl stock fall so sharply in June 2026?
The market turned sharply against Oracle despite its strong AI infrastructure narrative. Investors questioned whether the company’s spending pace could generate returns fast enough to justify its valuation. This triggered the worst monthly selloff since September 1990, with the stock shedding roughly 35%.
What would signal a genuine trend reversal in Orcl stock?
A daily close above $144.92, followed by a sustained reclaim of the $167 EMA20, would provide the first structural evidence of a trend shift. This would need to be accompanied by a narrowing MACD histogram and an RSI recovery back through the 40 level.
Disclaimer: This article is for informational purposes only and does not constitute financial advice, an investment recommendation, or a solicitation to buy or sell any financial instrument or cryptocurrency. The analysis provided is not indicative of future results. Investing in crypto assets and financial markets carries a high risk of capital loss. Always do your own research (DYOR) and consult a qualified financial advisor before making any decision.
Article produced with the assistance of artificial intelligence and reviewed by the editorial team.
