




Wulf stock surged after Anthropic signed a 20-year lease covering 401 MW at TeraWulf’s Kentucky campus. But beneath the bullish headlines, daily technicals are flashing caution. Here’s what the charts reveal about WULF‘s near-term direction.
Summary
Key takeaways
- Daily RSI at 44.99 signals fading momentum without reaching oversold territory.
- Daily MACD histogram sits at -0.71, reflecting building selling pressure beneath the surface.
- Wulf stock closed below both the daily pivot ($24.04) and the EMA20 at $25.23.
- A reclaim of $25.23 would shift the near-term bias materially for WULF.
- Daily ATR of 2.41 confirms elevated volatility and the need for careful position sizing.
Wulf Stock Daily Chart: Momentum Fades Below Key Moving Averages
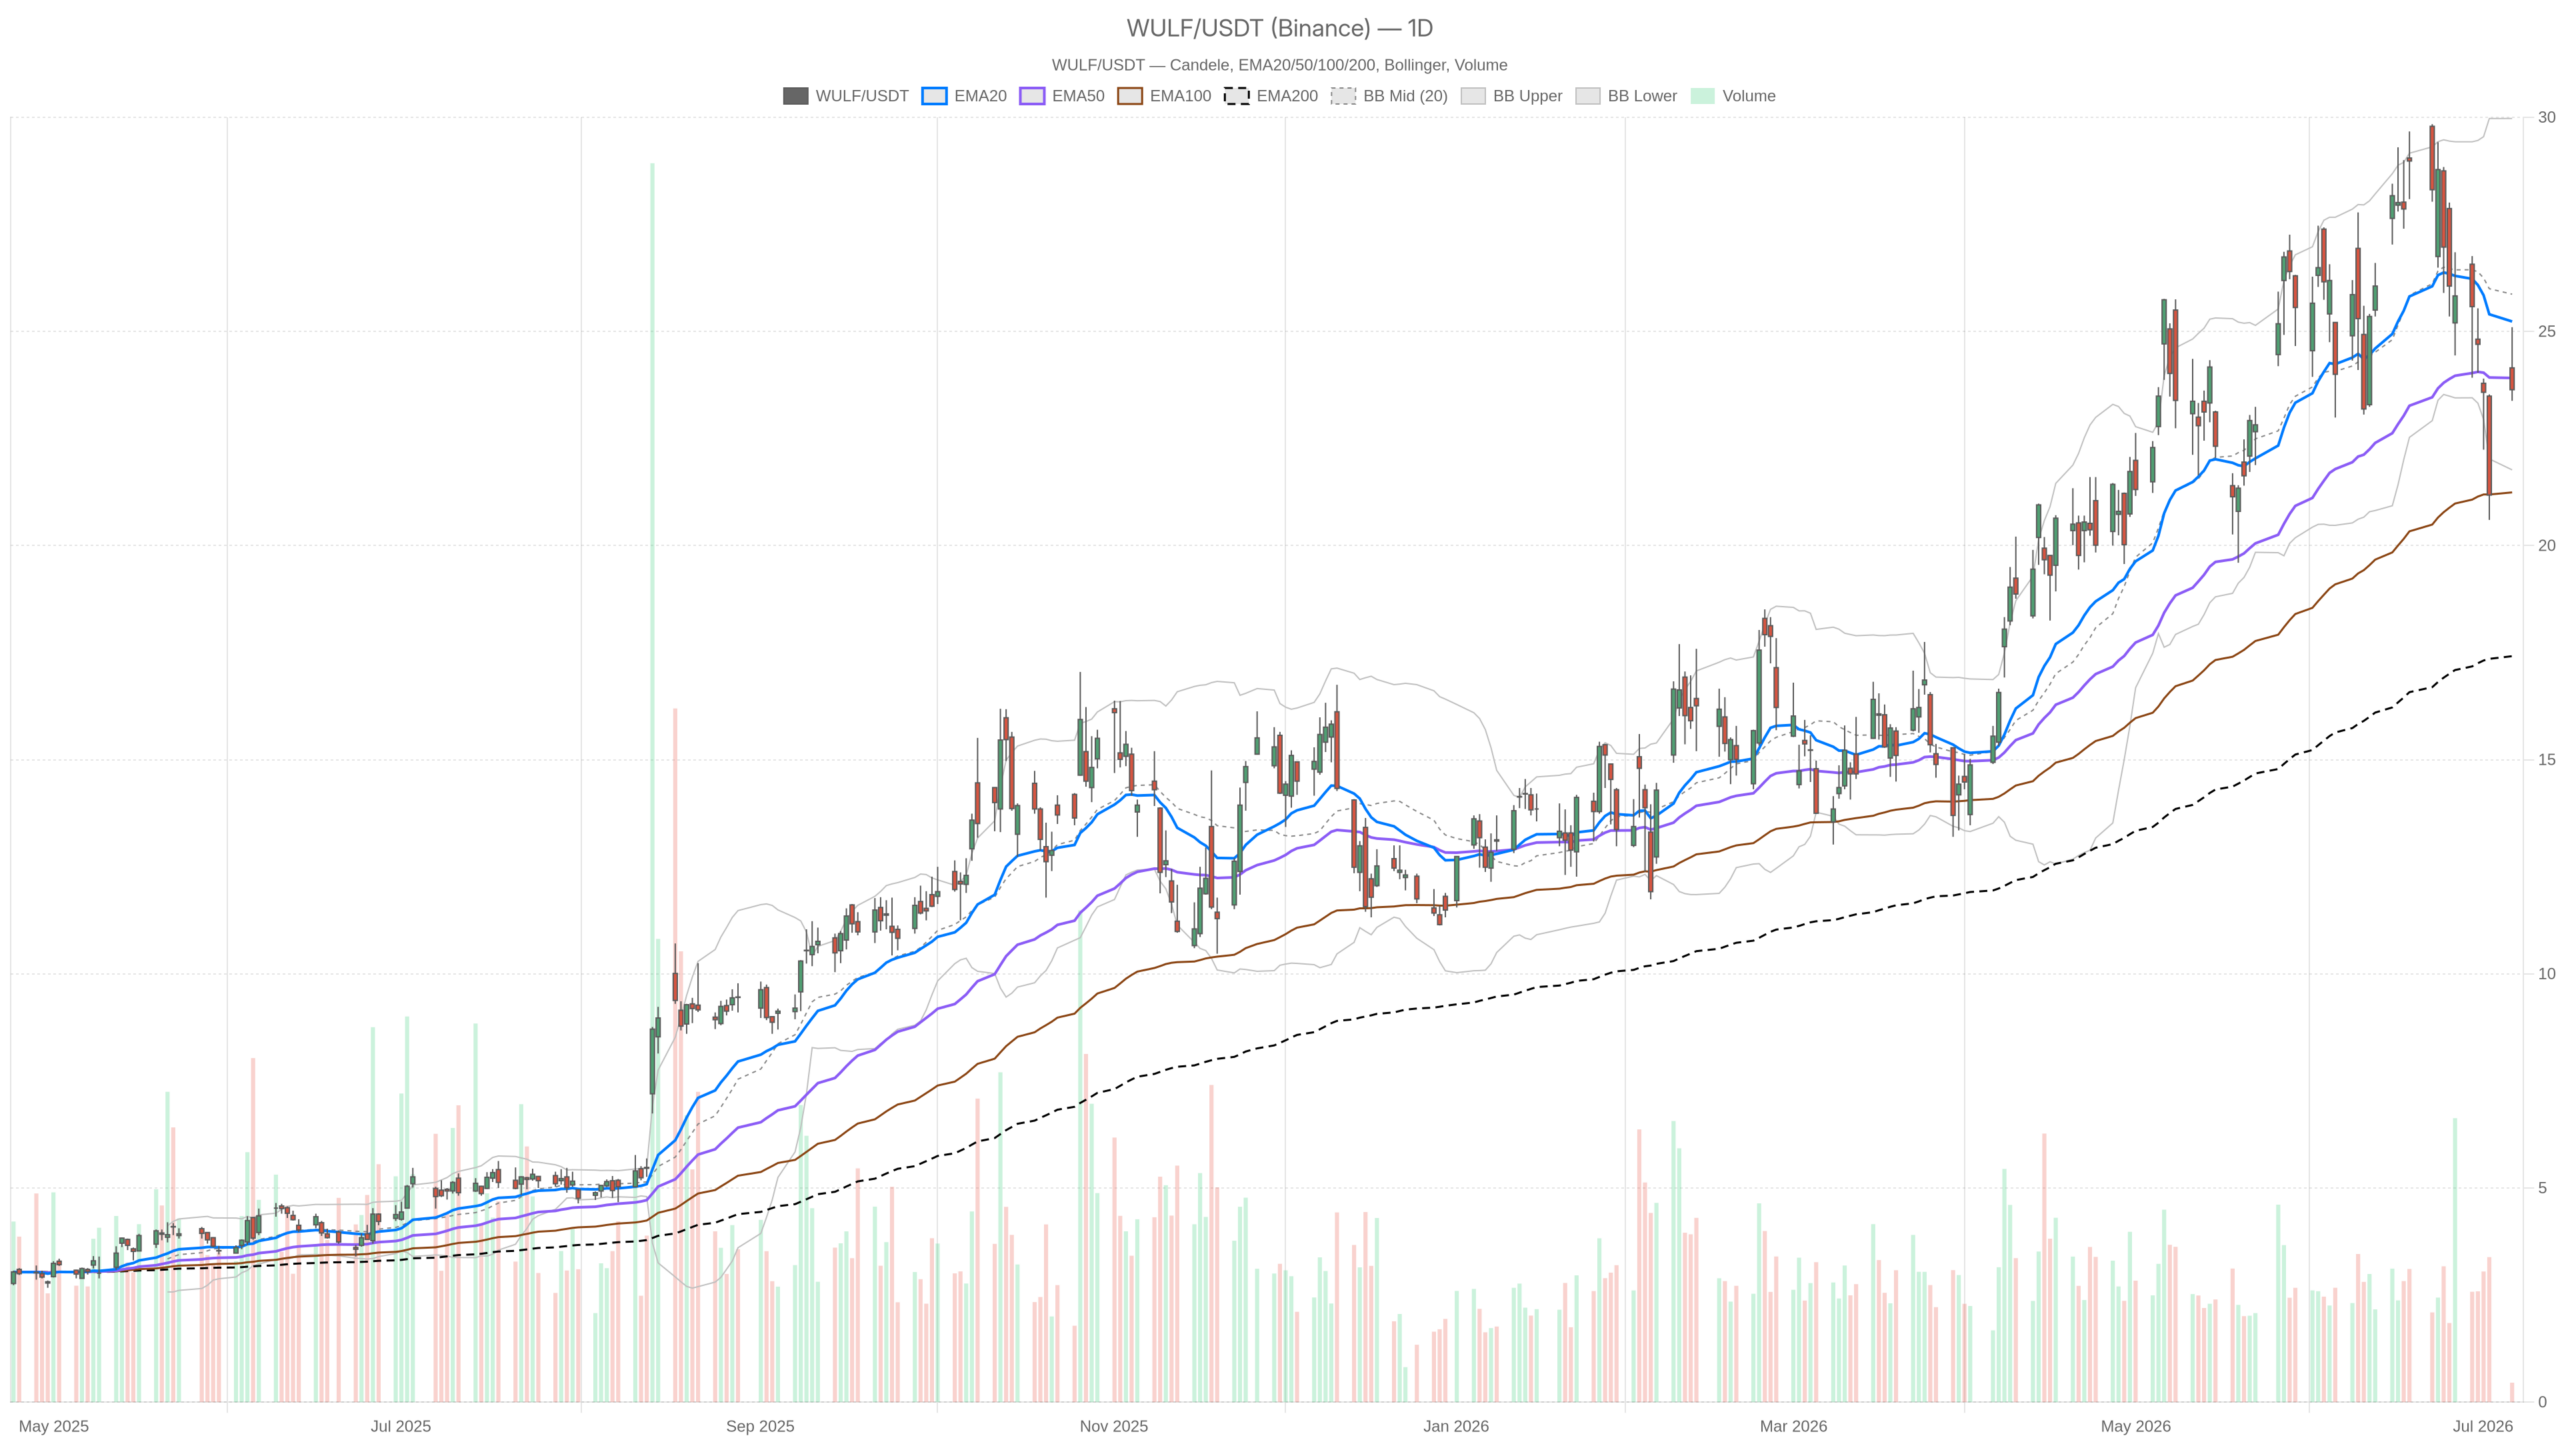
Wulf stock‘s daily chart shows a neutral regime with a soft bearish lean, as price failed to hold above the EMA20 at $25.23.
On July 6, WULF closed at $23.64 — well below its intraday high of $25.10. The rejection at the 20-day moving average is notable. Currently, price is sandwiched between the EMA50 at $23.91 and the lower end of the Bollinger Band structure. The mid-band sits at $25.87.
RSI and MACD Signal Building Pressure
The daily RSI at 44.99 sits just below the neutral 50 line, reflecting fading momentum without yet reaching oversold territory. Meanwhile, the MACD paints a more concerning picture. The line has crossed to -0.19 against a signal of +0.52, producing a histogram of -0.71.
In turn, that divergence shows sellers have been building pressure beneath the surface. Notably, this occurred even as Wulf stock attempted a push higher earlier in the session. Overall, the daily ATR of 2.41 confirms this is a high-volatility name. Intraday swings of $2 or more are the norm rather than the exception.
Support and Resistance Levels Define Near-Term Wulf Stock Bias
Wulf stock closed below its daily pivot of $24.04, which is a mild bearish signal for intraday positioning.
From a pivot perspective, resistance sits at R1 ($24.70) and support at S1 ($22.98). Therefore, a sustained break below S1 near $22.98 would open the door to a more significant retracement. On the upside, reclaiming the $24.70 R1 and then the EMA20 at $25.23 would shift the near-term tone.
Lower Timeframe Analysis for Wulf Stock
The 1-hour chart reinforces the bearish undertone, while the 15-minute chart offers the most constructive near-term signal — though it looks stretched.
Hourly Chart Confirms Overhead Resistance
The H1 EMA structure is inverted: Wulf stock trades above the EMA20 at $23.36 but well below both the EMA50 at $24.99 and the EMA200 at $25.39. Consequently, that downward stack of longer EMAs represents meaningful overhead resistance.
The hourly MACD line at -1.21 remains firmly negative. Although the histogram has narrowed to -0.08 — suggesting the selling impulse is losing some steam — there is no confirmed reversal yet. The H1 RSI of 48.23 echoes the daily: neutral, with no clear directional conviction.
15-Minute Chart Shows Short-Term Bounce
In contrast, the 15-minute chart offers a more constructive signal. Specifically, the short-term MACD histogram is a positive +0.44, with the MACD line at +0.33 crossing above its signal. However, the 15m RSI at 64.64 is approaching overbought conditions.
As a result, the intraday bounce may be running out of room. Price is pressing against the upper Bollinger Band on the 15m chart, which sits at $24.09 — close to the current session high. Traders looking to enter long positions should be cautious about chasing here.
Bullish Scenario: The Anthropic Catalyst for Wulf Stock
The bullish thesis for Wulf stock rests on a solid fundamental foundation, with the Anthropic lease validating the company’s pivot to AI infrastructure.
Meanwhile, Citi’s bullish view and a forward P/E of approximately 29.76 reflect genuine institutional interest. From a technical standpoint, a reclaim of the daily EMA20 at $25.23 — combined with a MACD crossover on the daily — would signal renewed upside momentum. The Bollinger Band upper level at $29.97 represents the next significant technical target. This aligns broadly with analyst price targets implying further upside from current levels. A daily close above $25.23 would change the near-term bias materially.
Bearish Risks for Wulf Stock Cannot Be Ignored
The bearish case for Wulf stock is equally compelling, driven by deeply negative daily momentum and fragile support levels.
At the same time, the daily MACD histogram sits at -0.71, and price is struggling to hold above the pivot. If sellers push WULF below the $22.98 S1 support on a closing basis, the next area of interest sits near the lower Bollinger Band at $21.77. In that scenario, the EMA50 at $23.91 would likely flip from support to resistance.
The broader trend anchor — the EMA200 at $17.42 — remains far below. This illustrates how extended Wulf stock remains on the longer-term chart despite the current consolidation. A macro risk-off environment or any delay in the Anthropic campus timeline could accelerate a retracement.
Overall Outlook: Patience Warranted on Wulf Stock
Wulf stock sits at a pivotal juncture where the fundamental catalyst is real, but daily momentum indicators point lower.
Overall, the long-term structure remains bullish given the massive AI infrastructure opportunity. Still, the 1-hour chart offers no confirmation of a reversal yet. However, the stock is digesting a sharp run-up, and that process may not be complete. Furthermore, volatility remains elevated with a daily ATR above $2.40, meaning position sizing matters significantly here.
Patience appears warranted. Waiting for the daily MACD to stabilize and price to reclaim the $25.23 EMA20 would offer a cleaner risk-reward entry — rather than betting on the current intraday bounce alone.
FAQ
What is driving Wulf stock higher?
The primary catalyst is the 20-year lease signed by Anthropic at TeraWulf’s Kentucky campus, covering 401 MW of AI infrastructure capacity with first power expected in late 2027. Citi has flagged 40% further upside potential following a nearly 500% surge over the past 12 months.
What are the key support levels for Wulf stock?
Key support sits at S1 ($22.98), followed by the lower Bollinger Band at $21.77. The EMA50 at $23.91 is also a critical level that could flip from support to resistance if broken on a closing basis.
Is Wulf stock a buy right now?
The daily chart shows fading momentum with a MACD histogram at -0.71 and RSI below 50. Waiting for price to reclaim the EMA20 at $25.23 would offer a cleaner risk-reward entry rather than chasing the current bounce.
What makes Wulf stock so volatile?
Wulf stock carries a daily ATR of 2.41, meaning intraday swings of $2 or more are common. This reflects both the high-growth AI infrastructure narrative and the stock’s crypto mining heritage, which amplifies price moves in both directions.
Disclaimer: This article is for informational purposes only and does not constitute financial advice, an investment recommendation, or a solicitation to buy or sell any financial instrument or cryptocurrency. The analysis provided is not indicative of future results. Investing in crypto assets and financial markets carries a high risk of capital loss. Always do your own research (DYOR) and consult a qualified financial advisor before making any decision.
Article produced with the assistance of artificial intelligence and reviewed by the editorial team.
