




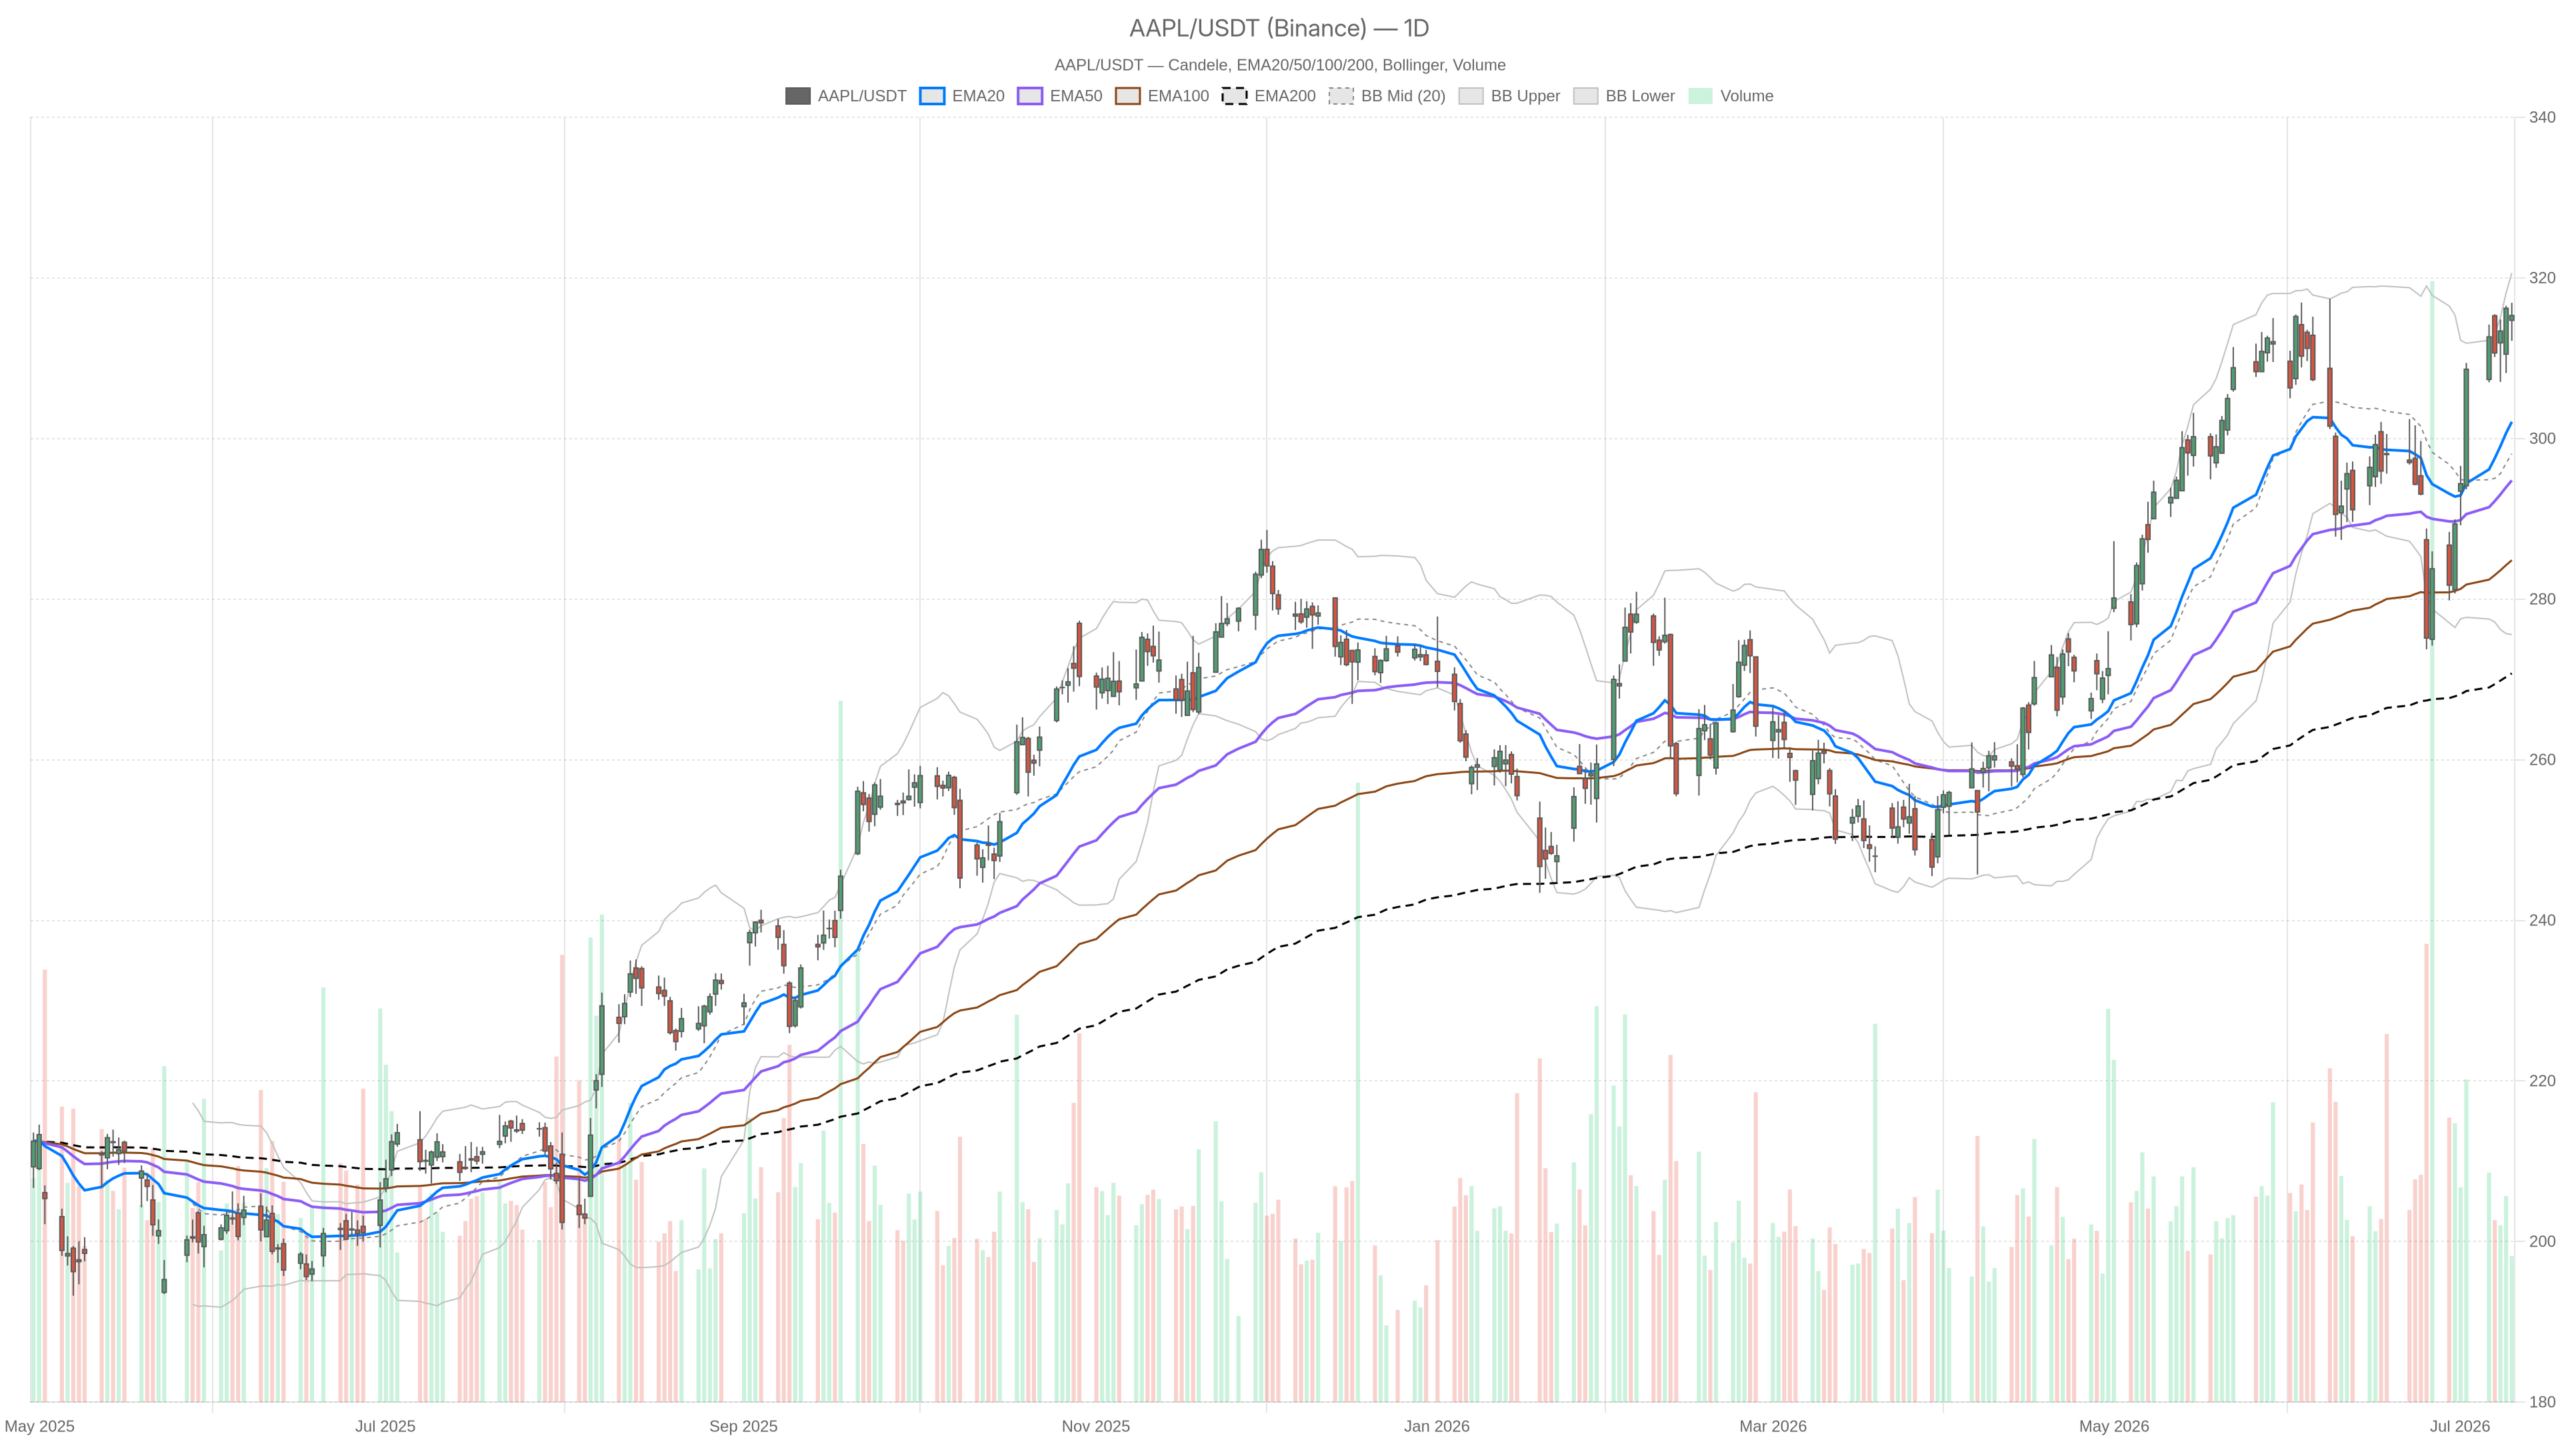
This AAPL stock analysis examines a bullish structure facing short-term hesitation. As of July 10, AAPL closed at $315.32 — firmly above all major moving averages. The trend is intact and well-supported, but the near-term path higher may require consolidation before the next leg.
Summary
Key takeaways
- AAPL closed at $315.32 on July 10, trading above its EMA20 at $302.08, EMA50 at $294.78, and EMA200 at $270.76.
- Daily RSI at 62.93 remains in bullish territory with room for further upside before overbought conditions.
- Hourly MACD shows a negative crossover (histogram at -0.32), signaling short-term momentum fatigue.
- The key near-term range sits between $312.69 support and $317.43 resistance.
- A daily close above $317.43 would confirm directional intent toward the Bollinger upper band near $320.61.
AAPL Stock Consolidates Strength at Elevated Levels
AAPL’s structural position remains firmly bullish, but short-term momentum indicators are flashing mild caution signals. The stock is trading from a position of strength, yet the hourly chart introduces enough hesitation to warrant attention. The core thesis is straightforward: the trend is intact and well-supported, but the next leg higher may not arrive without some consolidation first.
Daily Timeframe: The Bullish Foundation Remains Solid
The daily chart confirms an unambiguous uptrend, with AAPL trading above all three major EMAs and showing constructive momentum readings. Price sits well above the EMA20 at $302.08, the EMA50 at $294.78, and the EMA200 at $270.76. That full stack alignment — with price above all three — is one of the cleaner trend confirmations a chart can offer. It reflects a market where buyers have consistently dominated across every relevant time horizon.
Notably, the daily RSI at 62.93 sits comfortably in bullish territory without being dangerously overbought. This leaves meaningful room for further upside before any momentum exhaustion signal becomes credible. Meanwhile, the MACD reinforces this view. The line reads 4.61 against a signal of 1.89, with a histogram of 2.72. This wide, positive spread reflects sustained buying pressure rather than a fading rally.
Volatility context matters here too. The daily ATR of $8.95 tells us that daily swings of nearly $9 are normal for AAPL at this level. With the stock between pivot support at $312.69 and resistance at $317.43, the current range is well within one ATR of noise. That makes the $312–$317 zone the immediate battlefield. A daily close above $317.43 would confirm directional intent toward the Bollinger upper band near $320.61.
Hourly Chart: Confirmation Weakens Slightly
The hourly timeframe reveals the first signs of fatigue, with the MACD crossing bearishly even as price holds above key moving averages. Price remains above all three hourly EMAs — 313.77, 308.75, and 301.12 — confirming the bullish regime technically holds. The hourly RSI at 60.23 is also constructive, showing momentum without excess.
However, the divergence appears in the MACD. At the hourly level, the MACD line of 1.72 has crossed below its signal of 2.04, producing a histogram of -0.32. This negative crossover is a mild but real warning. It does not break the bullish case. But it does suggest the recent intraday push is losing short-term energy. Traders relying on hourly momentum for entry timing should treat this as a yellow flag, not a reversal signal.
At the same time, the hourly Bollinger Bands frame the stock near the top of the intraday range. The upper band sits at $316.97, the lower at $311.12. Price at $315.33 is close to the mid-to-upper zone. Historically, this implies limited immediate upside before mean-reversion pressure builds intraday.
15-Minute Chart: Short-Term Execution Context
The 15-minute chart shows the hourly MACD weakness has not yet cascaded into micro-structure breakdowns. At the micro level, the picture is more composed. The MACD histogram is slightly positive at 0.18, and RSI at 55.11 is balanced — neither stretched nor weak. The EMA stack on this frame is also aligned bullishly. In execution terms, short-term selling pressure from the hourly MACD cross has not fully filtered into the micro-structure. The $314.48 level represents the nearest intraday support per the 15-minute pivot, and that level has so far held.
AAPL Stock: Bullish Scenario and What Would Support It
The bullish case requires an hourly MACD recovery and a daily close above $317.43 to resume upward momentum toward $320.61. This scenario is well-supported by the prevailing structure. A recovery of the hourly MACD above its signal line would help. Combined with a daily close above $317.43 resistance, it would confirm renewed upward momentum. The next meaningful target is the daily Bollinger upper band near $320.61. Beyond that, broader analyst price targets come into view.
Fundamentally, the backdrop provides additional support. Apple’s shares are reportedly up 48.9% over the past year and 16.9% year-to-date. The recently announced $30 billion chip deal with Broadcom — part of Apple’s American Manufacturing Program — signals strategic investment in domestic production and supply chain control. Evercore ISI, as of late June, maintained a $365 price target on the stock. A broader $5 trillion market cap scenario discussed in recent coverage would imply continued price appreciation from current levels.
Bearish Scenario: What Would Invalidate the Bull Case
A daily close below $312.69 pivot support would mark the first structural crack in the bullish thesis. On the other hand, the bearish argument is not without teeth. A piece published this week argues that AI monetization at Apple remains weak. Rising iPhone costs could also weigh on growth. The author calls AAPL a sell at current levels. The stock is also trading near the upper boundary of its daily Bollinger Band at $320.61 — an area that historically attracts mean-reversion selling.
In contrast to the bullish setup, a sustained breakdown through the EMA20 at $302.08 would be more serious than a simple pivot violation. That would shift the daily regime from clearly bullish to uncertain. The daily ATR of $8.95 means such a move is entirely possible in a single volatile session. Proximity to that level therefore matters.
Positioning Into Uncertainty
AAPL sits at a decision point between support and resistance, where the next daily close carries significant directional weight. Overall, AAPL’s technical structure remains constructive. The daily regime is firmly bullish and momentum is broadly aligned. The wrinkle is the hourly MACD divergence. It suggests the short-term path of least resistance may be sideways-to-slightly-lower before the next directional push. Volatility, as measured by the daily ATR, remains elevated enough to produce sharp moves in either direction. The stock is essentially at a decision point — between $312.69 support and $317.43 resistance. Prudent positioning acknowledges the bullish trend. Yet near all-time highs and approaching the Bollinger upper band, the margin for error narrows.
FAQ
Is AAPL stock bullish or bearish right now?
AAPL’s daily structure is firmly bullish — price sits above all three major EMAs with an RSI of 62.93. However, the hourly MACD shows a negative crossover, suggesting short-term hesitation. The trend is intact but may require consolidation before the next leg higher.
What are the key support and resistance levels for AAPL?
Immediate support sits at $312.69 (pivot), with the EMA20 at $302.08 serving as a more significant floor. Resistance stands at $317.43, with the Bollinger upper band at $320.61 as the next upside target.
What would invalidate the bullish case for Apple stock?
A daily close below $312.69 pivot support would mark the first structural crack. A sustained breakdown through the EMA20 at $302.08 would shift the daily regime from clearly bullish to uncertain.
What is the analyst price target for AAPL?
Evercore ISI maintained a $365 price target on AAPL as of late June. A broader $5 trillion market cap scenario discussed in recent coverage would imply further upside from current levels.
Disclaimer: This article is for informational purposes only and does not constitute financial advice, an investment recommendation, or a solicitation to buy or sell any financial instrument or cryptocurrency. The analysis provided is not indicative of future results. Investing in crypto assets and financial markets carries a high risk of capital loss. Always do your own research (DYOR) and consult a qualified financial advisor before making any decision.
Article produced with the assistance of artificial intelligence and reviewed by the editorial team.
