



Disney stock closed Friday at $96.19, trapped below all key daily moving averages in a bearish stack ahead of the August 5 Q3 earnings release. The technical picture leans clearly bearish, even as Disney finalizes its $1 billion-plus A+E Networks stake sale to Hearst.
Summary
Key takeaways
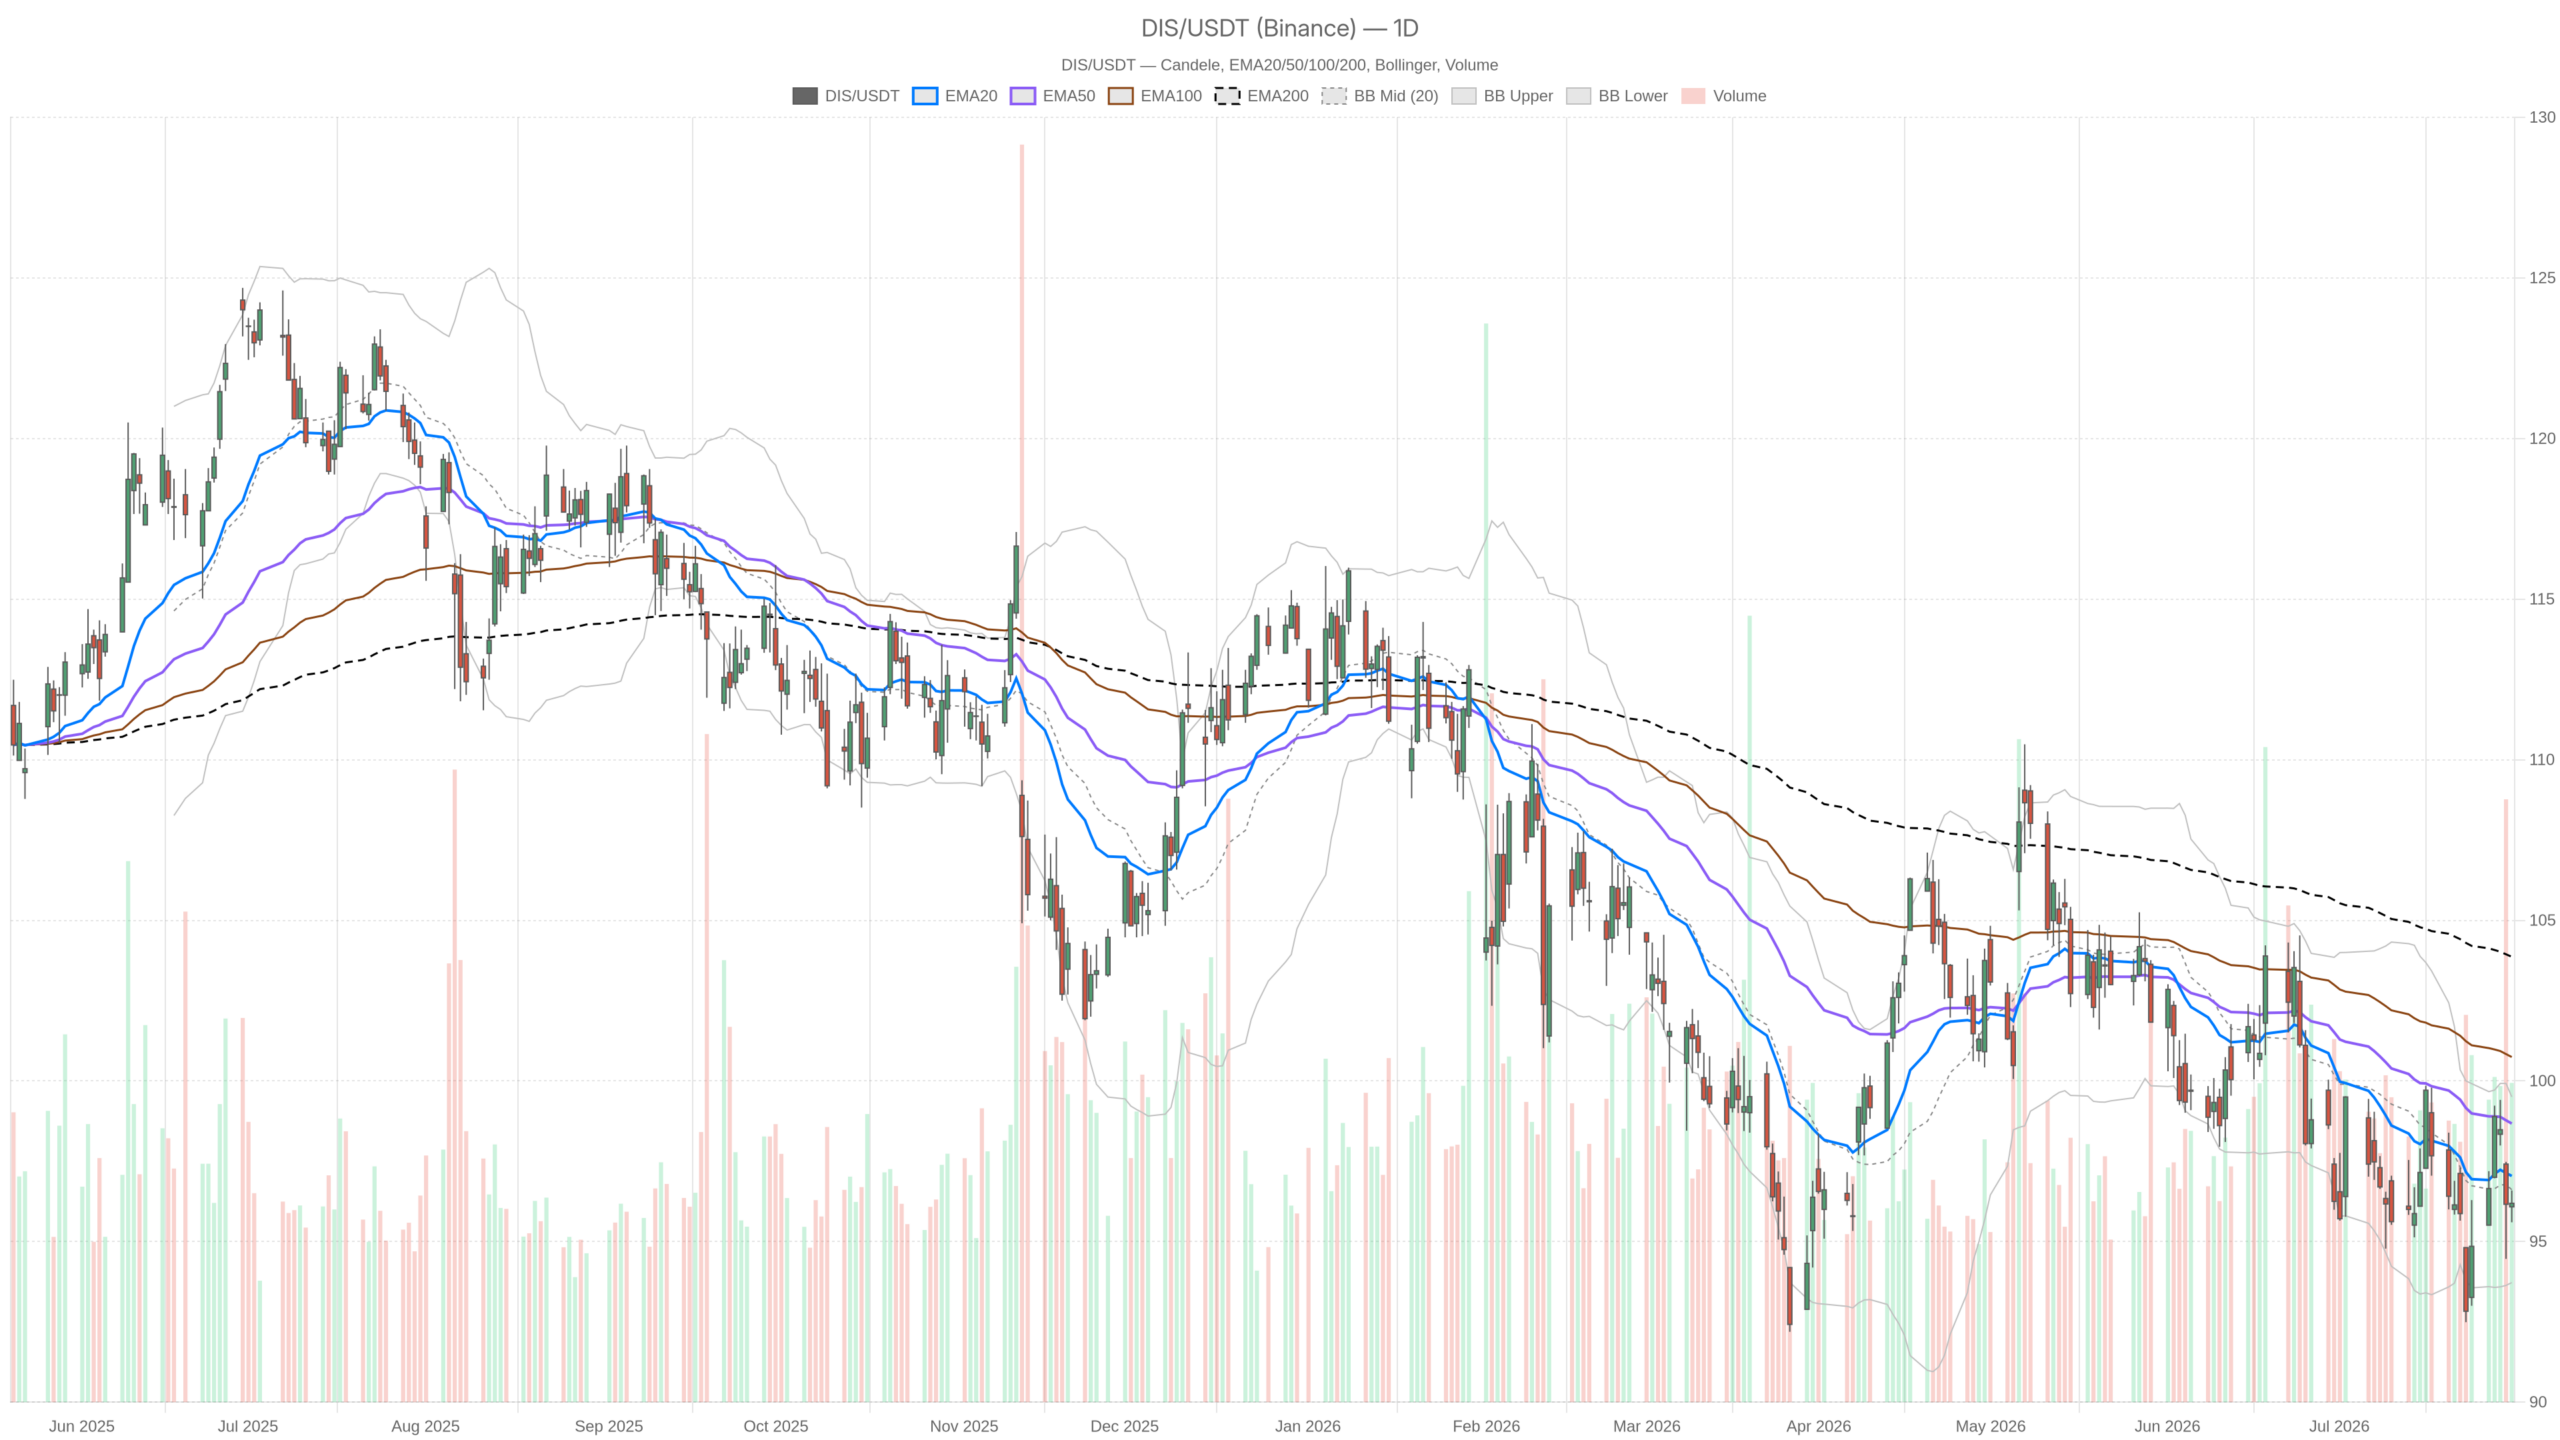
- Disney stock closed at $96.19, below the 20-day EMA ($97.04), 50-day EMA ($98.67), and 200-day EMA ($103.87).
- Daily RSI sits at 46.34, with the MACD line at -0.69 below its signal line, confirming bearish momentum.
- Q3 earnings land August 5, coinciding with the closing of the $1 billion-plus A+E Networks stake sale to Hearst.
- The daily ATR of 2.31 signals capacity for meaningful post-earnings price swings.
- A bullish reversal requires reclaiming the daily EMA20 near $97.04; a break below $95.66 would reinforce the bearish case.
Daily Momentum Signals for Disney Stock
Disney stock’s daily momentum indicators uniformly confirm bearish control, with no divergence hinting at an imminent trend reversal. RSI on the daily timeframe sits at 46.34, a neutral-to-soft reading that confirms momentum has faded rather than strengthened. Meanwhile, the daily MACD line at -0.69 remains below its signal line at -0.92, keeping the broader bias tilted negative. However, the histogram has ticked up to 0.23 — a small but notable sign that downside momentum may be losing some force even as the trend itself stays intact.
Bollinger Bands and Pivots Frame the Near-Term Range
The Bollinger Bands add further context. With the mid-band at $96.61 and price closing at $96.19, Disney stock trades just below the midpoint of its recent volatility range. That range is bounded by an upper band near $99.50 and a lower band around $93.72. Daily ATR reads 2.31, pointing to a market still capable of meaningful daily swings — a relevant detail given the earnings catalyst just ahead. On the pivot front, the daily pivot point at $96.13 sits almost exactly at Friday’s close. Resistance at $96.65 and support at $95.66 frame a tight near-term battleground.
Hourly Chart Reinforces the Bearish Disney Stock Outlook
The 1-hour chart reinforces Disney stock’s bearish bias, with price below all key hourly EMAs and the regime reading matching the daily signal. Price at $96.22 remains under the 1H EMA20 ($96.51), EMA50 ($96.65), and EMA200 ($97.54). The regime label here is also bearish. RSI on the 1H sits at 45.8, closely mirroring the daily reading and confirming momentum lacks conviction in either direction. The 1H MACD histogram is slightly negative at -0.04, with the MACD line at -0.28 below the signal at -0.23 — a subtle but consistent bearish tilt.
Therefore, the daily and hourly timeframes are broadly aligned. This alignment strengthens the overall bearish case rather than complicating it. The 1H pivot at $96.25, with resistance at $96.36 and support at $96.10, shows just how narrow the current trading range has become. Such compression often precedes a directional move once a catalyst arrives — and here, that catalyst is clearly the upcoming earnings report.
15-Minute Chart Shows Short-Term Disney Stock Pause
The 15-minute chart shows Disney stock in neutral territory, with compressed volatility signaling a pre-earnings pause rather than any reversal attempt. On this timeframe, the regime is labeled neutral rather than bearish. RSI sits at 51.15, and the MACD histogram reads a marginally positive 0.02. Price at $96.22 trades just above the 15m EMA20 at $96.18, though it remains below the EMA50 ($96.34) and EMA200 ($96.75). Notably, this suggests short-term stabilization within the broader downtrend, not a meaningful reversal signal. The 15m ATR of 0.20 confirms that intraday volatility has compressed considerably, consistent with a market pausing ahead of a known event.
What a Bullish Disney Stock Reversal Requires
For Disney stock to stage a bullish reversal, price must reclaim the daily EMA20 near $97.04 and hold above pivot resistance at $96.65 with conviction. On the news side, several outlets have flagged that Wall Street remains cautiously optimistic despite recent softness. Analysts have dialed back expectations ahead of earnings while still seeing upside potential. Coverage from Motley Fool specifically noted that positive figures from two key areas in the August 5 report could send the stock higher. If Disney delivers on those metrics, a move back toward the daily Bollinger mid-band at $96.61 becomes realistic. The next target would be the upper band near $99.50. Completing the Hearst transaction, which values the A+E stake at more than $1 billion, could also be read as a modest positive if it signals continued portfolio streamlining around earnings.
What Keeps the Bearish Disney Stock Case Dominant
The bearish case for Disney stock remains the path of least resistance while price stays below the daily EMA20 and EMA50. A break under daily support at $95.66 would confirm sellers remain in control. That signal strengthens if RSI readings stay below 50 across both daily and hourly timeframes. Notably, Disney shares were already tracking a potential third consecutive monthly decline, with losses in May and June and roughly flat performance in July. Any disappointment in the Q3 earnings metrics could easily reopen a path toward the lower Bollinger band near $93.72. In contrast to the mild optimism reflected in some analyst commentary, the technical structure alone offers no confirmation of a trend reversal yet.
Disney Stock Positioning Ahead of Earnings
Disney stock enters earnings week caught between a clearly bearish daily structure and a compressed, neutral short-term chart. That divergence is not necessarily contradictory. It simply reflects a market holding its breath ahead of the August 5 report and the simultaneous closing of the Hearst A+E transaction. Volatility, as measured by the daily ATR near 2.31, suggests price could move meaningfully in either direction once results land. Positioning into this event carries real uncertainty. Traders should weigh the technical bearish bias against the more constructive tone found in recent analyst commentary before drawing conclusions about where Disney stock heads next.
FAQ
What is the technical outlook for Disney stock ahead of Q3 earnings?
The daily and hourly charts show a bearish structure. Price at $96.19 sits below all key exponential moving averages. RSI at 46.34 and the MACD line below its signal confirm bearish momentum. No reversal signal has emerged yet.
What price levels matter most for Disney stock?
Key resistance sits at the daily EMA20 near $97.04 and pivot resistance at $96.65. Key support rests at $95.66. The lower Bollinger band near $93.72 marks the next bearish target if support fails.
What catalysts could move Disney stock?
The August 5 Q3 earnings report is the primary catalyst. The simultaneous closing of Disney’s $1 billion-plus A+E Networks stake sale to Hearst adds a secondary corporate event that could influence near-term price action.
Disclaimer: This article is for informational purposes only and does not constitute financial advice, an investment recommendation, or a solicitation to buy or sell any financial instrument or cryptocurrency. The analysis provided is not indicative of future results. Investing in crypto assets and financial markets carries a high risk of capital loss. Always do your own research (DYOR) and consult a qualified financial advisor before making any decision.
Article produced with the assistance of artificial intelligence and reviewed by the editorial team.
