




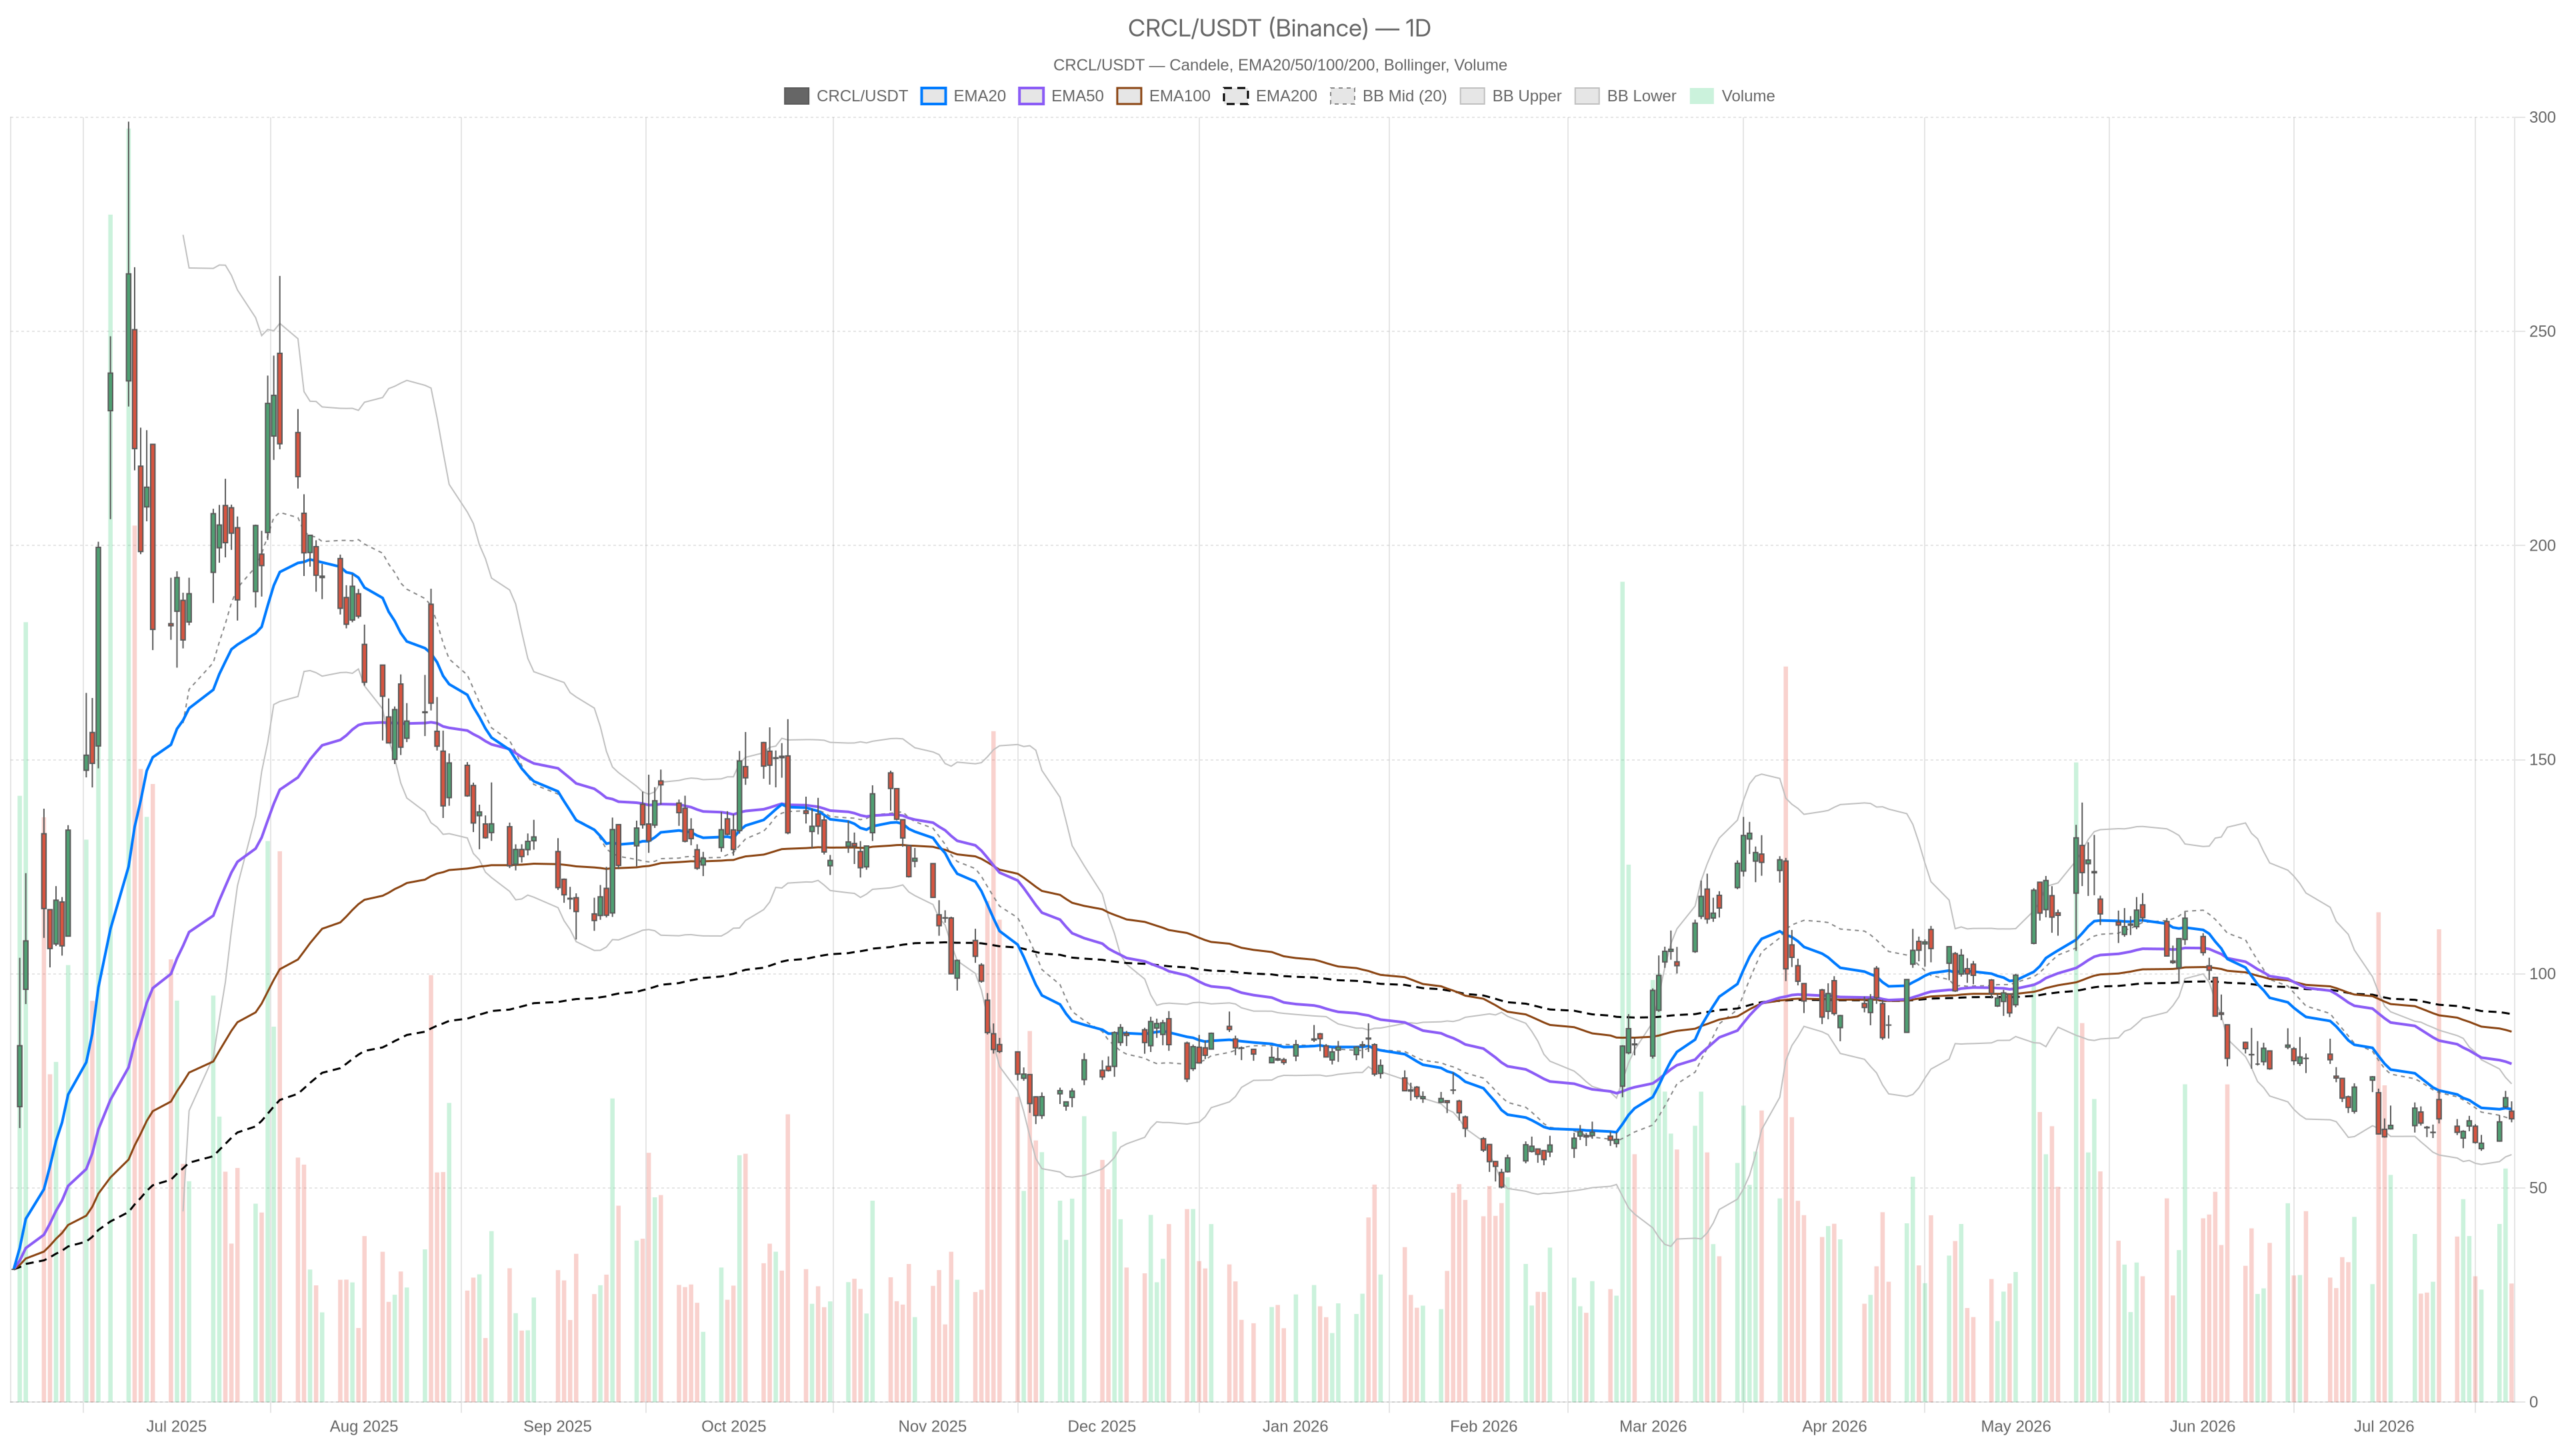
Circle Stock faces meaningful pressure. CRCL closed at $66.16 on July 22 — well below its short-term moving averages. The daily trend is bearish and momentum remains weak. Yet a notable institutional buyer and stabilizing short-term structure hint at a potential rebound, creating genuine tension in the technical outlook.
Summary
Key takeaways
- CRCL closed at $66.16 on July 22, trading below all three daily EMAs in a clearly bearish regime.
- The daily ATR of $5.37 signals elevated volatility, meaning intraday price swings can be violent.
- Ark Invest’s Cathie Wood added $14 million worth of Circle Stock this week across three ETFs.
- Daily support sits at $64.26, while a close above the pivot at $67.25 is needed to challenge the bearish thesis.
- Insider selling by Circle’s President exceeds $30 million since the IPO, adding to market skepticism.
Circle Stock Daily Trend: Bearish Regime Stays in Control
The daily chart leaves little room for interpretation. Circle Stock is in a confirmed bearish regime. Price closed at $66.16 on July 22, sitting beneath all three key exponential moving averages with wide gaps between them. The intraday range spanned $65.35 to $70.23 — a nearly five-dollar spread that reflects elevated volatility in the current structure.
EMA Stack Confirms Sustained Downtrend
Notably, the EMA20 at $68.41, EMA50 at $78.99, and EMA200 at $90.61 are stacked in perfect bearish alignment. Price trades beneath all three. The gaps between these averages are wide. This confirms a sustained downtrend rather than a brief pullback within a broader uptrend. There is no compression near a key average — only clean bearish separation.
Meanwhile, the daily RSI14 reads 44.49. It sits below the neutral 50 line but has not yet reached oversold extremes. In a bearish regime, RSI tends to hover in the 30–50 band without generating meaningful reversal signals. At current levels, momentum offers no natural floor.
Momentum Signals and Key Price Levels
The MACD tells a more nuanced story, however. The MACD line stands at -4.9 against a signal of -6.44, producing a histogram of +1.54. The histogram is positive and expanding. This means the gap between the MACD line and its signal is closing from the downside. It is not a bullish crossover. Still, it indicates the rate of bearish deterioration is slowing.
Bollinger Bands place the midline at $66.06, with the upper band at $74.33 and the lower band at $57.80. CRCL trades near the midline after bouncing from the lower portion of the band. Yet given the bearish regime, the bias still favors continuation toward the lower band over a push to the upper extreme.
The daily pivot sits at $67.25, with resistance at $69.14 and support at $64.26. CRCL closed below the pivot. That places it in technically weak territory heading into the next session. The $64.26 level stands as the key downside reference.
Hourly Chart Offers Tentative Stabilization for CRCL
The hourly chart shifts the picture from bearish to neutral — and that divergence matters. CRCL’s hourly close registered $66.20 with a neutral regime classification. This weakens, but does not reverse, the daily bearish thesis. Short-term price action is showing early signs of stabilization.
Notably, the hourly EMA50 at $65.87 sits below current price. That means CRCL has reclaimed this shorter-term average — a modest but real sign of near-term stability. The EMA20 at $67.08 remains just overhead, acting as near-term resistance. The EMA200 at $72.33 is far above and largely irrelevant for short-term positioning.
The hourly RSI14 at 47.99 is nearly neutral. It reflects a market that is neither oversold nor showing real buying conviction. In contrast to the daily, the hourly is not in outright bearish momentum territory. This explains the neutral regime reading.
However, the hourly MACD adds a complication. It shows the MACD line at +0.71 against a signal of +1.27, producing a negative histogram of -0.56. It recently crossed positive territory but is now rolling back below its signal. This represents a failed momentum push — bulls tried to drive higher and stalled. It limits conviction in any near-term recovery attempt.
The hourly pivot is $65.93, with resistance at $66.50 and support at $65.62. CRCL trades almost exactly at $66.20 — between the pivot and R1. Breaking and holding $66.50 would be a constructive near-term development. Slipping back below $65.62 would quickly reaffirm the downside path.
On the 15-minute chart, meanwhile, the RSI14 stands at 38.6 — approaching oversold territory. The EMA200 at $65.68 sits below price, while shorter averages remain overhead. This setup hints at short-term exhaustion in selling pressure. For traders timing entries, the immediate downside may be limited, though a clear catalyst would be needed to drive meaningful upside.
Fundamental Pressures Reinforce the Bearish Thesis
The technical picture does not exist in isolation. Circle Stock’s fundamental backdrop carries a collection of real risks that reinforce the bearish regime visible on the charts. These are structural concerns, not temporary sentiment shifts.
Earlier this month, CRCL received a downgrade and a Street-low price target. Analysts cited intensifying competition in the stablecoin space. JPMorgan also flagged near-term revenue pressure following a revised partnership between Circle and crypto exchange Hyperliquid. The new arrangement changes how USDC income is distributed to partners. Less favorable revenue-sharing directly affects the earnings outlook.
On top of that, Visa announced backing for Open USD — a rival stablecoin platform. The news caused both CRCL and COIN to drop. Visa’s entrance into this space brings infrastructure allowing banks and fintechs to issue their own stablecoins. This represents a credible threat to USDC’s market positioning.
Adding a further layer of concern, Circle’s President Heath Tarbert has sold over $30 million in CRCL shares since the IPO. Regulatory filings describe the activity as routine. Still, the scale of insider selling is notable and contributes to market skepticism around near-term price recovery.
Cathie Wood’s Bet Fuels the Bullish Case for Circle Stock
Not all signals point lower. Ark Invest’s Cathie Wood added another $14 million worth of Circle Stock this week, building on existing positions across three of the firm’s ETFs. That is a meaningful institutional vote of confidence. It signals that at current levels, at least one prominent growth investor sees value in CRCL.
From a technical standpoint, the daily MACD histogram turning positive — even marginally — gives bulls a data point to lean on. If this divergence between price weakness and slowing downside momentum continues to develop, a short-term relief rally becomes plausible. The first target would be the daily pivot at $67.25, followed by R1 at $69.14.
For the bullish scenario to gain credibility, CRCL would need to reclaim the daily pivot at $67.25 on a closing basis. A test of the EMA20 at $68.41 would follow. Sustained volume above those levels, combined with stabilization in the competitive narrative, would begin to shift the daily regime. The Bollinger upper band at $74.33 represents the longer-term target if that scenario unfolds.
Bearish Scenario for Circle Stock: Support Breakdown Opens Further Downside
The invalidation of any bullish recovery is straightforward. A break below daily support at $64.26 would reaffirm the downtrend. It would open the path toward the Bollinger lower band at $57.80. The EMA50 at $78.99 and EMA200 at $90.61 are so far above current price that they provide no near-term support. They function as distant targets, not floors.
In contrast to the Ark purchase, the negative catalyst stack remains formidable. A high-profile downgrade, JPMorgan’s revenue warnings, Visa’s competitive entry, and significant insider selling represent real business model pressures. These are not sentiment issues. The market is still in the process of pricing them in.
Therefore, any rally that fails to close above $67.25 on a sustained basis should be treated with skepticism. The MACD histogram improvement on the daily is encouraging. Yet it is not sufficient to declare the trend turning. The burden of proof remains firmly on the bulls.
Positioning Outlook: Elevated Volatility Demands Caution
Overall, Circle Stock remains in a bearish daily regime with neutral short-term conditions. The daily ATR of $5.37 means that even a bounce could look convincing while still occurring within a broader downtrend. Traders should be careful not to confuse intraday range with directional confirmation.
The next few sessions will be instructive. A close above the daily pivot at $67.25, ideally accompanied by volume recovery, would suggest the bulls are finding their footing. Failure to hold $65.62 — the hourly support level — would likely accelerate selling toward the $64.26 daily floor. Until the daily regime shifts from bearish to at least neutral, caution remains the appropriate default stance.
FAQ
What is the current trend for Circle Stock?
Circle Stock is in a bearish daily regime. CRCL closed at $66.16 on July 22, below all three daily EMAs. The EMA20 sits at $68.41, the EMA50 at $78.99, and the EMA200 at $90.61. The wide gaps confirm a sustained downtrend rather than a temporary pullback.
What are the key support and resistance levels for CRCL?
The daily pivot sits at $67.25, with support at $64.26 and resistance at $69.14. On the hourly chart, support is at $65.62 and resistance at $66.50. The Bollinger lower band at $57.80 represents a deeper downside target if the bearish trend accelerates.
Why did Cathie Wood buy Circle Stock this week?
Ark Invest’s Cathie Wood added $14 million worth of Circle Stock across three ETFs this week. This signals institutional confidence at current price levels. The daily MACD histogram turning positive supports the view that bearish momentum may be slowing, creating a potential entry opportunity for contrarian investors.
What fundamental risks does Circle Stock face?
CRCL faces intensifying competition in the stablecoin space. Visa backed rival platform Open USD. An analyst downgrade with a Street-low price target and JPMorgan’s warning about revised USDC revenue-sharing with Hyperliquid add pressure. Additionally, Circle’s President has sold over $30 million in shares since the IPO.
Disclaimer: This article is for informational purposes only and does not constitute financial advice, an investment recommendation, or a solicitation to buy or sell any financial instrument or cryptocurrency. The analysis provided is not indicative of future results. Investing in crypto assets and financial markets carries a high risk of capital loss. Always do your own research (DYOR) and consult a qualified financial advisor before making any decision.
Article produced with the assistance of artificial intelligence and reviewed by the editorial team.
