




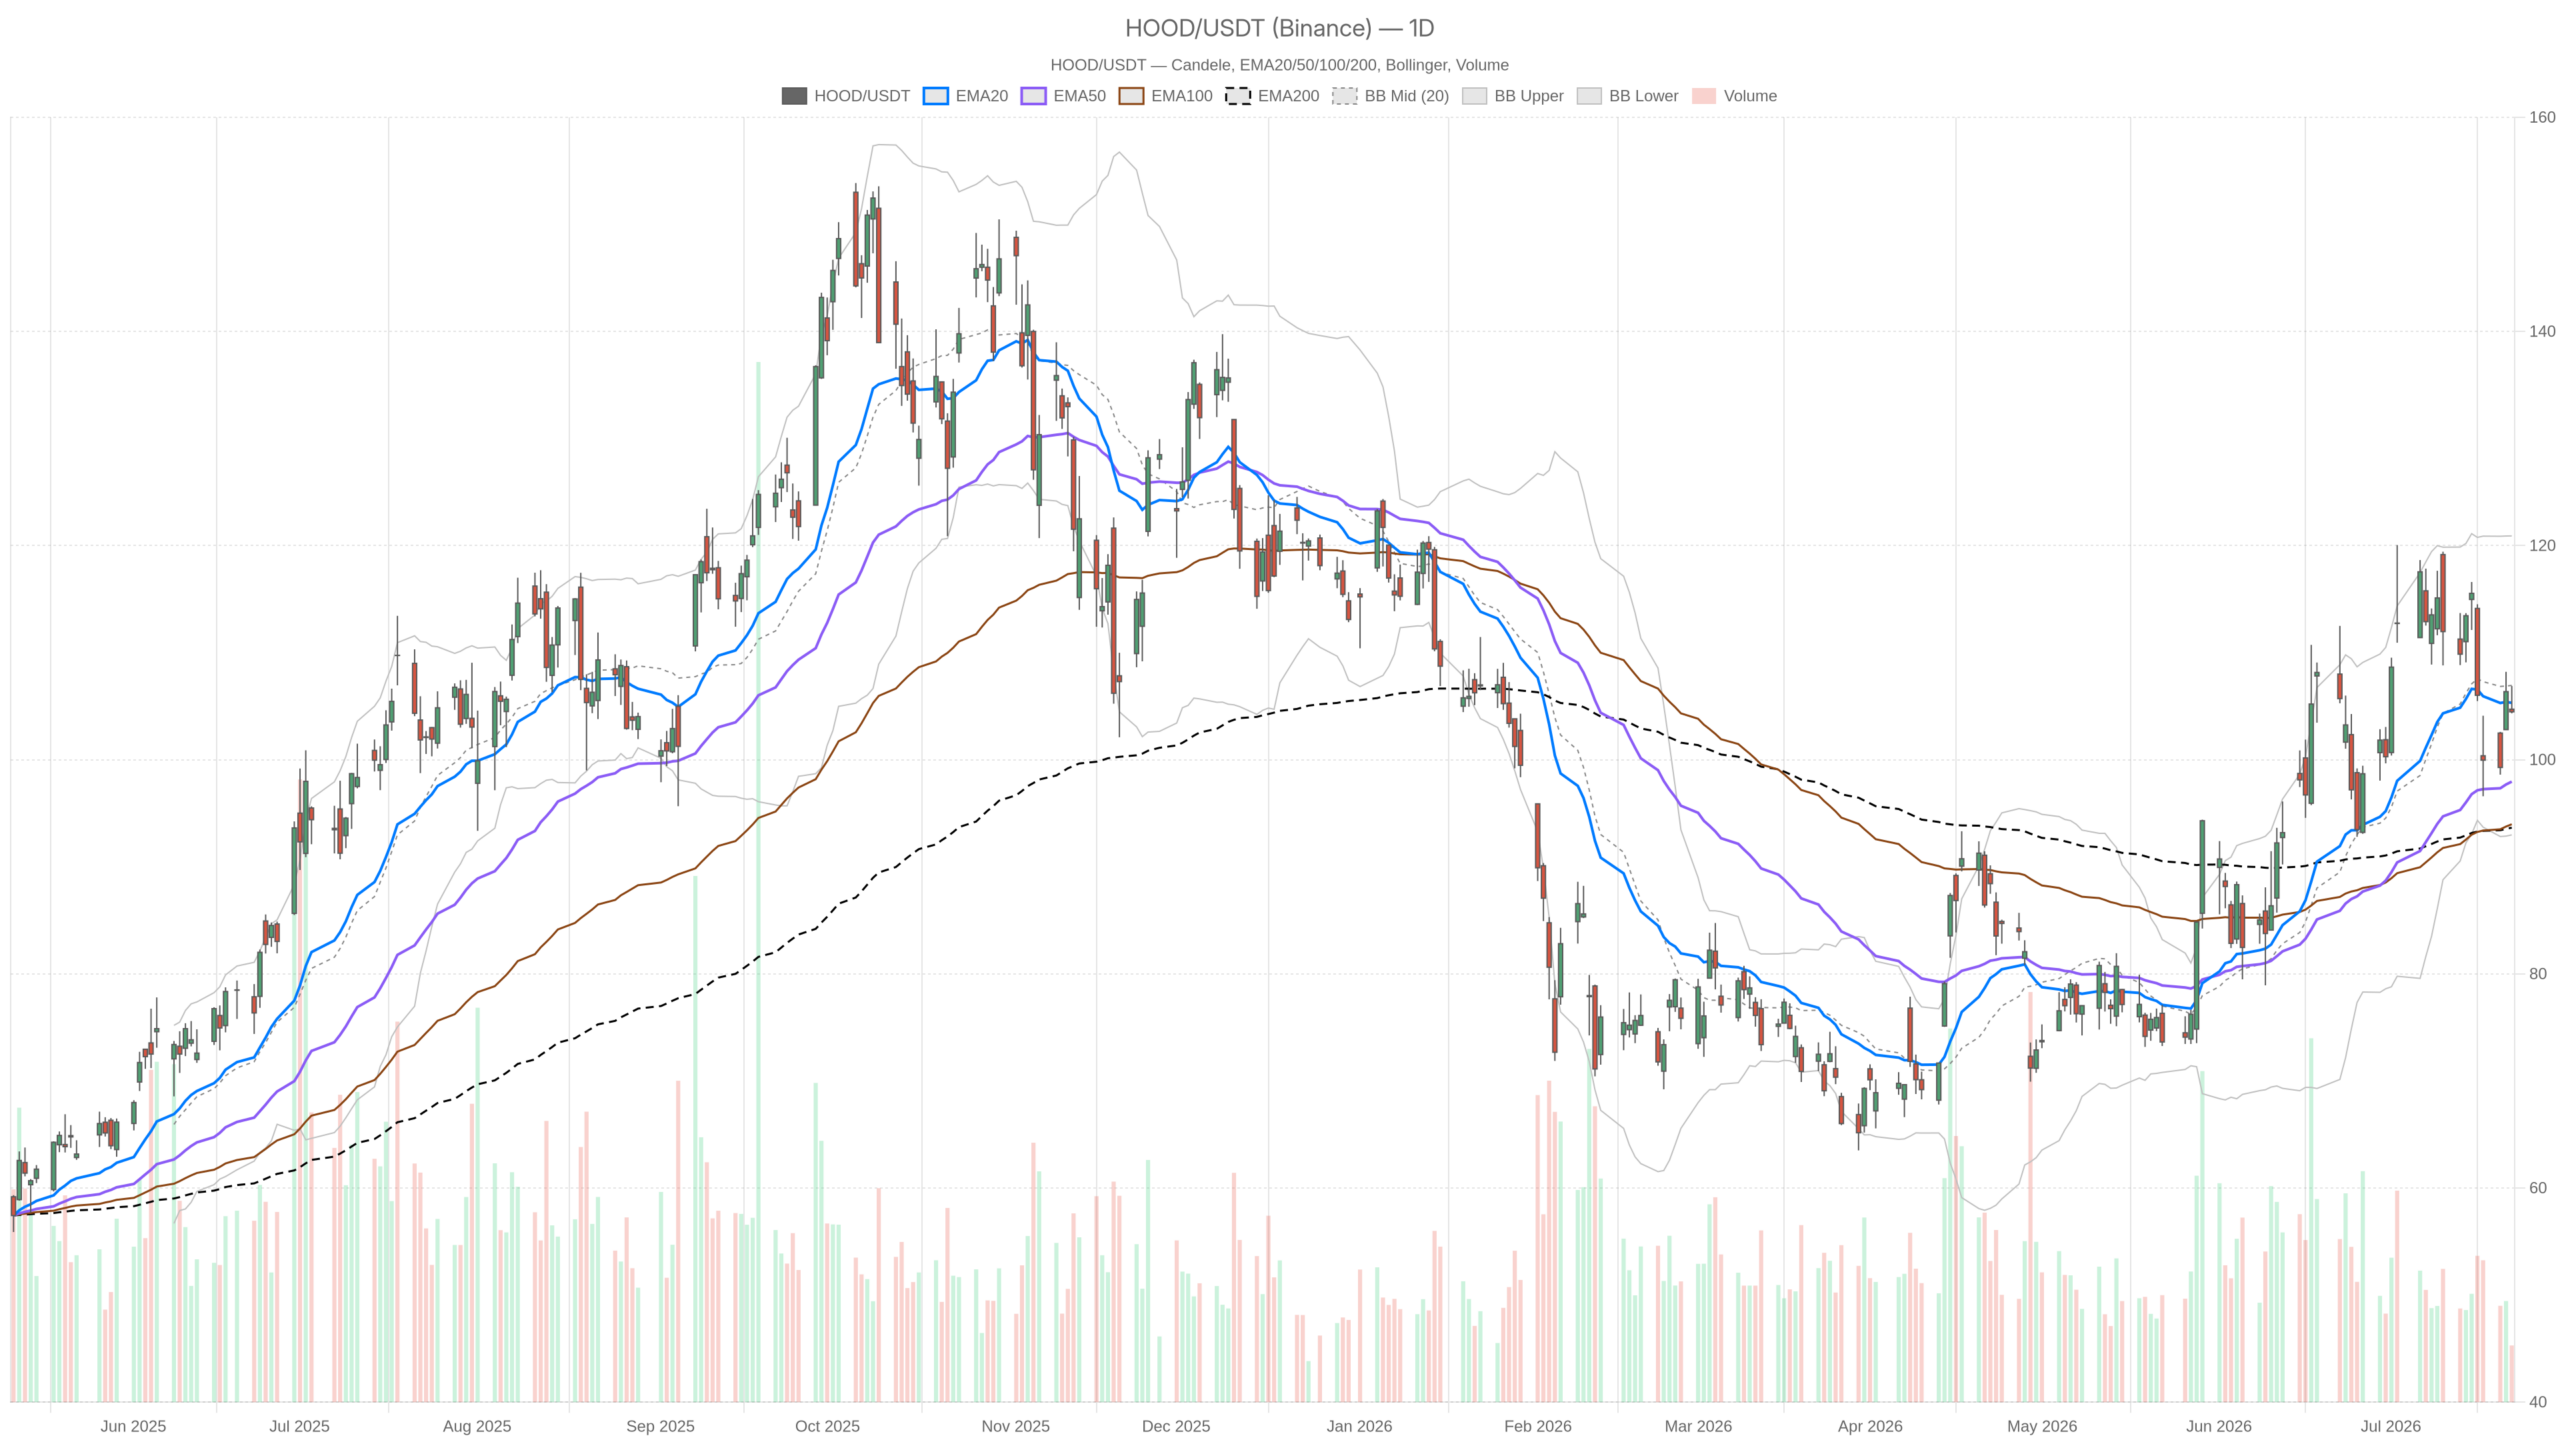
Robinhood Stock closed at $104.48 on July 22, hovering below its daily EMA20 of $105.31. Yet beneath hesitant price action, analysts flag an earnings beat, surging prediction-market revenue, and accelerating AI integration. The chart looks uncertain. The fundamental story does not.
Summary
Key takeaways
- HOOD closed at $104.48 on July 22, just below its daily EMA20 of $105.31 and the daily pivot of $105.23.
- The medium-term trend remains bullish: price holds above the EMA50 at $97.96 and EMA200 at $93.65.
- Bernstein projects Robinhood’s prediction market revenue could reach $1.7 billion by 2028.
- Daily RSI at 51 and a deteriorating MACD histogram signal neutral-to-fading short-term momentum.
- Near-term goalposts: support at $103.58, resistance at $106.13.
Daily Timeframe: HOOD’s Structurally Constructive Foundation
Is HOOD’s daily trend intact? Yes — the stock holds firmly above both its EMA50 at $97.96 and EMA200 at $93.65. Short-term momentum, however, has stalled with price slipping below the daily EMA20 at $105.31.
That layered EMA structure — price above the 50, which sits above the 200 — reflects accumulated bullish momentum built over months, not days. However, losing the EMA20 signals a short-term loss of near-term control for buyers. The daily RSI at 51 reinforces this ambivalence. It sits almost exactly at the midpoint of its range — neither overbought nor washed out.
Meanwhile, the MACD complicates the picture. The MACD line reads 2.69 against a signal line of 4.52, producing a negative histogram of -1.83. That divergence — a still-positive MACD line alongside a falling histogram — indicates bullish momentum is decelerating. It has not reversed outright, but it is clearly fading.
Bollinger Bands place the midline at $106.94, with the upper band at $120.90 and the lower band at $92.98. The wide band width reflects elevated historical volatility. A daily ATR of 6.77 confirms HOOD remains a high-movement name. At current levels, price sits below the Bollinger midline. That is a subtle but meaningful sign that near-term pressure favors the downside. The daily regime is classified as neutral — the trend foundation remains intact, but momentum has stalled.
Daily pivot analysis places the pivot point at $105.23. Price closed below it, leaving a mild bearish lean for intraday positioning. It is not, however, a structural breakdown.
Hourly Signals: Short-Term Recovery Attempt for Robinhood Stock
Is the hourly chart confirming the daily softness? Partially. The 1H close at $104.49 sits below both the hourly EMA20 at $105.15 and the EMA50 at $106.52, reinforcing near-term pressure. In contrast, price holds above the hourly EMA200 at $103.28 — a meaningful intraday floor worth monitoring closely.
The hourly RSI at 45.57 sits below the 50 midline, confirming mild bearish pressure on this timeframe. Nevertheless, the hourly MACD tells a more encouraging story. The MACD line is at -0.17 with the signal at -0.36, generating a positive histogram of 0.19. That histogram turn suggests the hourly selloff is losing momentum. A short-term stabilization attempt appears to be forming.
Overall, the 1H frame modestly weakens the daily bullish structure without invalidating it. The most accurate reading: HOOD is navigating a short-term consolidation within a larger uptrend.
15-Minute Frame: Execution Context for HOOD
What does the 15-minute chart reveal for active traders? Late-session selling pressure, but also proximity to a potential exhaustion zone. At the 15:45 close, price held at $104.49. The 15m RSI sat at 39.37, approaching oversold territory. The MACD histogram flipped negative at -0.11, suggesting selling pressure reasserted itself into the session’s final stretch.
Notably, the 15m Bollinger lower band at $104.61 sits essentially at the current close. That proximity suggests the stock may be approaching a short-term exhaustion point. Conditions for a technical bounce are emerging — though this should not be treated as a standalone signal. Price also traded below the 15m EMA200 at $107.04 and both shorter EMAs, confirming the intraday softness.
Fundamental Catalysts for Robinhood Stock: Where the Real Debate Is
What matters more than the charts right now? Three catalysts dominate the fundamental narrative: an expected Q2 earnings beat, surging prediction-market revenue, and expanding agentic AI integration. These drivers may ultimately prove more decisive than current technical signals.
Analysts are flagging HOOD as likely to beat estimates in its upcoming Q2 earnings release. If confirmed, that would represent a meaningful catalyst for re-rating the stock’s near-term trajectory. Perhaps more structurally important is the prediction markets story. Bernstein projects Robinhood’s prediction market revenue could reach $1.7 billion by 2028. Analysts at both Bernstein and Piper Sandler noted this week that prediction-market revenue could overtake crypto revenue as early as Q2. That shift would meaningfully reshape HOOD’s revenue mix — and potentially its valuation multiple.
At the same time, Robinhood’s Senior VP of Crypto, Johann Kerbrat, outlined the company’s expanding use of agentic AI for users. This reinforces a broader narrative of platform evolution beyond simple retail trading. Meanwhile, HOOD benefited on July 21 from Bitcoin’s recovery above $66,000, which lifted crypto-linked equities broadly as traders rotated back into risk assets.
Bullish Scenario: Earnings Beat Meets Technical Re-Entry for HOOD
What would confirm a bullish breakout? A confirmed Q2 earnings beat, combined with price reclaiming the daily EMA20 at $105.31 and the daily pivot at $105.23, would signal buyers regaining control. A subsequent break above daily R1 at $106.13 and the Bollinger midline at $106.94 would open the path toward higher levels.
Beyond the technicals, the prediction-market growth story adds a structural layer to the bull case. If revenue from that segment begins visibly displacing crypto in the revenue mix, analysts may revisit price targets. That could inject sustained buying pressure independent of short-term price action.
Bearish Scenario: What Would Invalidate the HOOD Bull Case
What would shift the outlook negative? Failure to reclaim $105.23 and a break below daily S1 support at $103.58 would shift the short-term tone more defensive. Below that, the next meaningful structural floor sits at the Bollinger lower band near $92.98. Reaching that level, however, would require significant deterioration in either fundamentals or market sentiment.
An earnings miss — or even in-line results that disappoint elevated expectations — could quickly reverse recent optimism. Similarly, a reversal in Bitcoin and crypto sentiment would remove one of the external tailwinds that lifted HOOD on July 21. With a daily ATR of 6.77, these moves can unfold rapidly.
Positioning: Robinhood Stock at a Genuine Inflection Point
Where does Robinhood Stock stand now? At an inflection point. The medium-term trend remains bullish by structure, but short-term momentum is fading across all three timeframes. The technicals alone justify patience over aggression. However, the fundamental catalysts — earnings, prediction-market growth, AI expansion — are unusually concentrated in time, elevating the event-risk environment.
Notably, the daily ATR of 6.77 means meaningful moves in either direction are entirely plausible in the days ahead. Traders should treat the $103.58 support and $106.13 resistance as near-term goalposts. A decisive break in either direction, especially coinciding with earnings news, will likely set the tone for HOOD’s next meaningful leg.
FAQ
What are the key support and resistance levels for Robinhood Stock?
Near-term support sits at $103.58 (daily S1), with the hourly EMA200 at $103.28 providing an additional floor. Resistance stands at $106.13 (daily R1), with the Bollinger midline at $106.94 serving as the next upside hurdle.
What is driving the fundamental bull case for HOOD?
Three catalysts are converging: an expected Q2 earnings beat, surging prediction-market revenue projected at $1.7 billion by 2028, and expanding agentic AI integration across the Robinhood platform. These drivers may prove more decisive than current technical signals.
How significant is the prediction market opportunity for Robinhood?
Bernstein projects Robinhood’s prediction market revenue could reach $1.7 billion by 2028. Analysts at Bernstein and Piper Sandler noted it could overtake crypto revenue as early as Q2, potentially reshaping HOOD’s revenue mix and valuation multiple.
What technical signals should traders watch on HOOD right now?
A recovery above $105.31 (daily EMA20) and $105.23 (daily pivot) would signal buyers regaining control. A break below $103.58 would shift the short-term tone more defensive. With a daily ATR of 6.77, moves in either direction can develop quickly.
Disclaimer: This article is for informational purposes only and does not constitute financial advice, an investment recommendation, or a solicitation to buy or sell any financial instrument or cryptocurrency. The analysis provided is not indicative of future results. Investing in crypto assets and financial markets carries a high risk of capital loss. Always do your own research (DYOR) and consult a qualified financial advisor before making any decision.
Article produced with the assistance of artificial intelligence and reviewed by the editorial team.
