



QuantumScape Corporation stock closed at $5.87 on July 22, trapped beneath every major moving average. The technical picture aligns with a challenging fundamental backdrop after Q2 2026 earnings revealed wider loss estimates and limited revenue visibility. Both stories point firmly bearish.
Summary
Key takeaways
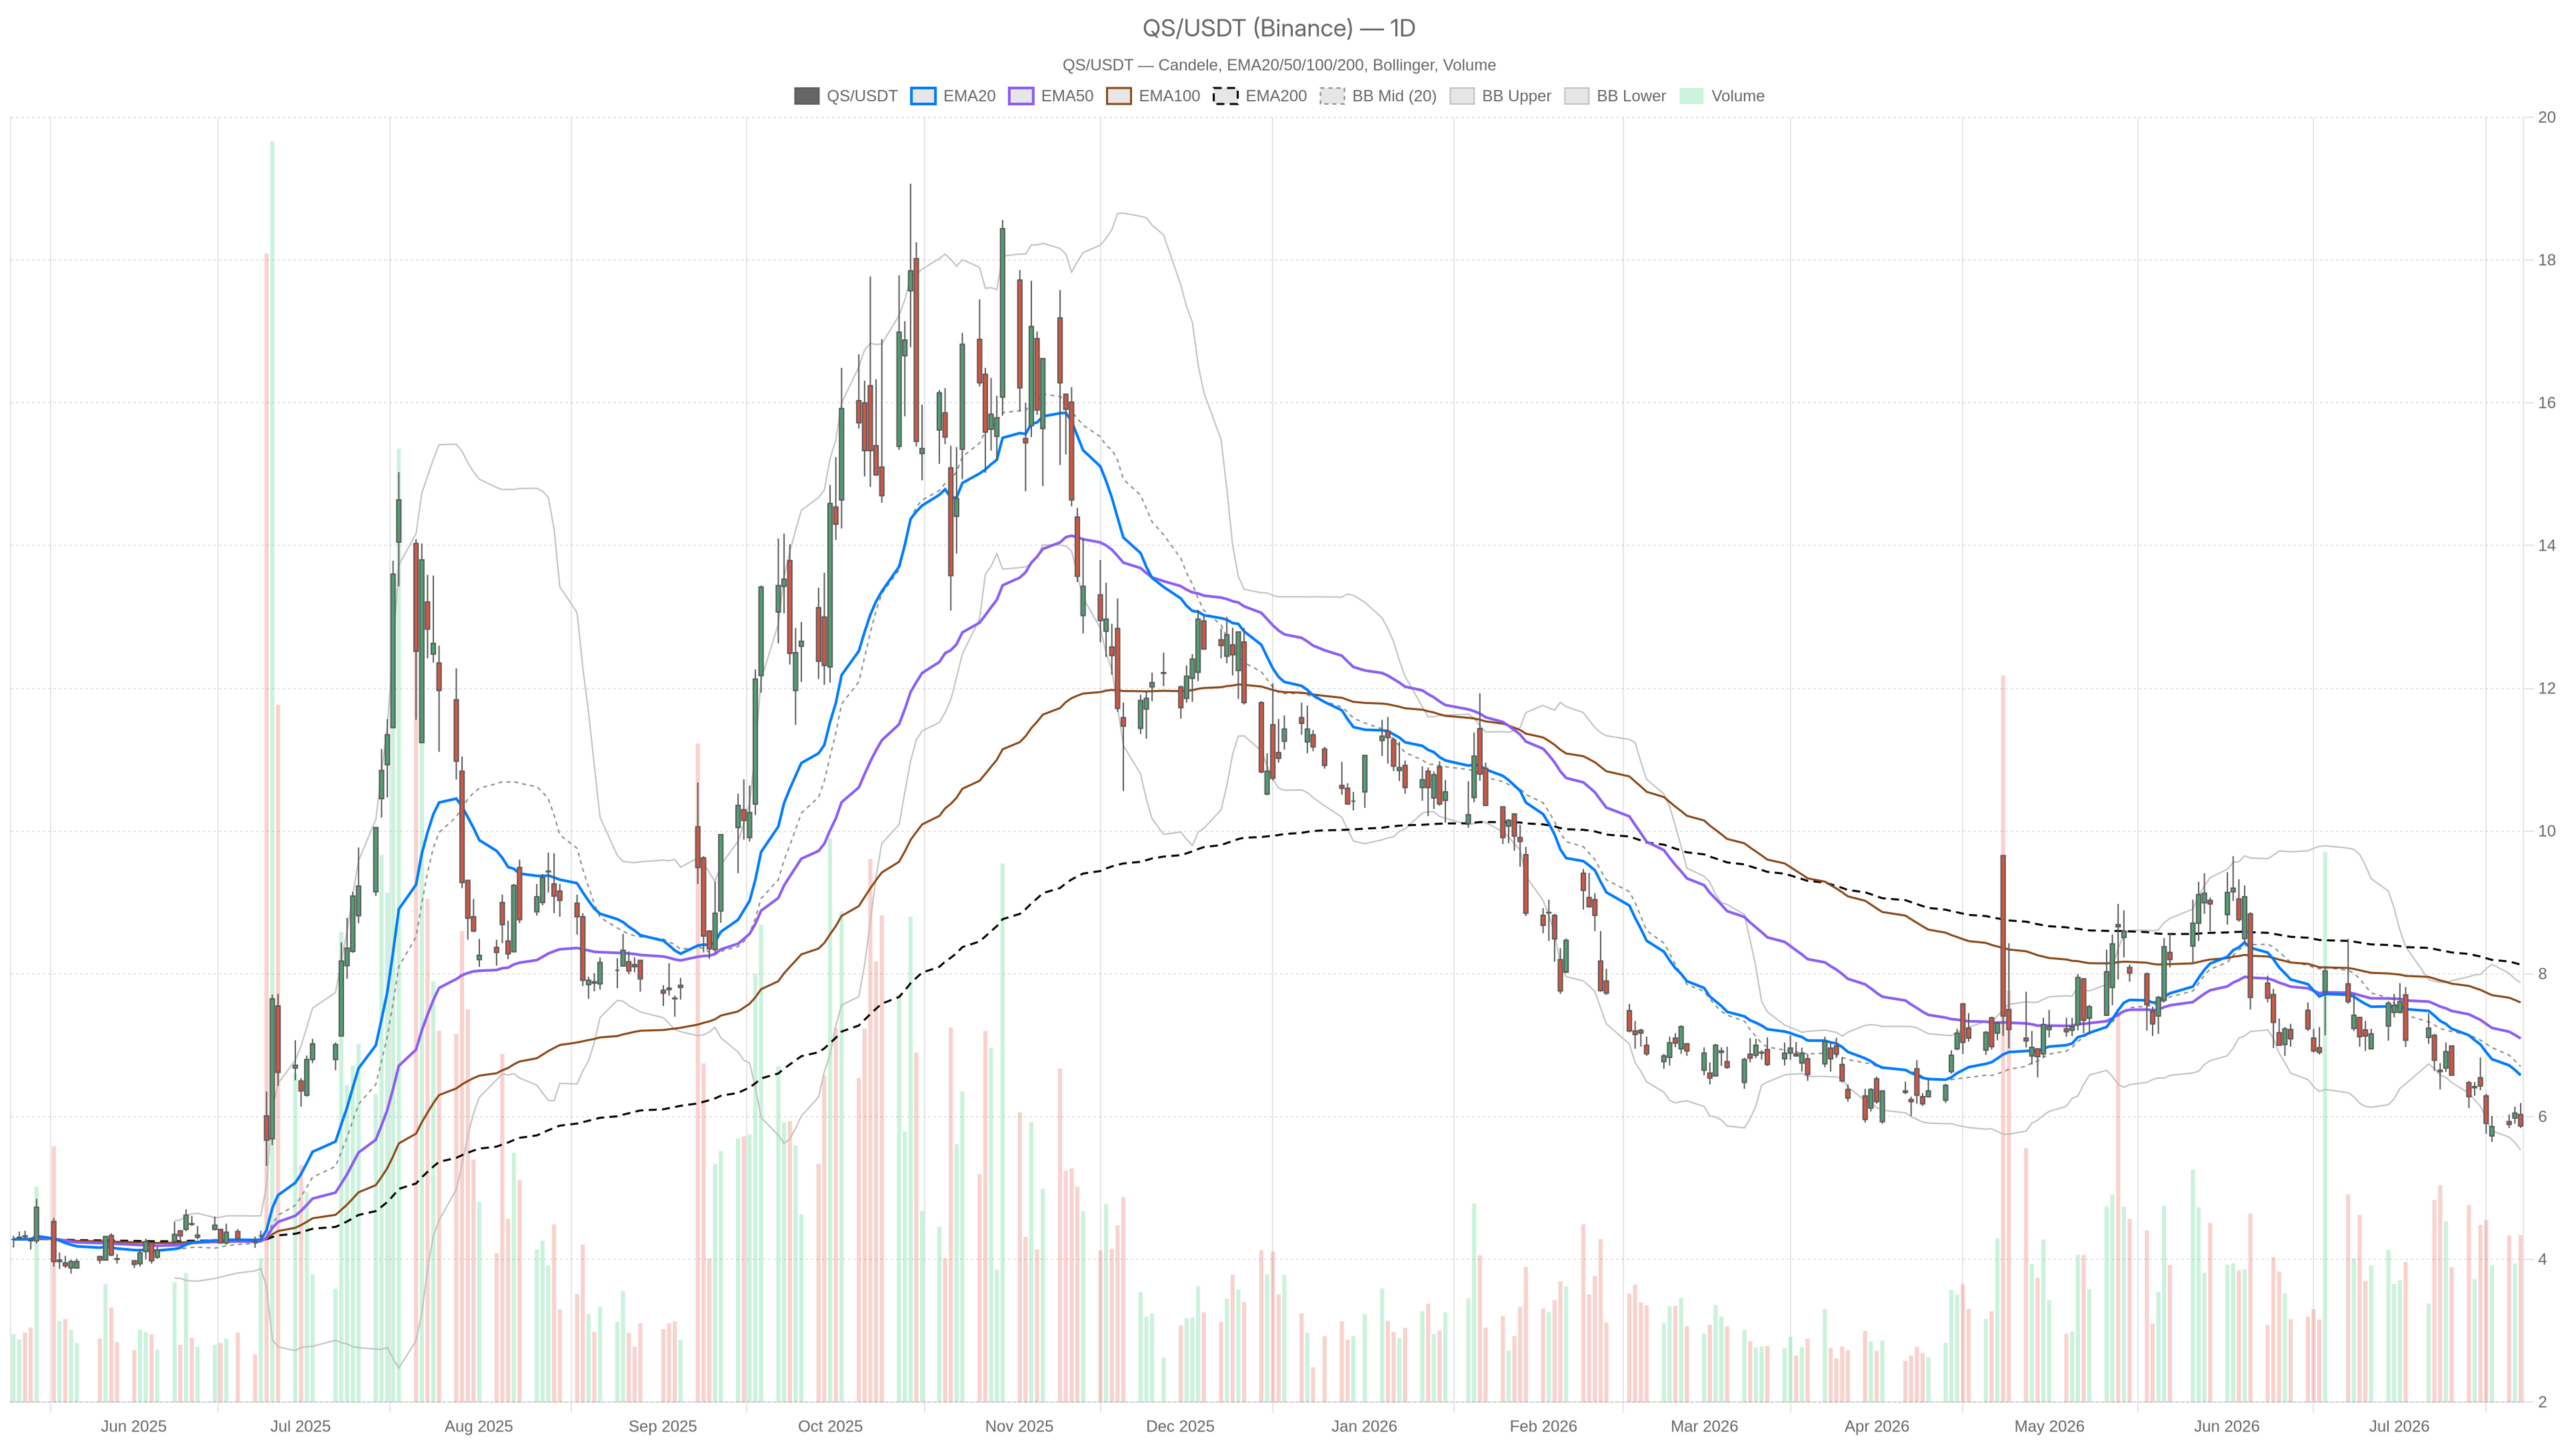
- QS closed at $5.87, well below the EMA20 ($6.58), EMA50 ($7.10), and EMA200 ($8.13) — a stacked bearish alignment across all three averages.
- Daily RSI14 at 35.27 and MACD histogram at -0.07 confirm active downward momentum with no reversal signal forming.
- The nearest support sits at S1 ($5.74), with the lower Bollinger Band at $5.53 as the next critical structural floor.
- Hourly and 15-minute timeframes echo the bearish regime, offering no short-term recovery structure.
- A credible bullish reversal requires a sustained daily close above $6.09, followed by a reclaim of the EMA20 at $6.58.
Daily Timeframe: A Bearish Regime With No Shelter
The daily chart confirms a textbook bearish regime for QuantumScape Corporation stock. Price at $5.87 sits beneath a perfectly stacked bearish EMA alignment, leaving no technical shelter from the moving average side.
Moving Average Structure Leaves No Shelter
The EMA20 stands at $6.58, the EMA50 at $7.10, and the EMA200 at $8.13. Price is not merely below the 200-day average. It trades beneath all three in stacked bearish order. That kind of EMA compression leaves minimal technical support for buyers.
The RSI14 on the daily sits at 35.27, approaching oversold territory. However, no meaningful bounce has triggered. Oversold readings in a sustained downtrend frequently signal continuation rather than reversal. This is especially true when no positive divergence is present. Momentum remains tilted to the downside.
Momentum and Volatility Confirm the Downtrend
The daily MACD reinforces this bearish view. The MACD line reads -0.44, the signal line -0.37, and the histogram sits at -0.07. The histogram has widened negatively, confirming that downward momentum remains active. No bullish crossover is forming.
Meanwhile, the Bollinger Bands place the midline at $6.70, with the lower band at $5.53. Price at $5.87 presses the lower half of the band structure. A close approaching $5.53 would signal extreme compression. The daily ATR of $0.43 reflects meaningful daily volatility. This implies roughly 7% daily swing potential for a stock at this price level.
Daily pivot analysis adds further context. The pivot point sits at $5.97, with R1 at $6.09 and S1 at $5.74. The close at $5.87 is below the pivot — a clear sign that bears controlled the session. S1 at $5.74 is the next structural floor on this timeframe.
Hourly Confirmation: No Recovery Signal in Sight
The 1H timeframe reinforces the bearish thesis without offering any recovery signal. QuantumScape Corporation stock remains below all three hourly EMAs in stacked bearish order, mirroring the daily structure.
The 1H EMA20 sits at $5.99, the EMA50 at $6.13, and the EMA200 at $6.82. Price at $5.88 stays beneath all three. No short-term recovery structure is building.
The 1H RSI reads 38.27. Like the daily, it is weak but not yet in oversold extremes. This mid-range bearish RSI often reflects steady, grinding selling rather than a sharp capitulation event. In contrast, a spike into the 20–25 RSI range would more strongly suggest a washout low.
Meanwhile, the 1H MACD is modestly negative. The MACD line sits at -0.04 and the signal line at -0.03, with the histogram printing -0.01. These are small numbers in isolation. However, they sit on top of the much larger daily MACD deterioration. On the hourly, the Bollinger midline is $5.99 and the lower band is $5.86. Price trades just inside the lower band — tight, compressed, and leaning bearish.
Hourly pivots place support at S1 ($5.83) and resistance at R1 ($5.92). The intraday range on July 22 ran from a $5.84 low to a $5.93 high. That range fits almost entirely within those pivot boundaries. The market is consolidating at the low, not bouncing.
15-Minute View: Execution Context Only
The 15-minute chart echoes the bearish regime across higher timeframes. No entry signal or reversal catalyst emerges at this granularity for QuantumScape Corporation stock.
The RSI14 at 32.76 marks the weakest reading across all three timeframes. The EMA structure mirrors the higher frames. The EMA20 sits at $5.94, the EMA50 at $5.98, and the EMA200 at $6.13 — all above price. The ATR on this frame is $0.05, meaning intraday ranges are narrow and somewhat directionless. For traders, the 15-minute picture simply echoes what the daily and hourly have established: price is compressing in bearish territory.
Bullish Scenario: What Would Need to Change
A credible bullish reversal for QuantumScape Corporation stock requires more than a technical bounce. On the fundamental side, the Eagle Line pilot production progress — including the faster Cobra process and rising billings — represents genuine optionality. If Q2 earnings commentary reveals meaningful commercialization milestones, the narrative could shift quickly.
Technically, a recovery would need a sustained daily close above $6.09. That level corresponds to both the daily R1 pivot and the proximity of the EMA20. Above that, the next real challenge is the EMA20 at $6.58. A move back above $6.58 would begin to repair the moving average structure. Until then, any intraday upticks remain suspect within the prevailing downtrend.
Bearish Scenario: The Path of Least Resistance
The bearish case remains the path of least resistance for QuantumScape Corporation stock. QS heads into Q2 results with wider loss estimates and ongoing pilot-line spending — a combination markets are not rewarding.
The daily MACD is still expanding negatively. Price sits below every key moving average. Daily support at S1 ($5.74) is the nearest floor. Below that, the lower Bollinger Band at $5.53 becomes the key structural level to monitor. A daily close below $5.74 would confirm further deterioration. It would also open the door toward the lower band and invalidate any short-term stabilization thesis.
Positioning and Volatility Outlook
Overall, QuantumScape Corporation stock sits in firmly bearish territory across daily, hourly, and 15-minute timeframes. This rare alignment removes ambiguity. The daily ATR of $0.43 signals elevated volatility relative to price, meaning sharp moves in either direction remain possible.
Still, the burden of proof rests entirely with the bulls. Without a clear reclaim of the pivot and EMA structure, the path of least resistance remains lower. Traders and investors should treat any near-term strength as a potential selling opportunity. This holds unless accompanied by a meaningful shift in earnings fundamentals or price structure confirmation.
FAQ
What is the current trend for QuantumScape Corporation stock?
QuantumScape Corporation stock is in a firmly bearish downtrend across all timeframes. At $5.87, it trades below the daily EMA20 ($6.58), EMA50 ($7.10), and EMA200 ($8.13), forming a stacked bearish alignment. The daily RSI14 at 35.27 and negative MACD histogram confirm active downward momentum.
What are the key support levels for QS stock?
The nearest support sits at the daily S1 pivot of $5.74. Below that, the lower Bollinger Band at $5.53 becomes the critical structural floor. A daily close beneath $5.74 would confirm further deterioration and open the path toward $5.53.
What would need to happen for a bullish reversal in QS?
A credible bullish reversal requires a sustained daily close above $6.09, which corresponds to the daily R1 pivot. Above that level, the next challenge is reclaiming the EMA20 at $6.58. On the fundamental side, meaningful commercialization milestones from the Eagle Line pilot production — including the Cobra process — could shift the narrative.
How volatile is QuantumScape Corporation stock right now?
The daily ATR of $0.43 implies roughly 7% daily swing potential at current price levels. This signals elevated volatility. Sharp moves in either direction remain possible, but the prevailing trend is bearish across all timeframes.
Disclaimer: This article is for informational purposes only and does not constitute financial advice, an investment recommendation, or a solicitation to buy or sell any financial instrument or cryptocurrency. The analysis provided is not indicative of future results. Investing in crypto assets and financial markets carries a high risk of capital loss. Always do your own research (DYOR) and consult a qualified financial advisor before making any decision.
Article produced with the assistance of artificial intelligence and reviewed by the editorial team.
