



QuantumScape stock closed at $5.86 on July 17, below every meaningful daily moving average. Momentum indicators sit deep in bearish territory. With Q2 earnings approaching amid wider loss estimates and limited revenue visibility, the technical and fundamental backdrop remains fragile.
Summary
Key takeaways
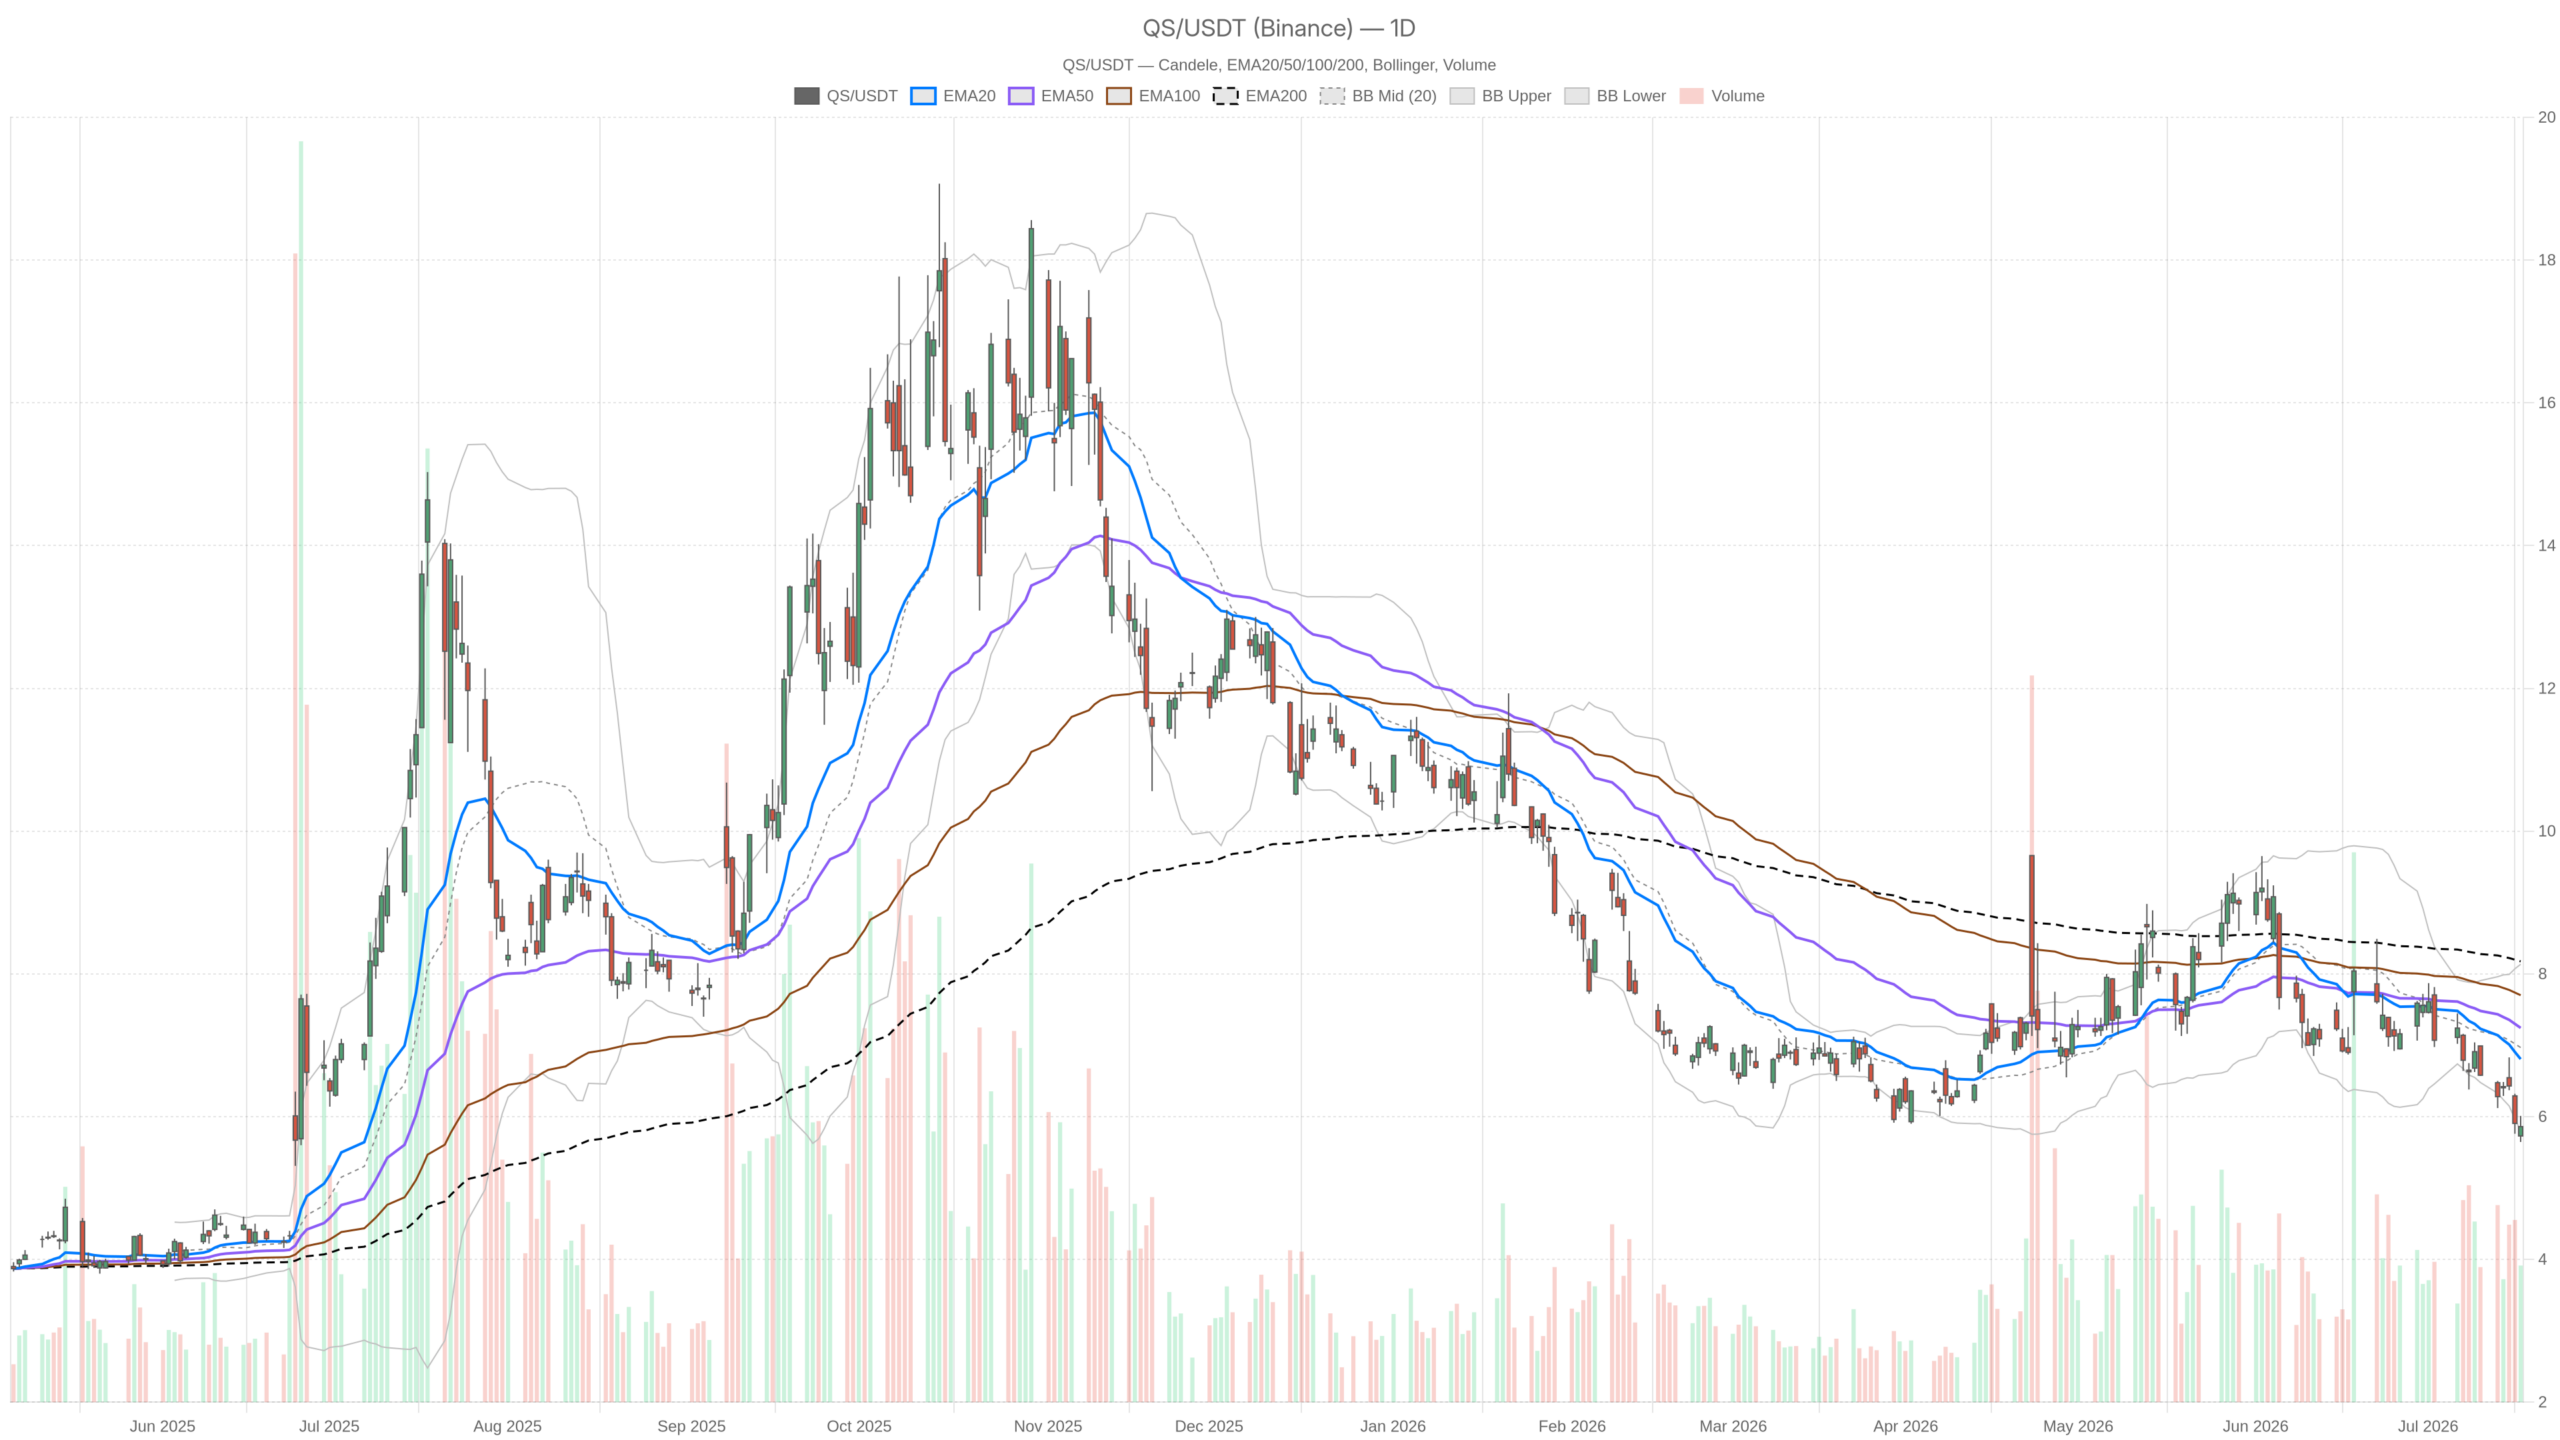
- QS closed at $5.86 on July 17, below the EMA20 ($6.81), EMA50 ($7.24), and EMA200 ($8.18)
- Daily RSI at 33.57 nears oversold territory but has not triggered a reversal signal
- MACD remains negative across daily and hourly timeframes, confirming sustained downside momentum
- Daily pivot sits at $5.84, with S1 support at $5.67 and the Bollinger lower band at $5.80 under pressure
- Q2 earnings carry wider loss estimates, limited revenue visibility, and ongoing pilot-line spending
- A bullish reversal requires a sustained close above the daily EMA20 at $6.81, roughly 16% above current levels
QuantumScape Stock Daily Bias: Bearish Across the Board
The daily timeframe leaves little room for ambiguity. QS closed at $5.86 on July 17, with a session range of $5.64 to $6.01. Volume exceeded 21 million shares. The EMA structure is stacked bearishly. Price sits well below the EMA20 at $6.81, the EMA50 at $7.24, and the EMA200 at $8.18. Each moving average declines in sequence. That cascade confirms a sustained downtrend, not a brief correction.
The daily RSI at 33.57 approaches oversold territory but has not triggered a reversal signal. In a persistent downtrend, RSI can linger near oversold levels for extended periods without bouncing. That is precisely the risk here. Meanwhile, the MACD line sits at -0.41 against a signal of -0.31. The histogram reads -0.11. Momentum remains negative and still diverging. There is no evidence of a bottoming impulse on this timeframe.
Bollinger Band context adds further pressure. The lower band at $5.80 sits just beneath the current close of $5.86. Price is pinned to the lower edge of the daily envelope. This reflects sustained selling rather than a temporary dip. The daily ATR at $0.47 indicates meaningful intraday swings are still possible. That keeps stop placement wide and risk management demanding for short-term participants.
Pivot Levels and the Key Battle at $5.84
The daily pivot point sits at $5.84 — virtually identical to the current close. R1 resistance is at $6.03, which aligns roughly with the session high. S1 support is at $5.67. The proximity of price to the pivot implies a market that has not resolved its direction within the session. However, given the broader trend context, any drift toward S1 at $5.67 carries more weight than a test of R1. Below S1, the daily Bollinger lower band at $5.80 becomes the next relevant floor. It is already close to breaking.
1H Timeframe: Confirms the Bear Case, Hints at Minor Stabilization
On the hourly chart, QS mirrors the daily narrative. Price at $5.85 remains below the 1H EMA20 at $6.02, EMA50 at $6.31, and EMA200 at $7.03. The regime is officially bearish at this timeframe too. The 1H RSI at 37.81 is weak but not yet at extreme levels. It is drifting rather than collapsing. This could imply a very near-term pause in selling pressure.
Notably, the 1H MACD histogram has ticked to +0.01 — essentially flat, but technically fractionally positive. The MACD line and signal are both at -0.16. Any divergence is minimal. This is not a bullish signal. However, it does suggest that the rate of decline on the hourly chart has momentarily stalled. That stall could allow for a short-duration consolidation. It does not challenge the daily downtrend in any meaningful way.
The 1H Bollinger Band structure reinforces the bearish lean. The midband at $6.06 is well above price. The lower band at $5.49 sits below, providing some theoretical cushion. On the hourly pivot, R1 is at $5.91. That level capped the session high of $5.92. The near-perfect rejection at hourly resistance adds weight to the idea that rallies remain selling opportunities rather than breakout attempts.
15-Minute Context: Flat Momentum Into the Close
At the 15-minute level, the picture is one of exhaustion. The MACD line, signal, and histogram are all at zero. This rare flat reading reflects complete momentum neutrality in the short term. The 15m RSI at 47.08 sits almost perfectly in the middle of its range. Price at $5.85 essentially trades at the 15m pivot of $5.85. R1 is at $5.87 and S1 at $5.83, compressing the range to just four cents.
That kind of tight range compression on the 15m chart typically precedes a directional move. In isolation, it could break either way. However, in context of the daily and hourly bearish regimes, the path of least resistance remains downward. The 15m ATR at just $0.05 confirms the micro-range environment. Execution is possible, but the moment of resolution may come on a catalyst.
The Catalyst on Deck: Q2 Earnings
The upcoming Q2 earnings report is the dominant event risk. According to available previews, QS heads into the report with wider loss estimates, limited revenue visibility, and ongoing pilot-line spending. That is not a formula for a positive surprise. The Eagle Line pilot production progress and the Cobra process acceleration have been cited as constructive developments in some recent commentary. However, faster process cycles on a pilot line do not translate directly to near-term financial improvement. Commercialization remains a longer-dated objective.
At the same time, broader macro noise has added an external layer of uncertainty. A mid-July headline linked strikes on Iranian forces to futures market weakness. That briefly pulled QS into a risk-off basket alongside other high-beta names. The geopolitical sensitivity reflects the stock’s vulnerability to broad market sentiment swings. This is a typical feature of thinly-followed, pre-revenue growth names.
Bullish Scenario: What QuantumScape Stock Needs to Reverse
A credible bullish reversal for QuantumScape stock would require both technical and fundamental catalysts. On the price side, a sustained close above the daily EMA20 at $6.81 is the minimum threshold to shift short-term sentiment. That is roughly 16% above current levels. In between, $6.03 — the daily R1 and session high — would need to be cleared convincingly first.
On the fundamental side, any earnings update showing billings growth, a tangible commercialization timeline, or reduced cash burn could shift the narrative. Some bullish commentary around the Eagle Line has pointed to rising billings and a clearer 2026 outlook as potential re-rating triggers. If those data points materialize in the Q2 report, the combination with a technically oversold RSI near 33 could accelerate a short-squeeze dynamic.
Bearish Scenario: The Path of Least Resistance
In contrast, the bearish case requires very little. A Q2 report delivering wider losses without a clear commercialization milestone would likely confirm existing seller conviction. A break below S1 at $5.67 on the daily chart would expose the $5.49 region. That is the 1H Bollinger lower band and the next meaningful test. Below that, the daily Bollinger lower band at $5.80 is already under pressure. The EMA200 at $8.18 is so far above price that it offers no near-term reference point whatsoever.
Moreover, the MACD on the daily chart has not shown any sign of a bullish crossover. Until the histogram begins to contract meaningfully toward zero, the momentum structure supports further weakness.
Positioning QuantumScape Stock Into Uncertainty
Overall, QuantumScape stock presents a technically bearish setup across all three timeframes. The daily defines the trend. The hourly confirms it without meaningful divergence. The 15-minute frame suggests a brief pause rather than a reversal. Daily volatility remains elevated — ATR of $0.47 — keeping risk wide. At the same time, the 15-minute compression could trigger a swift move in either direction around the earnings catalyst.
Therefore, the risk-reward picture heavily favors caution. Aggressive long positioning here means buying into a confirmed downtrend near support. That is ahead of an earnings event with negative baseline expectations — a high-conviction bet on a positive surprise. On the other hand, short positioning near multi-month lows also carries squeeze risk if the fundamental narrative shifts. In either direction, the earnings release is the key unlock. Until that data is in hand, the market appears content to hold QS pinned to its pivot.
FAQ
What is the current technical outlook for QuantumScape stock?
QuantumScape stock is in a confirmed downtrend across all major timeframes. As of July 17, QS closed at $5.86, below the EMA20 ($6.81), EMA50 ($7.24), and EMA200 ($8.18). The daily RSI at 33.57 is near oversold territory, and the MACD remains negative with no sign of a bullish crossover. The overall bias is bearish.
What are the key price levels to watch on QS?
The daily pivot sits at $5.84, with S1 support at $5.67 and R1 resistance at $6.03. Below S1, the next test is the 1H Bollinger lower band at $5.49. On the upside, a sustained close above the daily EMA20 at $6.81 would be the minimum threshold to shift short-term sentiment.
How could the upcoming Q2 earnings report affect QuantumScape stock?
QS heads into Q2 earnings with wider loss estimates, limited revenue visibility, and ongoing pilot-line spending. A report confirming wider losses without a clear commercialization milestone would likely reinforce the bearish trend. Conversely, any update showing billings growth or a tangible commercialization timeline could trigger a short-squeeze, especially given the technically oversold RSI.
Is QuantumScape stock oversold and due for a bounce?
The daily RSI at 33.57 is approaching oversold levels but has not triggered a reversal signal. In persistent downtrends, RSI can remain near oversold territory for extended periods without bouncing. The MACD histogram at -0.11 shows no contraction toward zero. A bounce would require a catalyst — most likely the upcoming earnings report.
Disclaimer: This article is for informational purposes only and does not constitute financial advice, an investment recommendation, or a solicitation to buy or sell any financial instrument or cryptocurrency. The analysis provided is not indicative of future results. Investing in crypto assets and financial markets carries a high risk of capital loss. Always do your own research (DYOR) and consult a qualified financial advisor before making any decision.
Article produced with the assistance of artificial intelligence and reviewed by the editorial team.
