




Aehr Test Systems stock faces genuine tension. Blowout earnings, $130M–$150M fiscal 2027 guidance, and a record $100.6M backlog clash with a daily chart still working through a meaningful correction. The gap between fundamentals and price structure makes AEHR particularly compelling.
Summary
Key takeaways
- AEHR delivered a Q4 earnings surprise of +1,200% alongside a revenue beat of +0.72%.
- The company entered fiscal 2027 with a record effective backlog of approximately $100.6M.
- Fiscal 2027 revenue is projected at $130M–$150M, more than doubling current output.
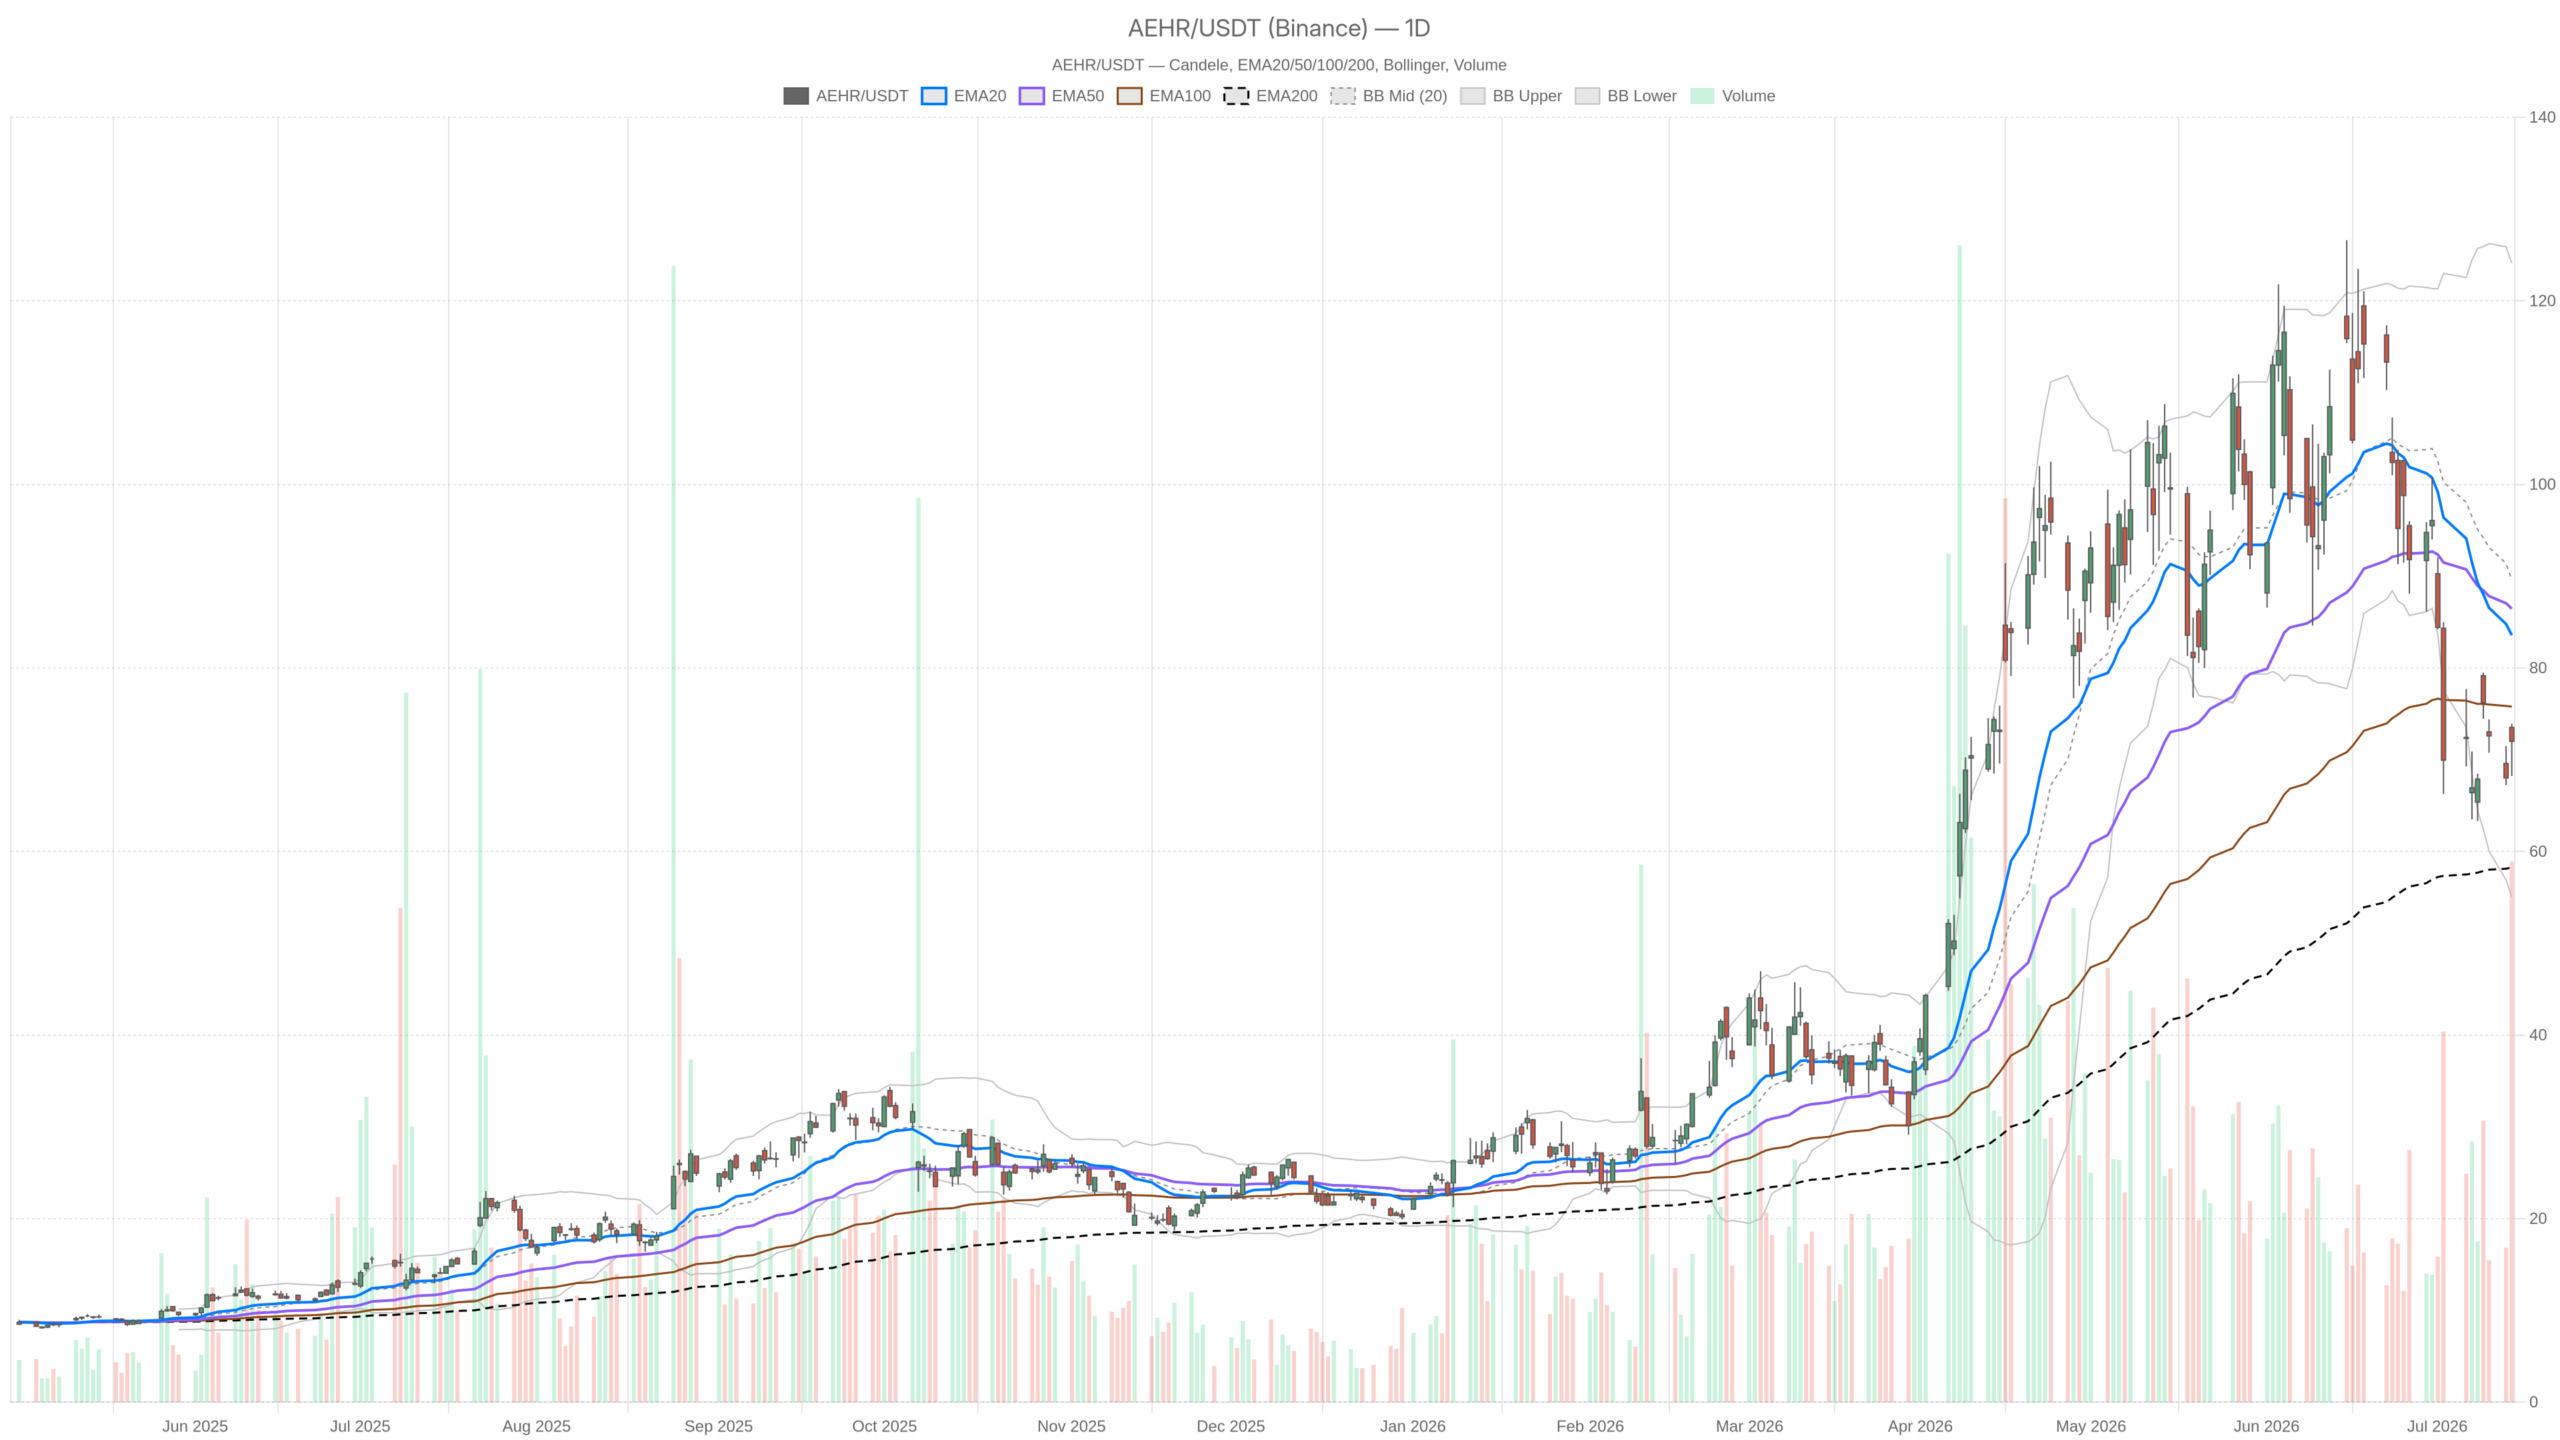
- Aehr Test Systems stock closed at $72.01 on July 14, well below both the EMA20 at $83.57 and EMA50 at $86.46.
- Daily RSI at 40.45 signals diminishing selling momentum, though no confirmed reversal has emerged.
Daily Bias: Aehr Test Systems Stock Remains Under Pressure
The daily bias for Aehr Test Systems stock is decidedly bearish. Price sits well below key moving averages, and negative MACD readings confirm sellers still hold the initiative on the D1 timeframe.
AEHR closed at $72.01 on July 14, sitting well below both the EMA20 at $83.57 and the EMA50 at $86.46. That gap is not trivial — it signals the intermediate trend remains structurally weak. However, the EMA200 at $58.26 sits significantly below the current price. This provides a longer-term anchor confirming the stock is not in freefall.
The daily RSI at 40.45 approaches oversold territory without quite reaching it. That level often precedes either a capitulation flush or a stabilization and recovery. At this stage, it does not confirm a reversal — it simply implies diminishing selling momentum. Meanwhile, the daily MACD is decidedly negative. The line sits at -7.93, the signal at -5.59, and the histogram at -2.35. A deepening histogram below zero suggests sellers remain in control.
Bollinger Bands on D1 further illustrate the corrective phase. The midline sits at $89.57, far above current price, while the lower band at $55.02 defines the structural floor. With the close at $72.01, the stock sits in the lower half of the band range. This reflects weakness, though not an extreme breakdown. The daily ATR of $9.43 also warrants attention — it speaks to substantial intraday volatility that makes precise entries genuinely challenging. Overall, the daily regime is classified as neutral, but the weight of evidence leans bearish.
Hourly Picture: Early Signs of Short-Term Stabilization
The hourly chart introduces a more constructive — though still tentative — layer for AEHR. Price has reclaimed the H1 EMA20, and the MACD histogram has flipped positive, suggesting selling pressure is easing on the intraday frame.
Price closed the last hour at $72.07, above the H1 EMA20 at $71.06. The H1 RSI at 52.91 sits in neutral territory — neither overbought nor oversold. This suggests the short-term bounce has room to continue without immediately exhausting itself.
Notably, the H1 MACD histogram has flipped positive at 0.29. The MACD line at -0.31 has crossed above the signal at -0.60. That crossover, while small in magnitude, represents a real short-term momentum shift. It does not override the daily bear signal. Still, it does confirm that selling pressure has eased on the intraday frame.
In contrast, the H1 EMA50 at $73.57 and EMA200 at $87.34 remain well above current price. This confirms the broader downtrend has not been resolved. The hourly pivot point is at $71.58, with R1 at $72.99 as the immediate resistance level to watch. The stock is trading just above its pivot — constructive for the very short term. Meanwhile, the H1 Bollinger midline at $71.00 has been reclaimed, another minor positive.
The 15-Minute Frame: Tactical Momentum Into the Close
The 15-minute chart shows mild bullish momentum carrying into the close. Price holds above near-term moving averages, though the micro-rally may be losing a touch of steam near resistance.
On the 15m chart, the close of $72.07 is above the EMA20 at $71.30 and EMA50 at $70.94. The RSI at 56.99 confirms mild bullish momentum in this window. However, the MACD histogram at -0.07 is fractionally negative, suggesting the micro-rally may be losing steam near recent highs. The 15m R1 sits at $72.75, closely aligned with the H1 R1 at $72.99. This convergence zone could cap the near-term upside if sellers reassert control.
For traders focused on execution, the 15m structure supports a short-term long bias above $71.15 support. However, that setup operates squarely against the daily trend. Any engagement at these levels demands strict risk management given the daily ATR of $9.43.
Fundamental Catalyst: Record Backlog and Revenue Doubling Ahead
The fundamental picture for Aehr Test Systems stock is exceptionally strong. Record backlog, AI-driven demand tailwinds, and fiscal 2027 guidance pointing to more than doubled revenue provide a powerful counter-narrative to the technical weakness.
The earnings results released July 14 were exceptional by any measure. AEHR delivered a Q4 earnings surprise of +1,200% and a revenue beat of +0.72%. CEO Gayn Erickson cited accelerating demand from AI processors, silicon photonics, and data center infrastructure as the primary growth drivers. The company entered fiscal 2027 with its record effective backlog of approximately $100.6M — a signal of genuine demand visibility.
The $130M–$150M revenue guidance for fiscal 2027 would represent more than a doubling of output. That is a bold projection, placing AEHR firmly in the conversation around AI infrastructure build-out. However, the stock’s muted price response tells a different story. AEHR closed at $72.01 on a day with a range of $68.23 to $73.92. This suggests the market is still digesting execution risk or the overhang of prior downside momentum. Strong guidance does not automatically reset a technical downtrend.
Bullish Scenario: Reclaiming the EMA20 Is the First Gate
The bullish thesis for Aehr Test Systems stock hinges on one key technical trigger: reclaiming the daily EMA20 at $83.57. If achieved, it would materially shift the technical picture and align price structure with the compelling fundamental narrative.
For bulls, the thesis is straightforward. A company guiding to double its revenue with a record backlog and AI-driven demand is not a structurally impaired story. Reclaiming the daily EMA20 at $83.57 would require roughly a 16% move from current levels — achievable if institutional buyers step in following the earnings print. The EMA200 at $58.26 provides a solid floor for a longer-term accumulation thesis.
Supporting conditions for the bull case would include several factors. Continued MACD improvement on the daily frame, RSI recovering toward 50 and above, and volume-driven closes above pivot resistance. The fundamental tailwinds from AI and silicon photonics demand are real and substantial. If execution matches the guidance, the price structure will eventually reflect it.
Bearish Scenario: Failing at Resistance Reopens Downside
The bearish case remains technically intact for AEHR. Failure to hold above the daily pivot and a roll below S1 would confirm the post-earnings bounce as a distribution event, reopening the path toward the lower Bollinger Band.
On the other hand, the bearish case remains technically intact. If AEHR fails to hold above the $71.58 daily pivot, the picture darkens. A drop below $68.85 — the daily S1 — would confirm the post-earnings bounce as a distribution event rather than a reversal. The lower Bollinger Band at $55.02 then becomes a legitimate medium-term target. A deepening MACD histogram on the daily frame would reinforce that scenario.
The risk here is that strong earnings guidance alone cannot override heavy technical selling pressure if the broader market environment turns unfavorable. Furthermore, with the daily ATR near $9.43, stops are wide and conviction must be high.
Positioning and Outlook
Overall, Aehr Test Systems stock presents an asymmetric setup with genuine uncertainty. The fundamental story is compelling, but the daily technical structure has not yet confirmed a turn — making this a transition phase rather than a clear directional call.
The fundamental story — record backlog, AI-driven growth, and projected revenue more than doubling — is compelling. The daily technical structure, however, has not yet confirmed a turn. The short-term hourly stabilization is encouraging. Yet it operates against a backdrop of daily downtrend indicators that have not yet resolved.
Therefore, the most credible stance is to treat this as a transition phase — neither a confirmed reversal nor a structural breakdown. Volatility remains high given the daily ATR. Price is currently sandwiched between meaningful support around $68–69 and near-term resistance at $73–$83. Patience is warranted. The fundamental case needs the technical case to catch up before conviction positioning makes sense.
FAQ
What is the daily bias for Aehr Test Systems stock?
The daily bias remains bearish. AEHR closed at $72.01 on July 14, below both the EMA20 at $83.57 and EMA50 at $86.46. Daily RSI at 40.45 and negative MACD readings confirm sellers still hold the initiative, though the EMA200 at $58.26 provides a long-term structural floor.
What support and resistance levels matter most for AEHR?
Key support sits at the daily pivot of $71.58, with S1 at $68.85. The lower Bollinger Band at $55.02 defines the structural floor. Resistance levels include the H1 R1 at $72.99, the daily EMA20 at $83.57, and the EMA50 at $86.46. The convergence of the 15m R1 at $72.75 and H1 R1 at $72.99 creates a near-term resistance zone.
How did AEHR perform in its latest earnings?
AEHR delivered exceptional results, posting a Q4 earnings surprise of +1,200% and a revenue beat of +0.72%. CEO Gayn Erickson highlighted accelerating demand from AI processors, silicon photonics, and data center infrastructure as primary growth drivers. The company entered fiscal 2027 with a record effective backlog of approximately $100.6M.
What is Aehr Test Systems’ revenue outlook for fiscal 2027?
Management guided for fiscal 2027 revenue of $130M–$150M, representing more than a doubling of current output. This projection is supported by the record backlog and strong demand from AI and silicon photonics end markets.
Disclaimer: This article is for informational purposes only and does not constitute financial advice, an investment recommendation, or a solicitation to buy or sell any financial instrument or cryptocurrency. The analysis provided is not indicative of future results. Investing in crypto assets and financial markets carries a high risk of capital loss. Always do your own research (DYOR) and consult a qualified financial advisor before making any decision.
Article produced with the assistance of artificial intelligence and reviewed by the editorial team.
