



Micron stock sits at a technical crossroads after surging 711% over the past year. MU closed at $979.30 on July 10, hovering near the $977.14 pivot in a neutral daily regime. Yet beneath the indecision, $22 billion in customer commitments and a $100 billion backlog anchor the long-term case.
Summary
Key takeaways
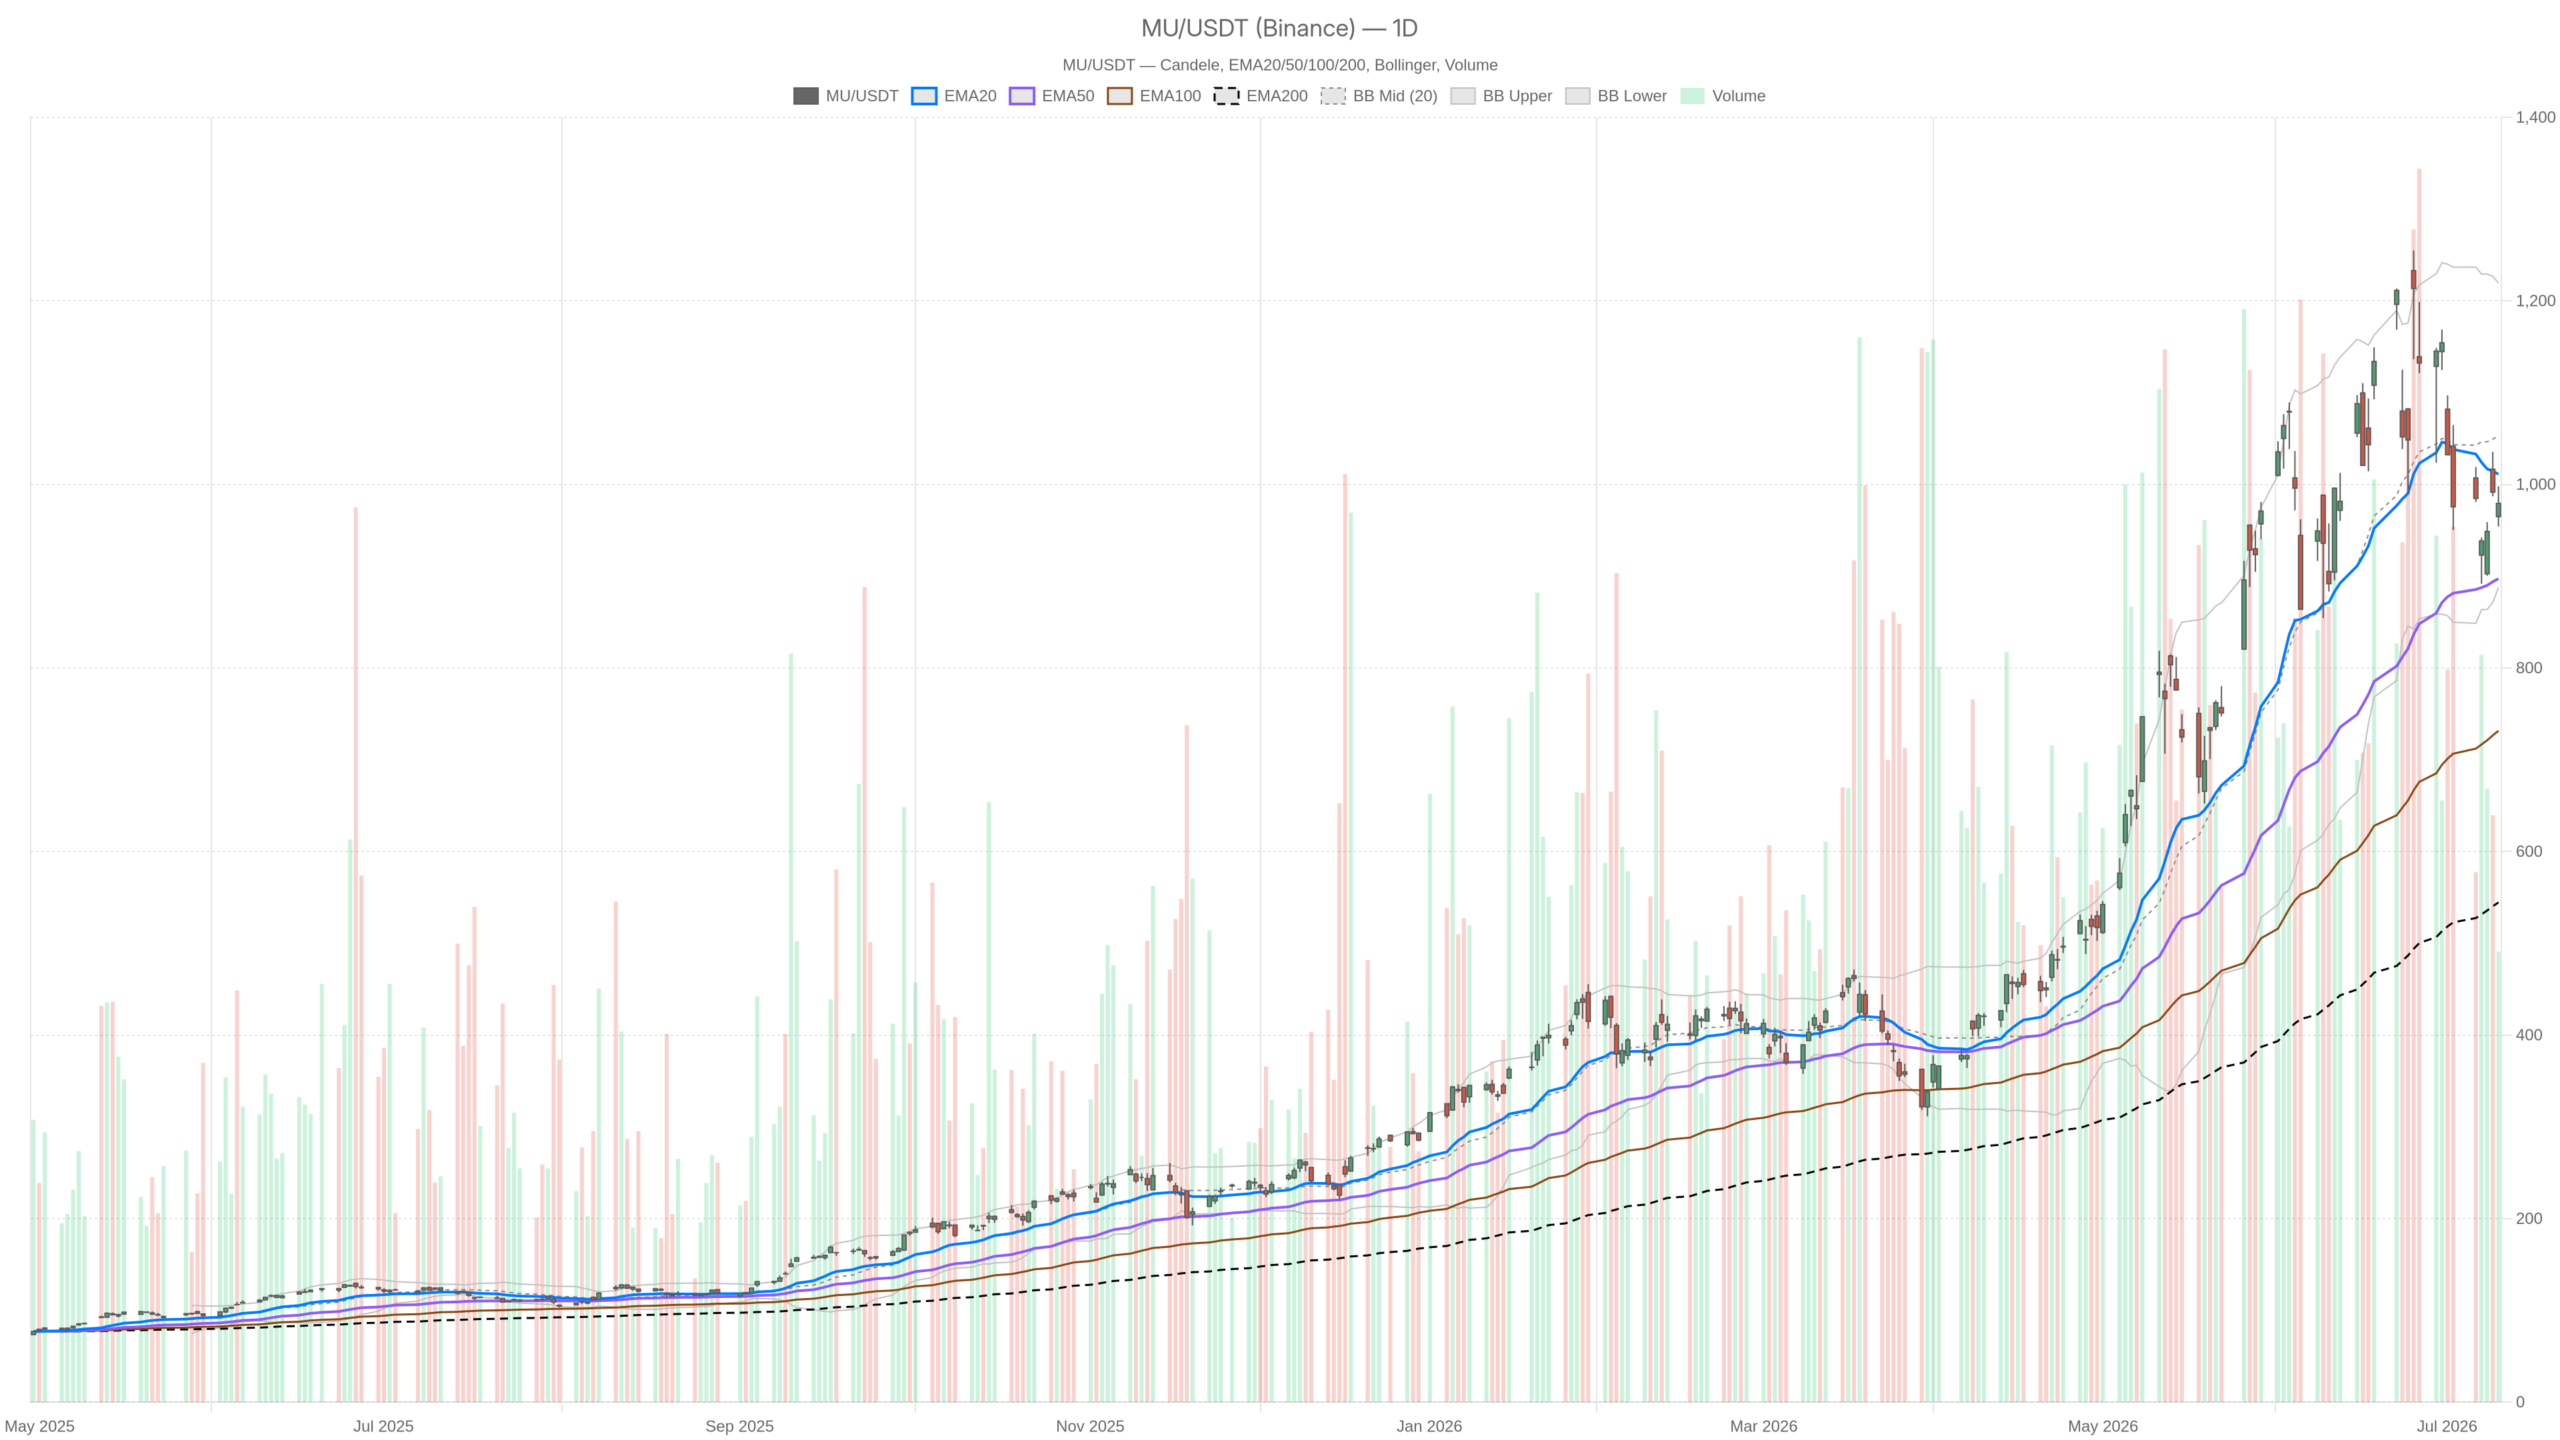
- MU closed at $979.30 on July 10, near the daily pivot at $977.14 and below the EMA20 at $1,011.13.
- The daily RSI at 49.12 confirms neutral momentum with no directional bias for Micron stock.
- Micron has secured $22 billion in customer commitments across 16 strategic agreements and a reported $100 billion long-term backlog.
- The $956–$1,011 range is the decisive zone; a breakout in either direction will set the next trend.
- Daily ATR of $98.19 signals extreme volatility remains a dominant trading condition.
Daily Timeframe: Micron Stock Structure Is Neutral, Not Broken
Micron stock’s daily structure is neutral but intact. Price at $979.30 remains well above the long-term trend anchors that powered the massive rally, even as short-term momentum fades.
Moving Average Stack Confirms the Broader Trend
Price at $979.30 sits below the EMA20 at $1,011.13 — the first meaningful headwind for Micron stock. However, the EMA50 at $897.32 and the EMA200 at $544.60 remain well below current price. This gap underscores how violently bullish the multi-month trend has been. The stock is not in a downtrend. It is simply stalling beneath its shorter-term moving average after a historic run.
Momentum Indicators Flash Caution
The daily RSI at 49.12 reinforces the neutral read. Momentum is neither oversold nor showing any clear bullish recovery push. It sits almost exactly at the midpoint, consistent with a market that has lost directional conviction. At the same time, the MACD adds a note of caution. The MACD line at 19.39 has fallen below the signal line at 47.87. The resulting histogram of -28.48 reflects deteriorating near-term momentum. This is not a collapse — but buyers have clearly stepped back from the pace set earlier in the rally.
Volatility and Pivot Levels Define the Range
Bollinger Bands place the daily midline at $1,053.56. The upper band sits at $1,219.40 and the lower band at $887.73. Price is below the midline, which typically favors the lower half of the range as the path of least resistance. Meanwhile, the ATR14 at $98.19 reflects substantial daily volatility — nearly $100 per day in average true range. That figure alone demands respect for position sizing. Daily pivots place resistance at $1,000.16 (R1) and support at $956.29 (S1), giving a tactical range to watch.
Hourly Signals Complicate the Picture
The hourly chart weakens Micron stock’s daily bias without confirming a breakdown. Short-term momentum has begun to stabilize, but key resistance remains untested.
On the 1H timeframe, MU closed at $978.69 — below both the EMA50 at $1,000.62 and the EMA200 at $996.96. That cluster of resistance just above $996–$1,001 is significant. Price needs to reclaim that zone convincingly to suggest any short-term bullish recovery is underway. The EMA20 at $984.53 is directly above current price, adding another layer of near-term friction.
However, the 1H MACD offers a modest counterpoint. The MACD line at 1.48 sits above the signal at 0.36, with a positive histogram of 1.12. That divergence from the bearish daily MACD is worth noting. It suggests very short-term momentum has begun to stabilize at the hourly level. It is not a strong bull signal, but it prevents a fully bearish short-term read. Still, the 1H RSI at 47.7 echoes the daily neutral tone. Overall, the hourly picture weakens the daily bias rather than confirming a directional break either way.
The 1H Bollinger midline sits at $980.86, with price trading fractionally below it. Resistance above comes at $989.13 (R1 pivot) and then the EMA cluster near $997–$1,001. Support rests at $972.82 (S1), with a broader floor near $918.86 at the lower Bollinger band.
Execution Context: 15-Minute Pressure
The 15-minute chart shows near-term selling pressure on Micron stock, with sellers controlling the tape as of the last reading.
Price at $978.69 sits below the EMA20 at $987.07, below the EMA50 at $985.47, and well below the EMA200 at $1,001.69. The RSI at 42.92 leans toward the bearish side of neutral. Meanwhile, the MACD histogram at 0.16 — while technically positive — is essentially flat. The ATR14 of $6.62 at this timeframe suggests intraday moves remain meaningful. The 15-minute chart is not the place to build a thesis. However, it does confirm that near-term sellers control the tape.
Bullish Scenario: The $1,200 Target Has Structural Support
Micron stock’s bullish case targets $1,200, supported by structural demand that few semiconductor peers can match. A reclaim of the $1,000–$1,011 zone would shift momentum back in favor of buyers.
The bullish case is genuinely compelling at the fundamental level. On June 24, Micron disclosed 16 strategic customer agreements carrying $22 billion in commitments to secure memory-chip supply. That is a multi-year demand anchor that removes significant revenue uncertainty. Notably, the deal with Ford, a reported $100 billion long-term backlog, and a $3 billion domestic semiconductor investment announced on July 9 make the fundamental setup look durable.
Technically, a reclaim of the $1,000–$1,011 zone — the EMA50/EMA20 cluster on the daily — would shift momentum back in the bulls’ favor. A push above $1,053 would confirm the correction is complete. It would also open a path toward the upper band near $1,219. MU’s 3-year CAGR of 152% and its position as a top holding in D.E. Shaw’s portfolio underline the long-term conviction behind the name.
Bearish Scenario: What Could Invalidate the Bull Case
The bearish case for Micron stock rests on capacity additions, potential demand shifts, and technical breakdown below $956. A close beneath that level would signal a deeper correction is underway.
On the risk side, a Seeking Alpha analysis flagged concerns that new capacity additions and hyperscaler demand shifts could pressure earnings. It questioned whether the single-digit P/E narrative is real or a mirage. DRAM and NAND cycle dynamics remain volatile. When supply tightness eases, margins can compress rapidly.
Technically, a daily close below $956.29 (S1 pivot) would breach near-term support structure. A sustained move toward $887 — the daily lower Bollinger band — would signal the correction is deeper than routine consolidation. In that scenario, the MACD’s already-negative histogram could accelerate. The daily RSI could also drop toward oversold territory, confirming trend deterioration.
Positioning, Volatility, and the Uncertainty Ahead
Micron stock sits at an inflection point where the long-term story and short-term chart are temporarily misaligned. The $956–$1,011 range is the decisive zone to watch.
The daily regime is neutral, momentum is fading, and price is below key moving averages. In contrast, the fundamental pipeline is arguably the strongest it has ever been. That tension defines the current setup precisely. With an ATR of nearly $100 on the daily frame, volatility is not a peripheral risk — it is the dominant trading condition. Therefore, a breakout above or breakdown below the $956–$1,011 range will likely set the next directional chapter for MU.
FAQ
What is the short-term outlook for Micron stock?
Micron stock is in a neutral consolidation phase on the daily chart. The RSI at 49.12 and price below the EMA20 at $1,011.13 confirm the lack of directional conviction. Until MU reclaims the $1,000–$1,011 zone, the short-term bias remains neutral-to-cautious.
What are the key support and resistance levels for MU?
Key support sits at $956.29 (S1 pivot). Below that, $887.73 marks the daily lower Bollinger band. Resistance stands at $1,000.16 (R1), followed by the EMA cluster near $1,000–$1,011 and the Bollinger midline at $1,053.56.
What fundamental catalysts support Micron’s long-term outlook?
Micron has secured $22 billion in customer commitments across 16 strategic agreements. A reported $100 billion long-term backlog, a deal with Ford, and a $3 billion domestic semiconductor investment provide structural demand visibility that few semiconductor peers can match.
What risks could derail Micron’s bull case?
New capacity additions and potential hyperscaler demand shifts could pressure earnings. DRAM and NAND cycles remain volatile, and margin compression can occur rapidly when supply tightness eases. A daily close below $956 would be the first technical warning of trend deterioration.
Disclaimer: This article is for informational purposes only and does not constitute financial advice, an investment recommendation, or a solicitation to buy or sell any financial instrument or cryptocurrency. The analysis provided is not indicative of future results. Investing in crypto assets and financial markets carries a high risk of capital loss. Always do your own research (DYOR) and consult a qualified financial advisor before making any decision.
Article produced with the assistance of artificial intelligence and reviewed by the editorial team.
