




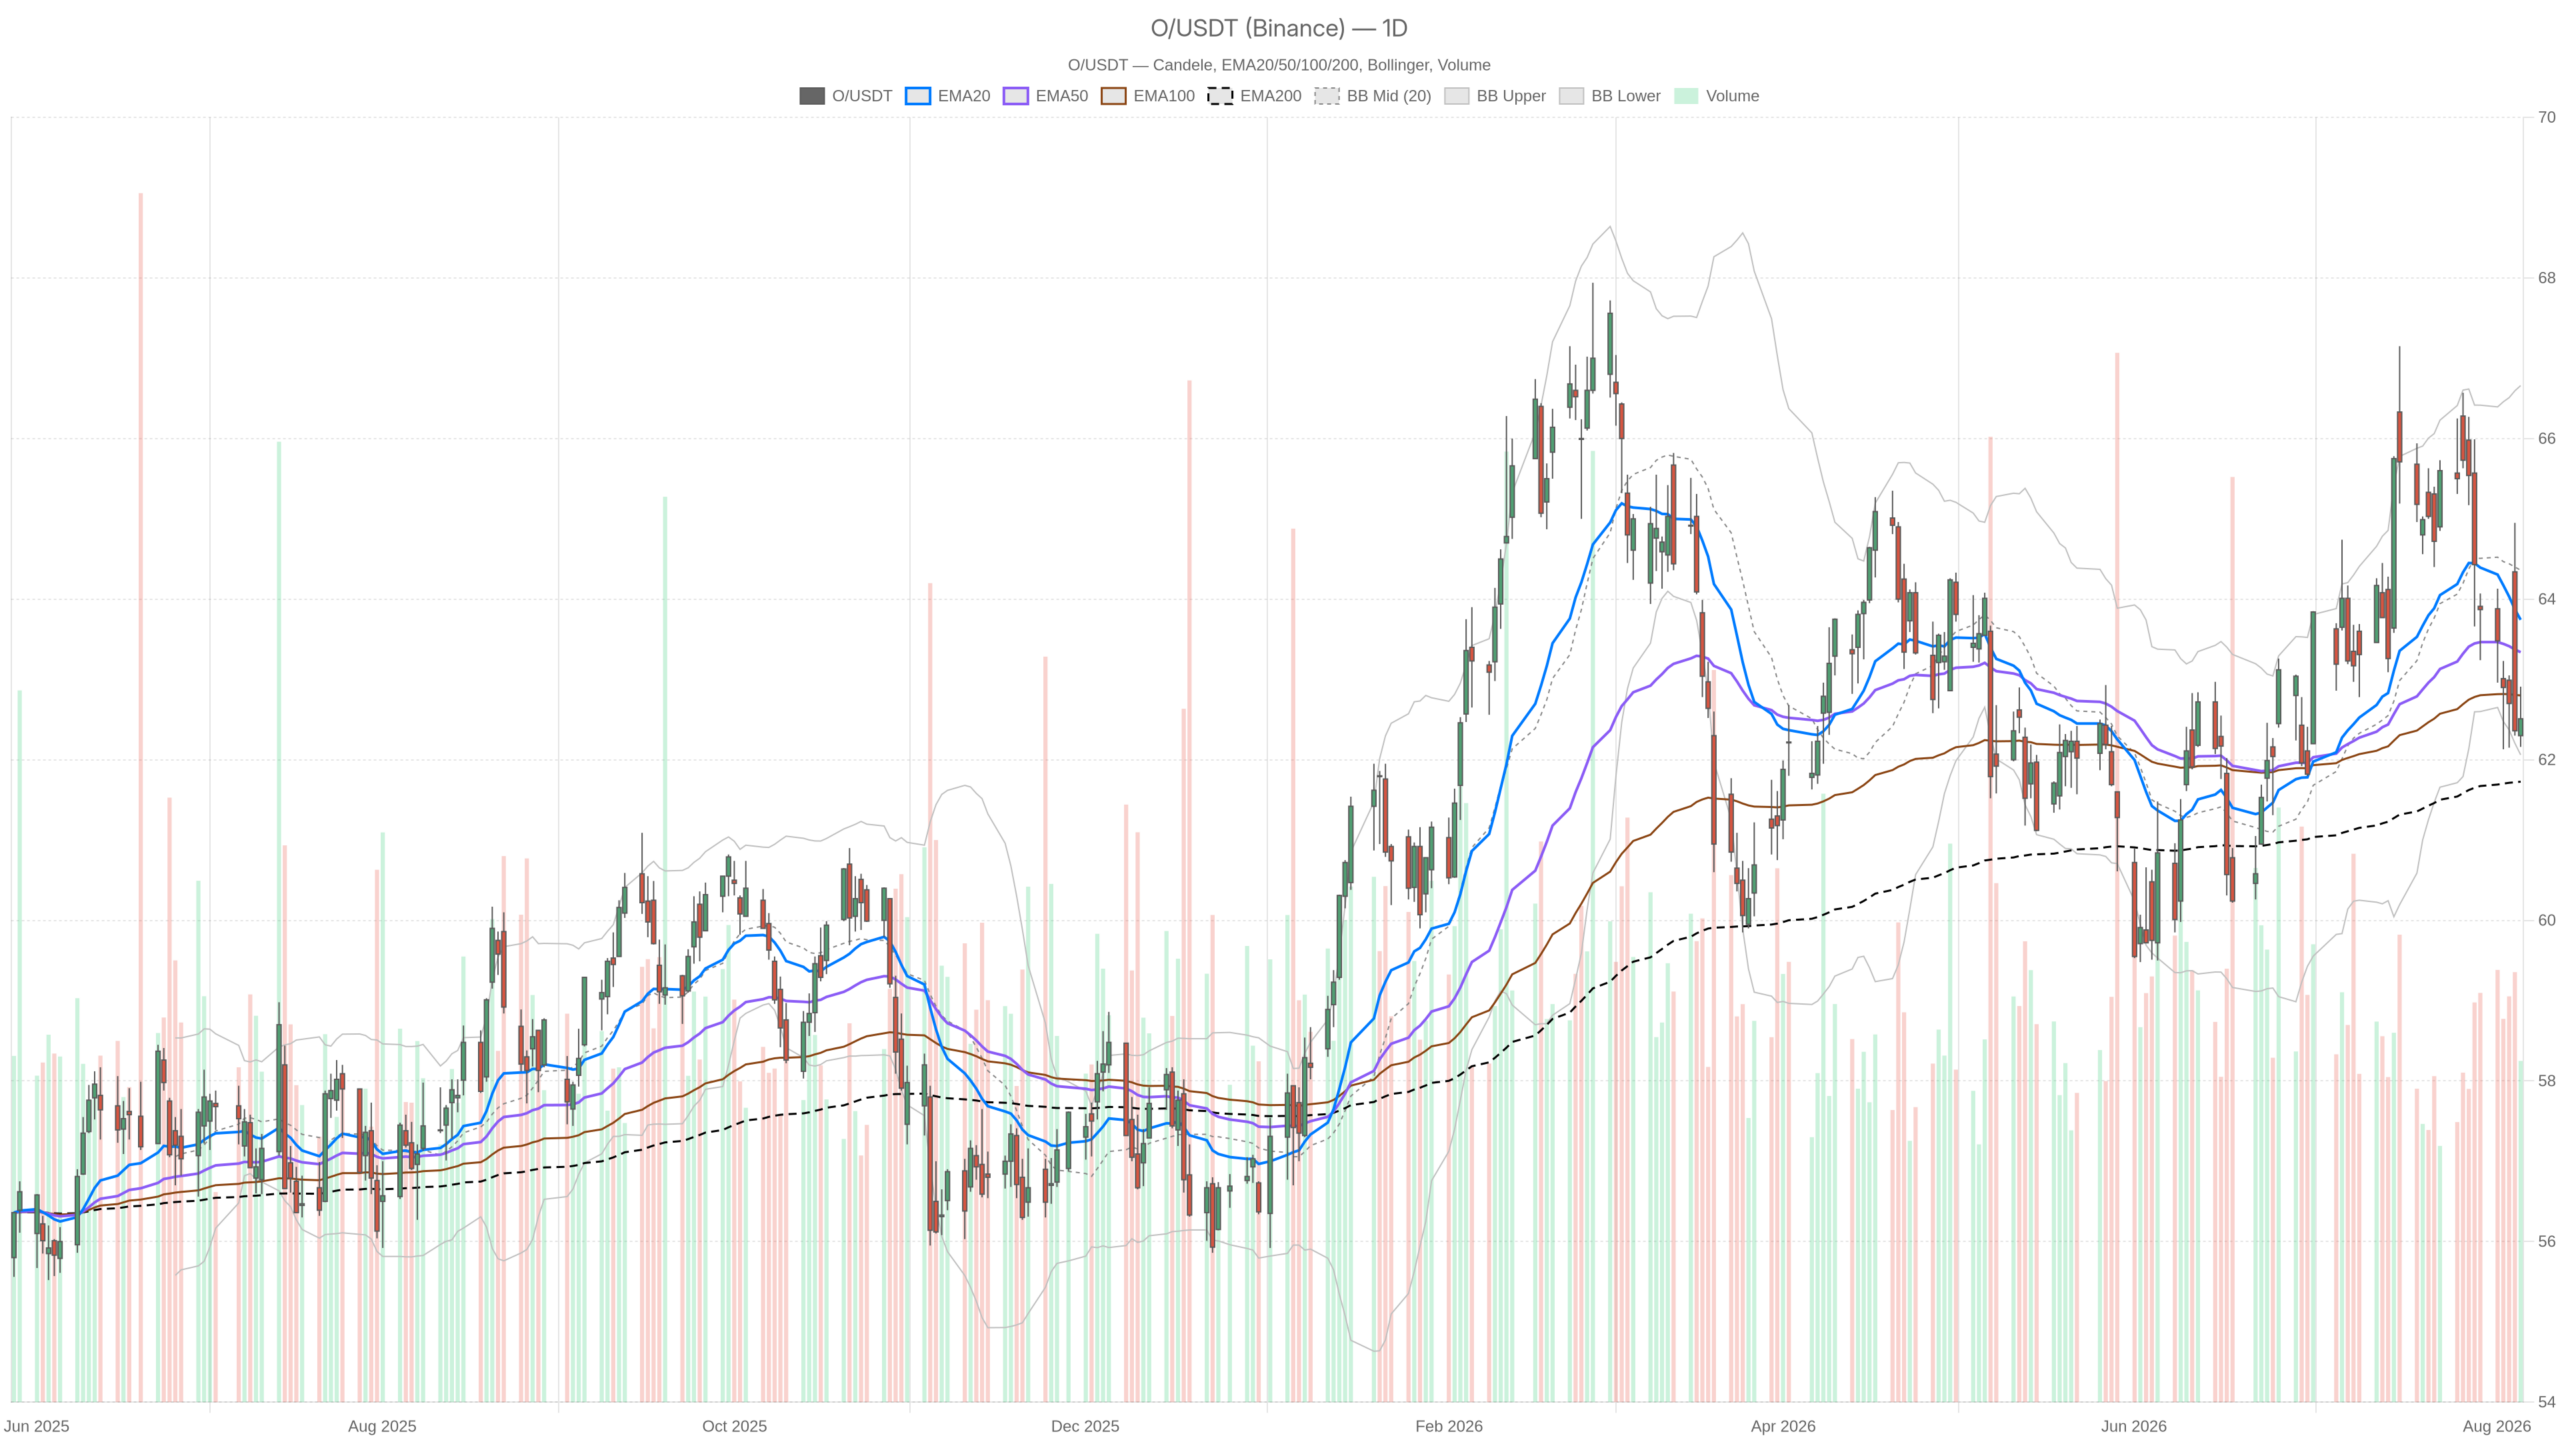
Realty Income Corporation stock is caught between improving fundamentals and a heavy tape near $62.50. At $62.51, the price sits below both the 20- and 50-period EMAs but above the 200-day line at $61.73. That defines the main bias: neutral with a corrective downside tilt, not a broken trend.
Summary
Key takeaways
- Realty Income Corporation stock closed at $62.51, below the 20- and 50-period EMAs but above the 200-day EMA at $61.73.
- Daily RSI at 40.76 and a widening negative MACD histogram confirm bearish momentum without capitulation.
- A tight support cluster sits at $62.06–$62.14, formed by the daily lower Bollinger band and the S1 pivot.
- Q2 AFFO per share grew 3.8% to $1.09, and management raised the full-year 2026 outlook.
- Recovery requires a daily close above the $63.34–$63.74 resistance zone; failure at $62.06 would open a test of the 200-day EMA.
Daily structure keeps Realty Income Corporation stock in a corrective drift
The daily chart positions Realty Income Corporation stock in a neutral corrective drift, with price compressing between 200-day EMA support and declining short-term averages. The close at $62.51 sits under the EMA20 at $63.74 and the EMA50 at $63.34. Both short-term averages remain above the long-term EMA200 at $61.73. Therefore the longer trend framework is still intact, while the medium-term one has flipped against buyers.
Meanwhile, momentum confirms the fatigue. Daily RSI at 40.76 sits in the lower half of its range without reaching oversold territory. Sellers are in control, but there is no capitulation signature here. The MACD tells a similar story. The line at -0.09 sits below its signal at 0.32, with a negative histogram of -0.42. The crossover is recent and the spread is widening. This typically points to continued pressure rather than an imminent reversal.
At the same time, volatility positioning is arguably the most informative piece. The daily Bollinger mid-band sits at $64.36, well above spot, while the lower band is at $62.06. Price is pinned against the bottom of its statistical range. Notably, the daily S1 pivot at $62.14 sits just above that lower band. Together they create a tight support cluster between roughly $62.06–$62.14. Daily ATR of $1.19 implies a typical swing near 1.9% of price. That is enough to resolve the zone in a single session.
The 1H chart weakens the case for an immediate rebound
The hourly chart shows a cleanly bearish EMA stack that makes an immediate rebound unlikely, though downside momentum is starting to decelerate. Price at $62.51 trades below the EMA20 at $62.69, the EMA50 at $63.21 and the EMA200 at $63.59. That descending sequence tells you rallies have been sold repeatedly over the past sessions. Any recovery attempt therefore has to fight through layered supply between roughly $62.70 and $63.60.
However, there is a first hint of stabilization. Hourly MACD sits at -0.16 against a signal of -0.21, producing a small positive histogram of 0.05. Downside momentum is decelerating even though the trend is still down. Hourly RSI at 42.54 is soft but not extreme. This fits a market that is grinding rather than panicking.
The hourly Bollinger range is narrow, running from $62.25 to $62.89 around a mid-band at $62.57. Combined with an hourly ATR of $0.42, this describes a low-energy market coiling near its lows. Compression of this kind often precedes an expansion move. Still, it does not tell you the direction in advance.
15m context: mechanical, not directional
The 15-minute chart offers no directional edge, showing a compressed, low-energy market useful only for intraday timing. Price closed at $62.51. The EMA20 at $62.64 and EMA50 at $62.66 are almost fused together, while the EMA200 sits far above at $63.28. Short-term averages have flattened, but the longer one still slopes against buyers. In practice, that means intraday drift with no established impulse.
Meanwhile, micro momentum is neutral-to-soft. The 15m MACD line at -0.02 sits marginally below a zero signal. RSI at 40.93 mirrors the higher timeframes. ATR of just $0.10 and a Bollinger range of $62.53 to $62.80 confirm how compressed the session has become. The shared pivot structure across 1H and 15m is tight: pivot $62.53, R1 $62.61, S1 $62.44. Those are the immediate lines that intraday participants are reacting to.
Fundamentals argue against the chart
The fundamental picture has improved markedly, yet Realty Income Corporation stock continues to trade lower. Realty Income raised its full-year 2026 outlook after reporting second-quarter AFFO per share growth of 3.8% to $1.09. Management pointed to investment activity across industrial properties, Europe, private-capital vehicles and data centers. That is a broadening of the growth engine, not a narrowing one.
At the same time, the equity is being discussed as a roughly 5%-yielding way to gain exposure to the data center build-out. Its 31-year streak of dividend increases remains a central part of the bull case. In contrast, the chart shows a stock trading below its 20- and 50-day averages. For Realty Income Corporation stock, that gap between results and market behavior usually points to rate sensitivity and sector positioning. It is not a signal of company-specific stress.
Bullish scenario
The bullish case requires defending the $62.06–$62.14 support cluster and reclaiming the $63.34–$63.74 resistance zone on a daily close. The constructive path starts with buyers holding that support band. They then need to reclaim the hourly mid-band at $62.57 and push above the pivot zone at $62.53–$62.61 on convincing volume.
The next real test is the hourly EMA20 at $62.69. After that comes the daily S1 flip, followed by a move toward the hourly EMA50 at $63.21. Confirmation would come from two sources. First, the hourly MACD histogram must continue expanding positively. Second, RSI needs to clear the mid-50s on both the 1H and daily charts. A daily close back above the EMA50 at $63.34 and the EMA20 at $63.74 would be the structural signal. That would open the path toward the daily Bollinger mid-band at $64.36. The raised guidance provides a fundamental rationale for that kind of mean reversion.
Bearish scenario
The bearish case remains the path of least resistance. A break below $62.06 would open a test of the 200-day EMA at $61.73. A decisive daily close below $62.06 would break both the lower Bollinger band and the S1 pivot at $62.14. That would put the daily EMA200 at $61.73 directly in play as the last major trend reference. Losing that level would shift the daily regime from neutral to outright bearish.
Meanwhile, the bullish scenario is invalidated well before that point. Repeated failures at the hourly EMA20 near $62.69, with the negative daily MACD histogram deepening, would confirm that supply still dominates. With a daily ATR of $1.19, a single wide-range session could travel from the current pivot area to below the 200-day average. Traders should respect that asymmetry while price sits this close to structural support.
Positioning and uncertainty
Overall, this is a genuinely mixed market. The decision point is narrow, the fundamentals are improving, and compressed volatility points to a sharp resolution ahead. The daily regime is neutral, the intraday regimes are bearish, and momentum is negative but stabilizing at the margin. Volatility has compressed across all three timeframes. That raises the odds of a sharp resolution rather than a slow one.
The decision point is narrow and well defined. The $62.06–$62.14 band separates a corrective pullback from a genuine trend change. Meanwhile, the $63.34–$63.74 zone caps any recovery attempt. Until one of those zones breaks on a daily close, Realty Income Corporation stock remains a range problem. The fundamental backdrop is improving, but the technical picture is unresolved. Position sizing matters more than direction in that environment.
FAQ
What is the support level for Realty Income Corporation stock?
The key support cluster sits at $62.06–$62.14, formed by the daily lower Bollinger band and the S1 pivot. Below that, the 200-day EMA at $61.73 serves as the last major trend reference.
What are the key resistance levels?
Realty Income Corporation stock faces layered resistance starting at the hourly EMA20 near $62.69, extending through the hourly EMA50 at $63.21, and culminating at the daily EMA50 and EMA20 between $63.34 and $63.74.
What did the latest earnings show?
Realty Income reported second-quarter AFFO per share growth of 3.8% to $1.09 and raised its full-year 2026 outlook. Management highlighted investment activity across industrial properties, Europe, private-capital vehicles and data centers.
Is the trend bullish or bearish for Realty Income Corporation stock?
The daily regime is neutral with a corrective downside tilt. Intraday timeframes are bearish, but the 200-day EMA at $61.73 remains intact. Resolution awaits a daily close above $63.74 or below $62.06.
Disclaimer: This article is for informational purposes only and does not constitute financial advice, an investment recommendation, or a solicitation to buy or sell any financial instrument or cryptocurrency. The analysis provided is not indicative of future results. Investing in crypto assets and financial markets carries a high risk of capital loss. Always do your own research (DYOR) and consult a qualified financial advisor before making any decision.
Article produced with the assistance of artificial intelligence and reviewed by the editorial team.
