



Sandisk Corporation stock dropped sharply after earnings, closing at 1350.5 despite beating estimates. EPS surprised by +14.63% and revenue by +8.01%, with sales up 51% quarter-over-quarter on AI-driven NAND tailwinds. The market, however, focused on disappointing forward guidance over strong results.
Summary
Key takeaways
- Sandisk Corporation stock tumbled from an open of 1399.94 to close at 1350.5 after its latest earnings release
- The company delivered an EPS beat of +14.63% and a revenue beat of +8.01% for the quarter ended June 2026
- Revenue surged 51% quarter-over-quarter, fueled by AI-driven NAND demand tailwinds
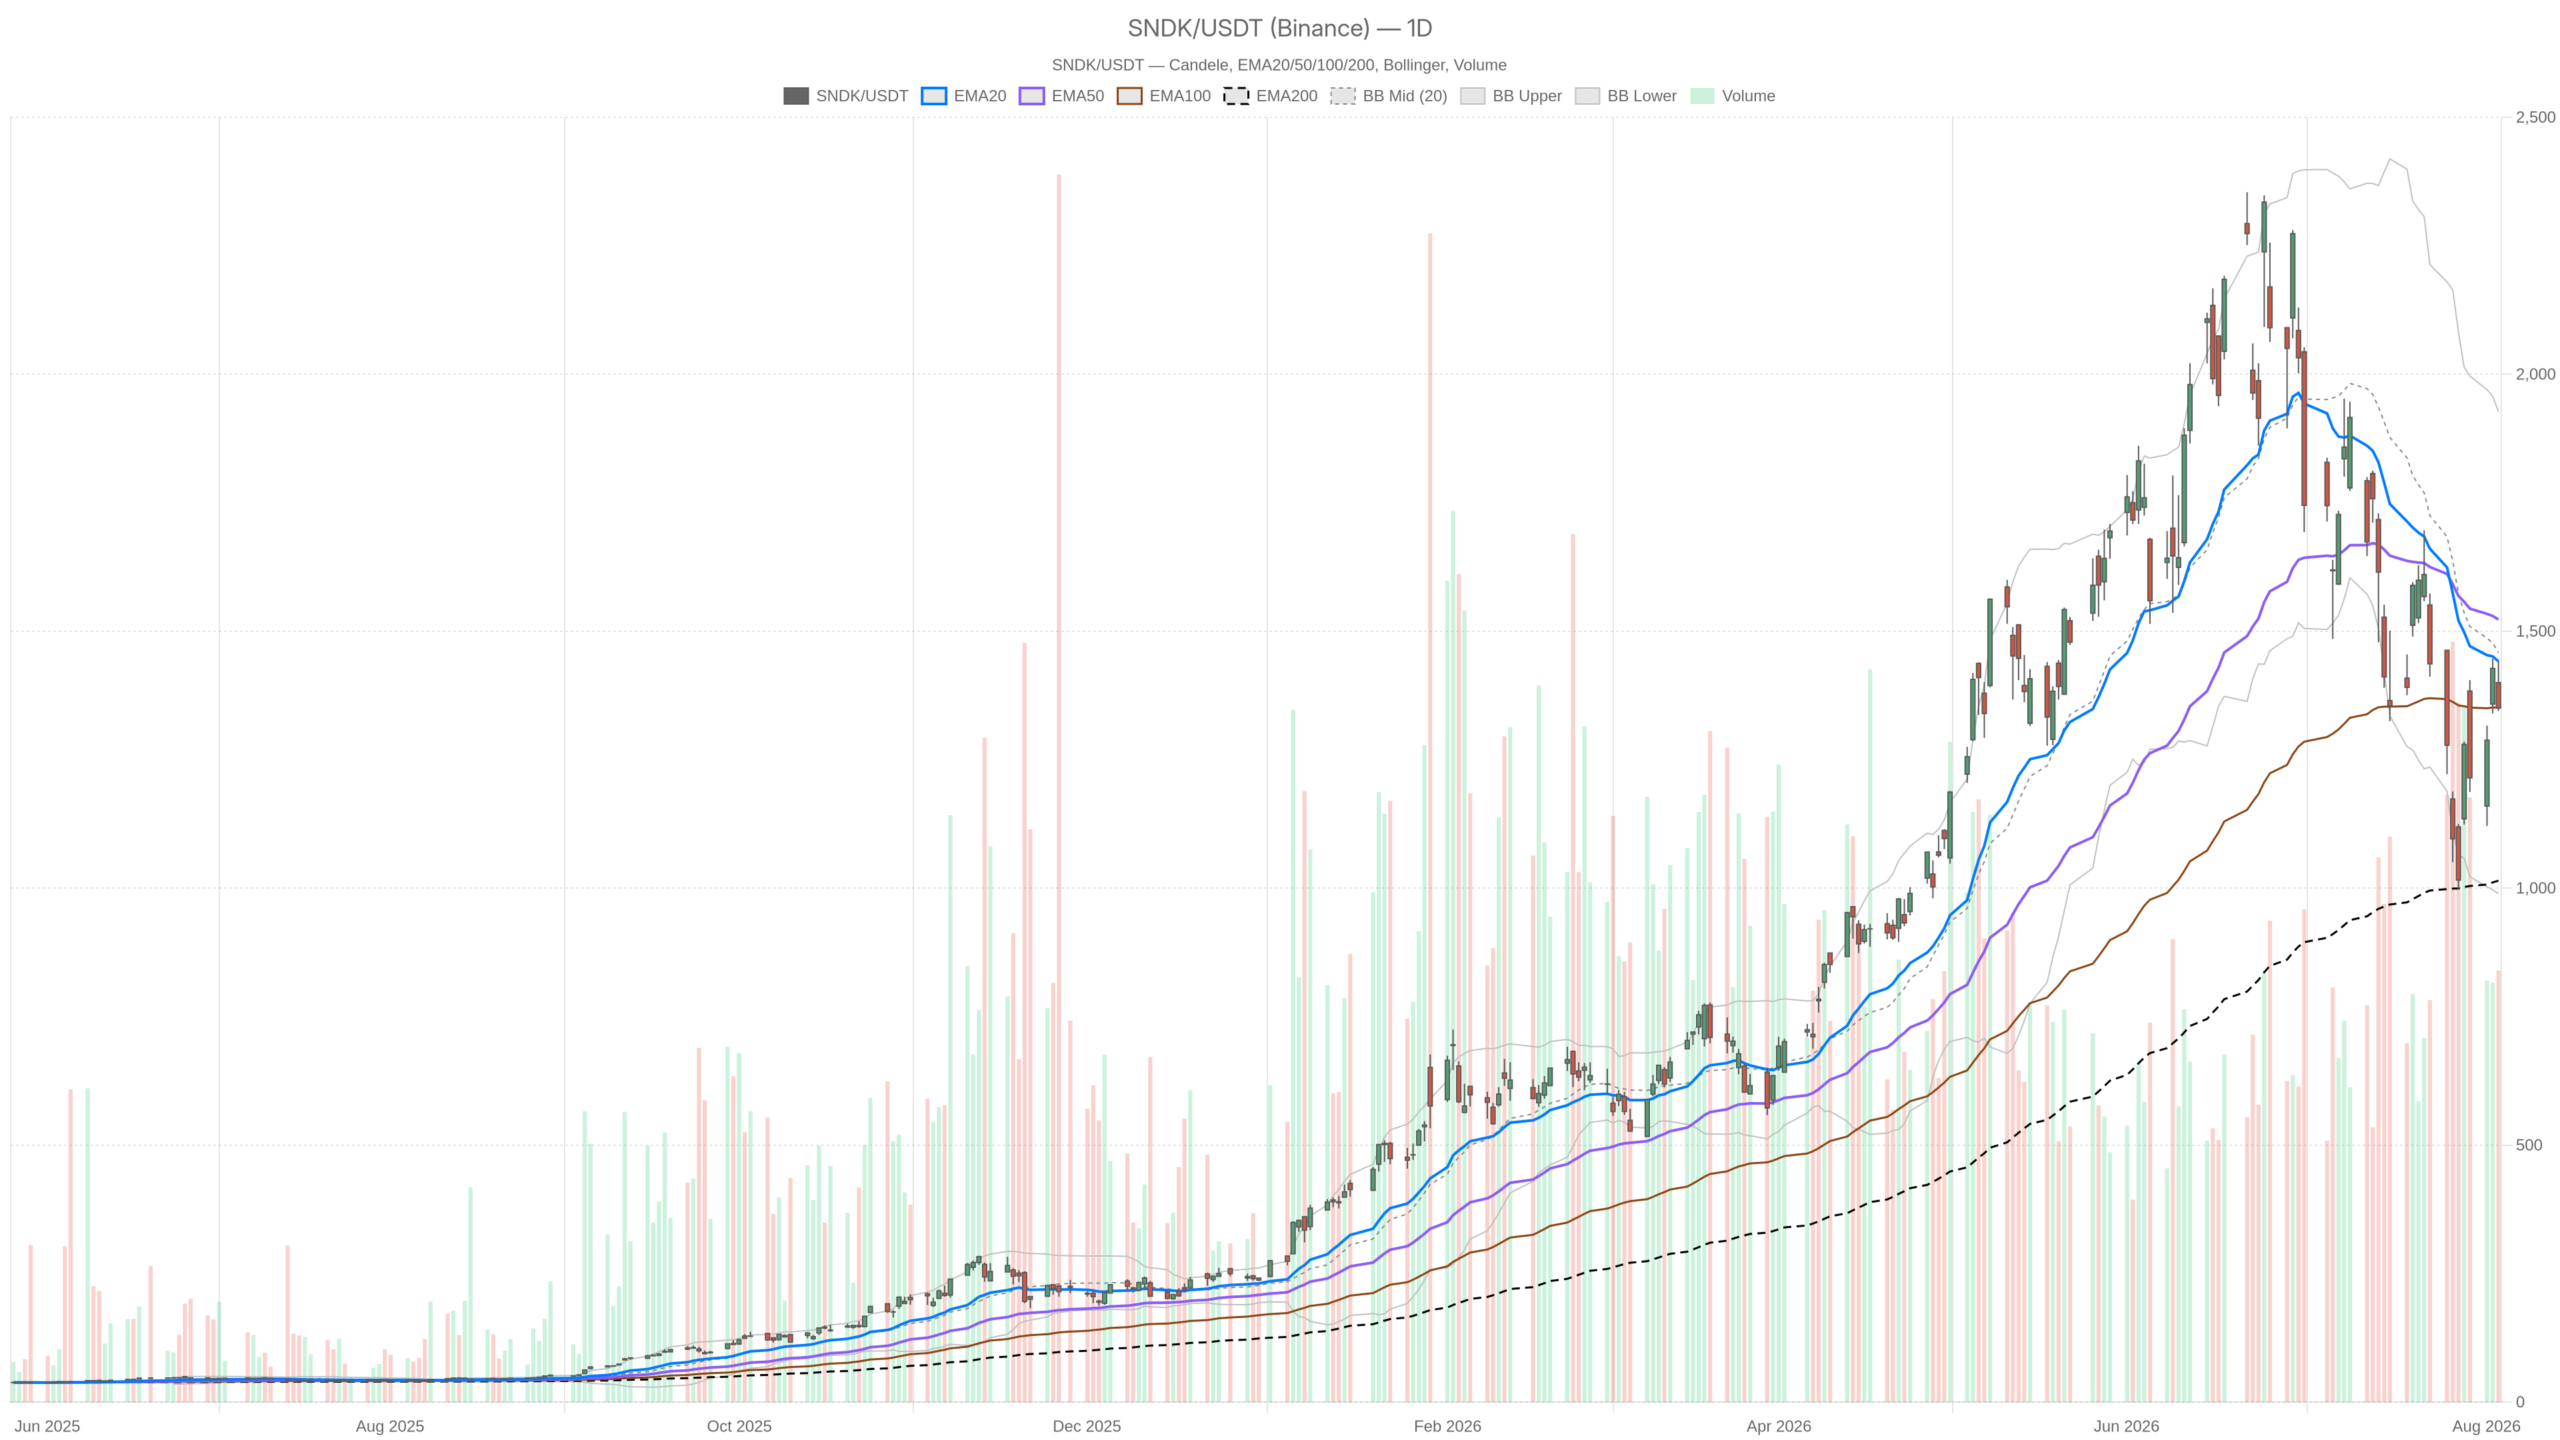
- Daily price closed below both the EMA20 at 1441.43 and EMA50 at 1522.70, signaling negative short-term momentum
- The 15-minute RSI14 reached oversold territory at 29.64, opening the door for a potential relief bounce
Daily Trend: A Correction Inside a Larger Uptrend
Sandisk Corporation stock is in a correction, not a long-term reversal. Short-term momentum has turned negative, but the broader uptrend remains structurally intact thanks to the EMA200.
Moving Average Structure Still Favors Bulls
Price closed well below the EMA20 at 1441.43 and the EMA50 at 1522.70 on the daily chart. This clearly signals negative short-term momentum. However, the EMA200 sits far below at 1014.71, meaning the broader uptrend remains technically intact. The stock is therefore correcting within a larger bullish structure, not reversing it.
Momentum Indicators Hint at Decelerating Selling
The daily RSI14 at 45.55 sits in neutral territory, leaning slightly bearish but not flashing exhaustion. MACD paints a more nuanced picture. The line reads -126.96 against a signal of -126.80, which is technically bearish. Yet the histogram has narrowed to just -0.17. That near-flat reading suggests downside momentum is decelerating, even if the trend remains negative for now.
Bollinger Bands are wide after the earnings-driven volatility spike. The mid-band sits at 1458.23, with the upper at 1927.33 and the lower at 989.13. Price currently trades below the midline, consistent with the corrective tone across timeframes.
Similarly, pivot levels reinforce the cautious picture. The daily pivot stands at 1379.09, with resistance at 1413.17 and support at 1316.41. Price closing near 1350 places it between those markers, in a zone that still needs to prove direction. ATR14 at 175.93 confirms elevated volatility, so swings in either direction should be expected.
Hourly Momentum Confirms Near-Term Weakness
The hourly chart echoes the daily bias: Sandisk faces near-term selling pressure, but the structure is not collapsing. Price sits in a tight zone between short-term resistance and support.
Price closed at 1345, below the EMA20 at 1367.74 but still above the EMA50 at 1335.50. This narrow band defines the immediate battleground. Meanwhile, the EMA200 on this timeframe sits far above at 1526.83. That gap underscores how abrupt the recent decline has been relative to the hourly trend history.
RSI14 on the hourly chart reads 48.98, essentially neutral and offering no strong directional conviction. MACD, however, leans bearish. The line at 36.17 sits below the signal at 44, producing a histogram of -7.84. This points to fading upside momentum at the hourly level. It confirms the corrective daily structure rather than contradicting it. The hourly pivot at 1361.78, with resistance at 1378.56 and support at 1328.22, gives traders a practical short-term battleground to monitor.
15-Minute Chart: Oversold Conditions Could Spark a Bounce
Sandisk Corporation stock looks stretched to the downside on the 15-minute timeframe. Oversold readings and a break below the lower Bollinger Band point to a potential relief bounce, even if the broader bias remains corrective.
Price closed at 1345 after dropping from 1378.08. RSI14 has fallen to 29.64, firmly in oversold territory. At the same time, price trades below the lower Bollinger Band at 1371.16, with the mid at 1406.46 and the upper at 1441.77. This combination typically signals that a short-term move has become extended and vulnerable to a snapback.
MACD on this timeframe remains bearish. The line reads -7.62, below the signal at -0.68, with a histogram of -6.94. However, oversold RSI readings alongside a lower-band break often precede at least a technical pause in selling pressure. The 15-minute pivot at 1357, with resistance at 1368.99 and support at 1333, offers useful execution markers for short-term traders.
Bullish Scenario for Sandisk Corporation Stock
The bullish case hinges on the oversold bounce gaining traction across higher timeframes. Price would need to reclaim key levels to confirm the correction is fading.
A bullish reversal for Sandisk Corporation stock requires price to reclaim the hourly EMA20 near 1367.74. It must then hold above the daily pivot at 1379.09. That sequence would confirm the oversold bounce seen on the 15-minute chart is translating into something more durable across higher timeframes.
Fundamentally, the setup has support. Sandisk’s $14B buyback announcement provides a structural tailwind. The AI-driven NAND supercycle narrative adds another layer. So does the newly unveiled HBF roadmap for QLC/TLC SSD ramp. Analyst sentiment has also shifted positively in some quarters, with upgrades tied specifically to AI catalysts. If price stabilizes above the daily EMA20 at 1441.43, that would be a stronger signal. It would suggest the correction is fading and the longer-term uptrend is reasserting itself.
Bearish Scenario for Sandisk Corporation Stock
The bearish case centers on the disappointing guidance that triggered this selloff. If price fails to reclaim key near-term levels, deeper downside could follow.
Coverage from Seeking Alpha noted that mixed guidance overshadowed otherwise strong Q4 results. The numbers could have been better given the magnitude of the AI-driven revenue surge. Technically, a failure to reclaim the hourly EMA20 would be the first warning. A breakdown below daily support at 1316.41 would then open the door to deeper losses.
The daily MACD remains negative. While the histogram has narrowed, a renewed widening to the downside would confirm sellers are back in control. In that scenario, the wide daily Bollinger Bands become relevant. With the lower boundary near 989.13, substantial room exists below current levels if momentum deteriorates further.
Closing Thoughts
Sandisk Corporation stock sits at a technical crossroads after a violent post-earnings reaction. The daily and hourly timeframes both point to a corrective, momentum-fading environment. Meanwhile, the 15-minute chart shows oversold conditions that could fuel a short-term bounce.
The fundamental backdrop remains constructive. Buybacks, AI-linked NAND demand, and a newly announced product roadmap all provide support. Yet guidance concerns continue to cloud the near-term picture. Given elevated ATR readings across timeframes, volatility is likely to stay high. Positioning should account for the uncertainty embedded in this transition phase between correction and potential trend continuation.
FAQ
What caused Sandisk Corporation stock to drop after earnings?
Despite beating EPS estimates by +14.63% and revenue by +8.01%, the market focused on disappointing forward guidance. Revenue surged 51% quarter-over-quarter on AI-driven NAND tailwinds, but the outlook failed to convince investors. Shares fell from an open of 1399.94 to close at 1350.5.
Is Sandisk Corporation stock still in a long-term uptrend?
Yes, technically. While price has fallen below the EMA20 at 1441.43 and EMA50 at 1522.70, the EMA200 sits far below at 1014.71. This confirms the broader uptrend structure remains intact, with the current move classified as a correction rather than a reversal.
What are the key support and resistance levels for SNDK?
Key support sits at 1316.41, with the lower daily Bollinger Band at 989.13. Resistance stands at the daily pivot of 1379.09, followed by the EMA20 at 1441.43. The hourly chart offers additional markers: support at 1328.22 and resistance at 1378.56.
What fundamental catalysts support Sandisk Corporation stock?
Sandisk’s $14B buyback announcement, the AI-driven NAND supercycle narrative, and the newly unveiled HBF roadmap for QLC/TLC SSD ramp all provide structural tailwinds. Analyst upgrades tied specifically to AI catalysts have also shifted sentiment positively in some quarters.
Disclaimer: This article is for informational purposes only and does not constitute financial advice, an investment recommendation, or a solicitation to buy or sell any financial instrument or cryptocurrency. The analysis provided is not indicative of future results. Investing in crypto assets and financial markets carries a high risk of capital loss. Always do your own research (DYOR) and consult a qualified financial advisor before making any decision.
Article produced with the assistance of artificial intelligence and reviewed by the editorial team.
