




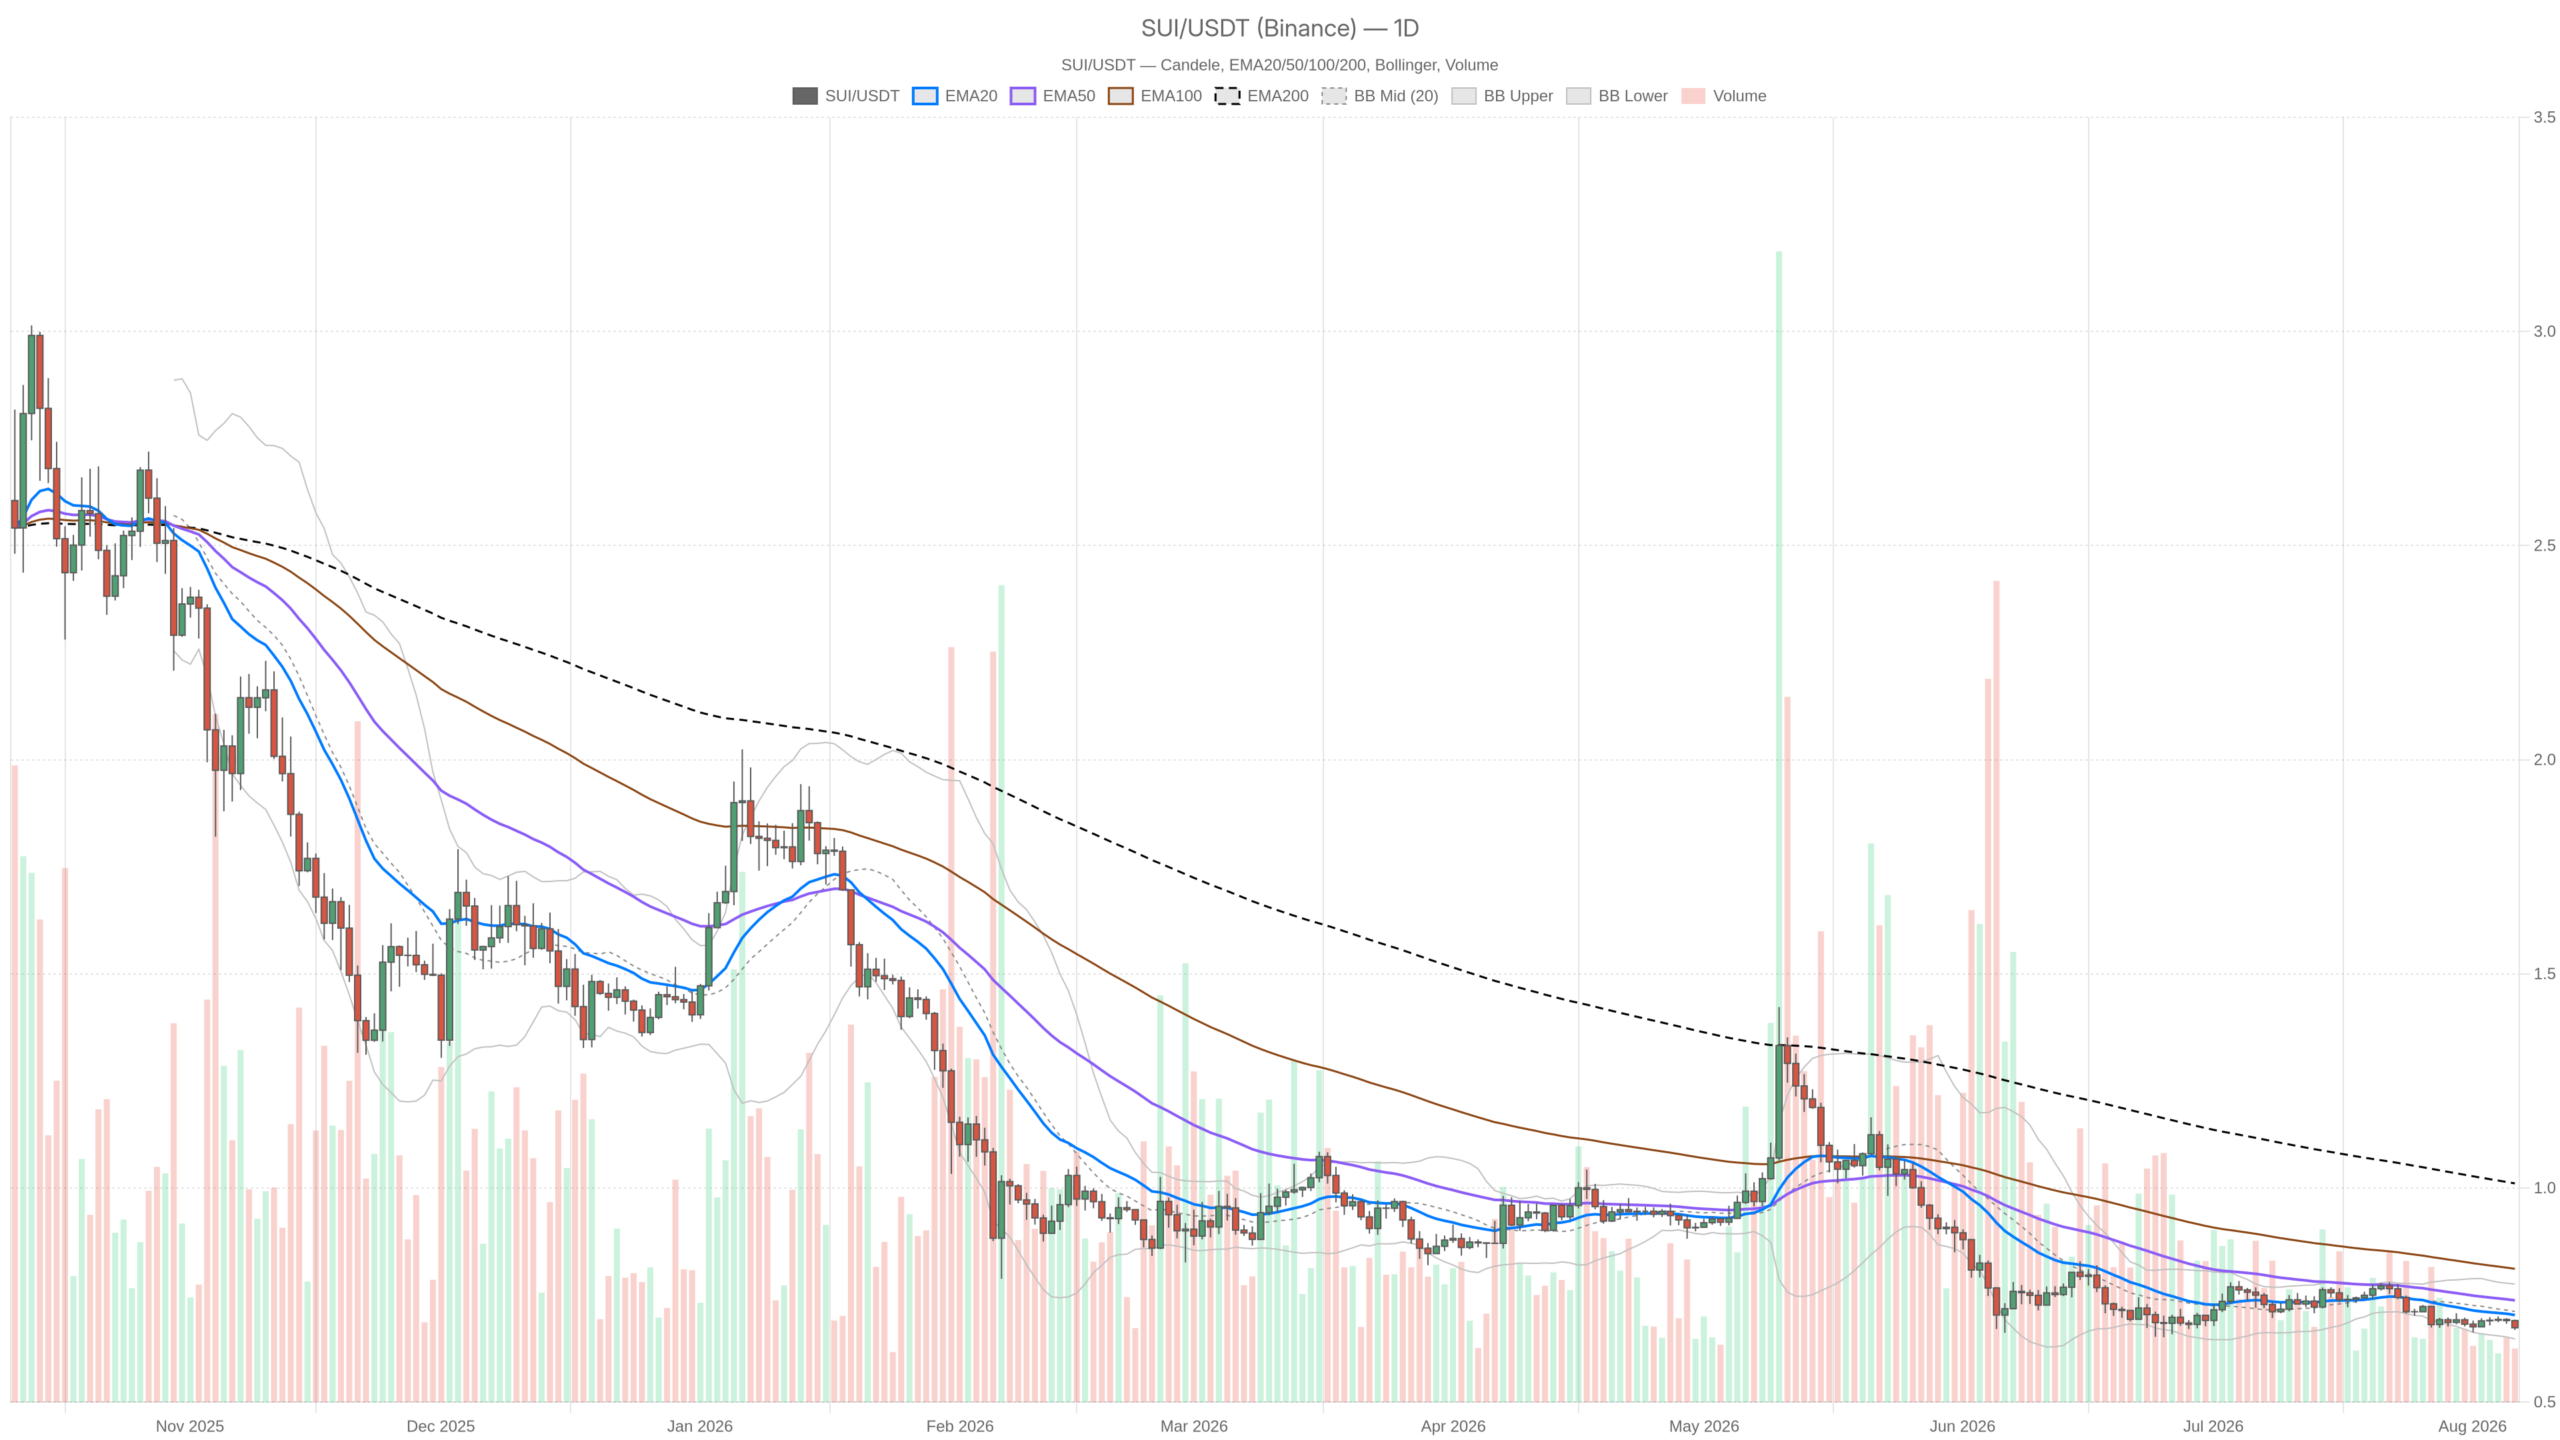
Bearish structure dominates SUI/USDT after the pair closed at $0.67 on August 6, 2026, leaving Sui crypto trapped beneath the daily EMA200 at $1.01. With the Fear & Greed Index at 25, the market shows no sign of reversing course yet.
Summary
Key takeaways
- SUI/USDT closed at $0.67 on August 6, 2026, trading below all major daily EMAs.
- The EMA200 sits at $1.01, exposing a deep structural downtrend from prior valuations.
- Fear & Greed Index at 25 signals Extreme Fear across the broader crypto market.
- Daily RSI14 at 37.84 leaves room for further selling before oversold conditions appear.
- The $0.66–$0.70 range will likely determine the next directional move.
Daily Chart Shows a Textbook Bearish Stack
The daily timeframe leaves no room for ambiguity. SUI/USDT is in a confirmed downtrend with every major moving average aligned bearishly.
Price closed at $0.67 against an EMA20 of $0.70, an EMA50 of $0.74, and an EMA200 of $1.01. That gap to the EMA200 reveals a sustained decline that has eroded significant ground over time. RSI14 at 37.84 is soft but not yet oversold, meaning sellers still have room to push before the market becomes technically stretched. MACD remains negative with the line at -0.02 below the signal at -0.01. The histogram is flat, yet the negative alignment confirms downside momentum has not reversed.
Bollinger Bands on the daily chart reinforce the bearish lean. The mid-band sits at $0.71, the upper at $0.78, and the lower at $0.65. Price hugs the lower half of the band, leaning on support rather than testing resistance. Moreover, daily ATR14 of $0.02 suggests volatility has calmed relative to the recent decline, hinting at consolidation before the next real move. The daily pivot sits at $0.68, with R1 at $0.69 and S1 at $0.66, defining the current battleground.
Lower Timeframes Confirm, Not Contradict
The 1-hour and 15-minute charts offer no relief for bulls. Both align cleanly with the bearish structure visible on the daily.
On the 1-hour chart, EMA20, EMA50 and EMA200 are all bunched around $0.69, while price at $0.67 trades beneath the entire cluster. RSI14 at 27.05 sits firmly in oversold territory, which normally hints at a short-term bounce attempt. However, MACD flat at zero offers no fresh momentum trigger to back that bounce. The 1H pivot at $0.67 with S1 also at $0.67 shows just how compressed things have become. Support and pivot nearly overlap, which often precedes a volatility expansion in one direction or the other.
Zooming into the 15-minute chart, the picture stays consistent. EMA20 and EMA50 both sit at $0.68, while EMA200 holds at $0.69. RSI14 at 33.18 leans bearish but does not signal capitulation. This lower timeframe is useful only for execution. It confirms the same downward lean seen on the 1H and daily without adding a new argument. When all three timeframes agree this cleanly, the path of least resistance remains down until something structural changes.
What Would Flip the Script
A reclaim of the $0.69–$0.70 zone is the minimum requirement for any credible bullish pivot in the Sui crypto market.
That zone is where the daily pivot resistance at R1 $0.69 meets the cluster of EMAs on lower timeframes. A close above the daily EMA20 at $0.70 would mark the first real signal that sellers are losing control. RSI pushing above the 40–50 range and MACD histogram turning positive would add confirmation. Until that happens, any bounce off oversold RSI readings on the 1H chart should be treated as a relief move within a downtrend, not a reversal.
The bearish case is more straightforward. A break below daily S1 at $0.66 opens the door toward the lower Bollinger Band at $0.65. From there, the gap toward the EMA50 at $0.74 and EMA200 at $1.01 becomes largely irrelevant until price proves it can reclaim the $0.70 handle. What invalidates the bearish scenario is exactly the bullish trigger above: a decisive daily close back above $0.70. Conversely, a failed retest of that same zone followed by rejection under $0.67 would suggest the range is merely distribution before another drop.
Ecosystem Weakness Adds to the Headwinds
Broader sentiment and on-chain data from the Sui ecosystem reinforce the bearish picture rather than offering reasons for a contrarian bet.
The Fear & Greed Index sits at 25, classified as Extreme Fear. This kind of sentiment reading tends to coincide with either capitulation lows or extended sideways grinds. It rarely marks a confidence peak. Meanwhile, total crypto market cap stands around $2.285 trillion, up a modest 0.52% over 24 hours, while Bitcoin dominance holds at 56.72%. That dominance level tells its own story: capital remains concentrated in BTC rather than rotating into altcoins, making independent strength for SUI/USDT harder to achieve.
On-chain activity within the Sui ecosystem paints a mixed picture at best. Among DEX protocols, Momentum showed a sharp 40.74% jump in daily fees even as its 30-day trend remains negative at -6.09%. Cetus CLMM, DeepBook V3, and Turbos all posted steep declines.
DeepBook V3 fees are down 55.69% over seven days and 69.3% over thirty, while Cetus CLMM dropped 30.06% weekly and 62% monthly. Bluefin Spot managed a small 8.9% daily uptick but remains down double digits over both the week and month. That is not a picture of an ecosystem attracting fresh demand. Rather, it reflects activity thinning alongside price weakness.
None of this locks in a single outcome. SUI/USDT trades in a market where every timeframe agrees on bearish structure, sentiment is at extreme fear, and on-chain fee data across the Sui ecosystem is broadly softening. However, oversold RSI on the 1H chart and calmer ATR readings on the daily suggest selling pressure may be losing some steam.
This is exactly the kind of setup that can produce sharp, short-lived bounces trapping late entries on either side. Volatility compression near the $0.67–$0.68 zone will not last forever. Whichever way it resolves is likely to move fast given how tight the range has become.
FAQ
What is the current price of SUI/USDT?
SUI/USDT closed at $0.67 on August 6, 2026. The pair trades below its EMA20 at $0.70, EMA50 at $0.74, and EMA200 at $1.01 on the daily chart.
Is SUI/USDT in a bearish trend right now?
Yes. Every major moving average on the daily, 1-hour, and 15-minute charts aligns bearishly. RSI14 on the daily sits at 37.84 and the Fear & Greed Index registers 25, classified as Extreme Fear.
What would signal a bullish reversal for SUI/USDT?
A decisive daily close above the $0.69–$0.70 zone would be the first credible signal. This area represents the confluence of daily pivot resistance and the EMA cluster on lower timeframes. RSI pushing above 40–50 with MACD histogram turning positive would add confirmation.
How is on-chain activity on the Sui network performing?
Mixed to weak. While Momentum DEX posted a 40.74% daily fee jump, most protocols are declining sharply. DeepBook V3 fees fell 55.69% weekly, Cetus CLMM dropped 30.06%, and Bluefin Spot remains down double digits across weekly and monthly timeframes.
Disclaimer: This article is for informational purposes only and does not constitute financial advice, an investment recommendation, or a solicitation to buy or sell any financial instrument or cryptocurrency. The analysis provided is not indicative of future results. Investing in crypto assets and financial markets carries a high risk of capital loss. Always do your own research (DYOR) and consult a qualified financial advisor before making any decision.
Article produced with the assistance of artificial intelligence and reviewed by the editorial team.
