




With the price hovering near $62,734 on July 13, 2026, Bitcoin at a Crossroads: Bears Hold the Structure While MACD Hints at Relief — macro headwinds and a Fear & Greed reading of 28 keep sentiment firmly defensive.
Summary
Key takeaways
- Bitcoin trades at $62,734, pinned below the EMA20 ($62,965) and EMA50 ($65,188) on the daily chart.
- The daily MACD histogram stands at +425.95, signaling that bearish momentum is losing steam rather than accelerating.
- The Fear & Greed Index reads 28, while Bitcoin dominance holds at 56.03% as capital rotates defensively within crypto.
- Strategy raised its Bitcoin reserve to $3 billion through a fresh stock sale, reinforcing institutional conviction.
- The daily pivot at $63,086 must be reclaimed for any bullish shift; failure opens the path toward $58,397.
Bitcoin Under Pressure — But Not Without a Lifeline
Bitcoin remains under structural bearish pressure but has not lost its institutional lifeline. Strategy — Michael Saylor’s firm — just raised its reserve to $3 billion through a fresh stock sale, a reminder that institutional conviction has not evaporated even as the charts turn hostile. Bloomberg reported earlier today that BTC is weakening as an oil-price spike revives inflation concerns, compounding an already fragile sentiment picture.
The dominant force right now is distribution pressure meeting a potential exhaustion point. However, the bears have controlled the trend for weeks while momentum indicators are quietly starting to diverge. That divergence is not a green light — it is a yellow flag. Before treating it as a reversal signal, the structure needs to confirm it.
Daily Timeframe: Bearish Regime, Compressed Momentum
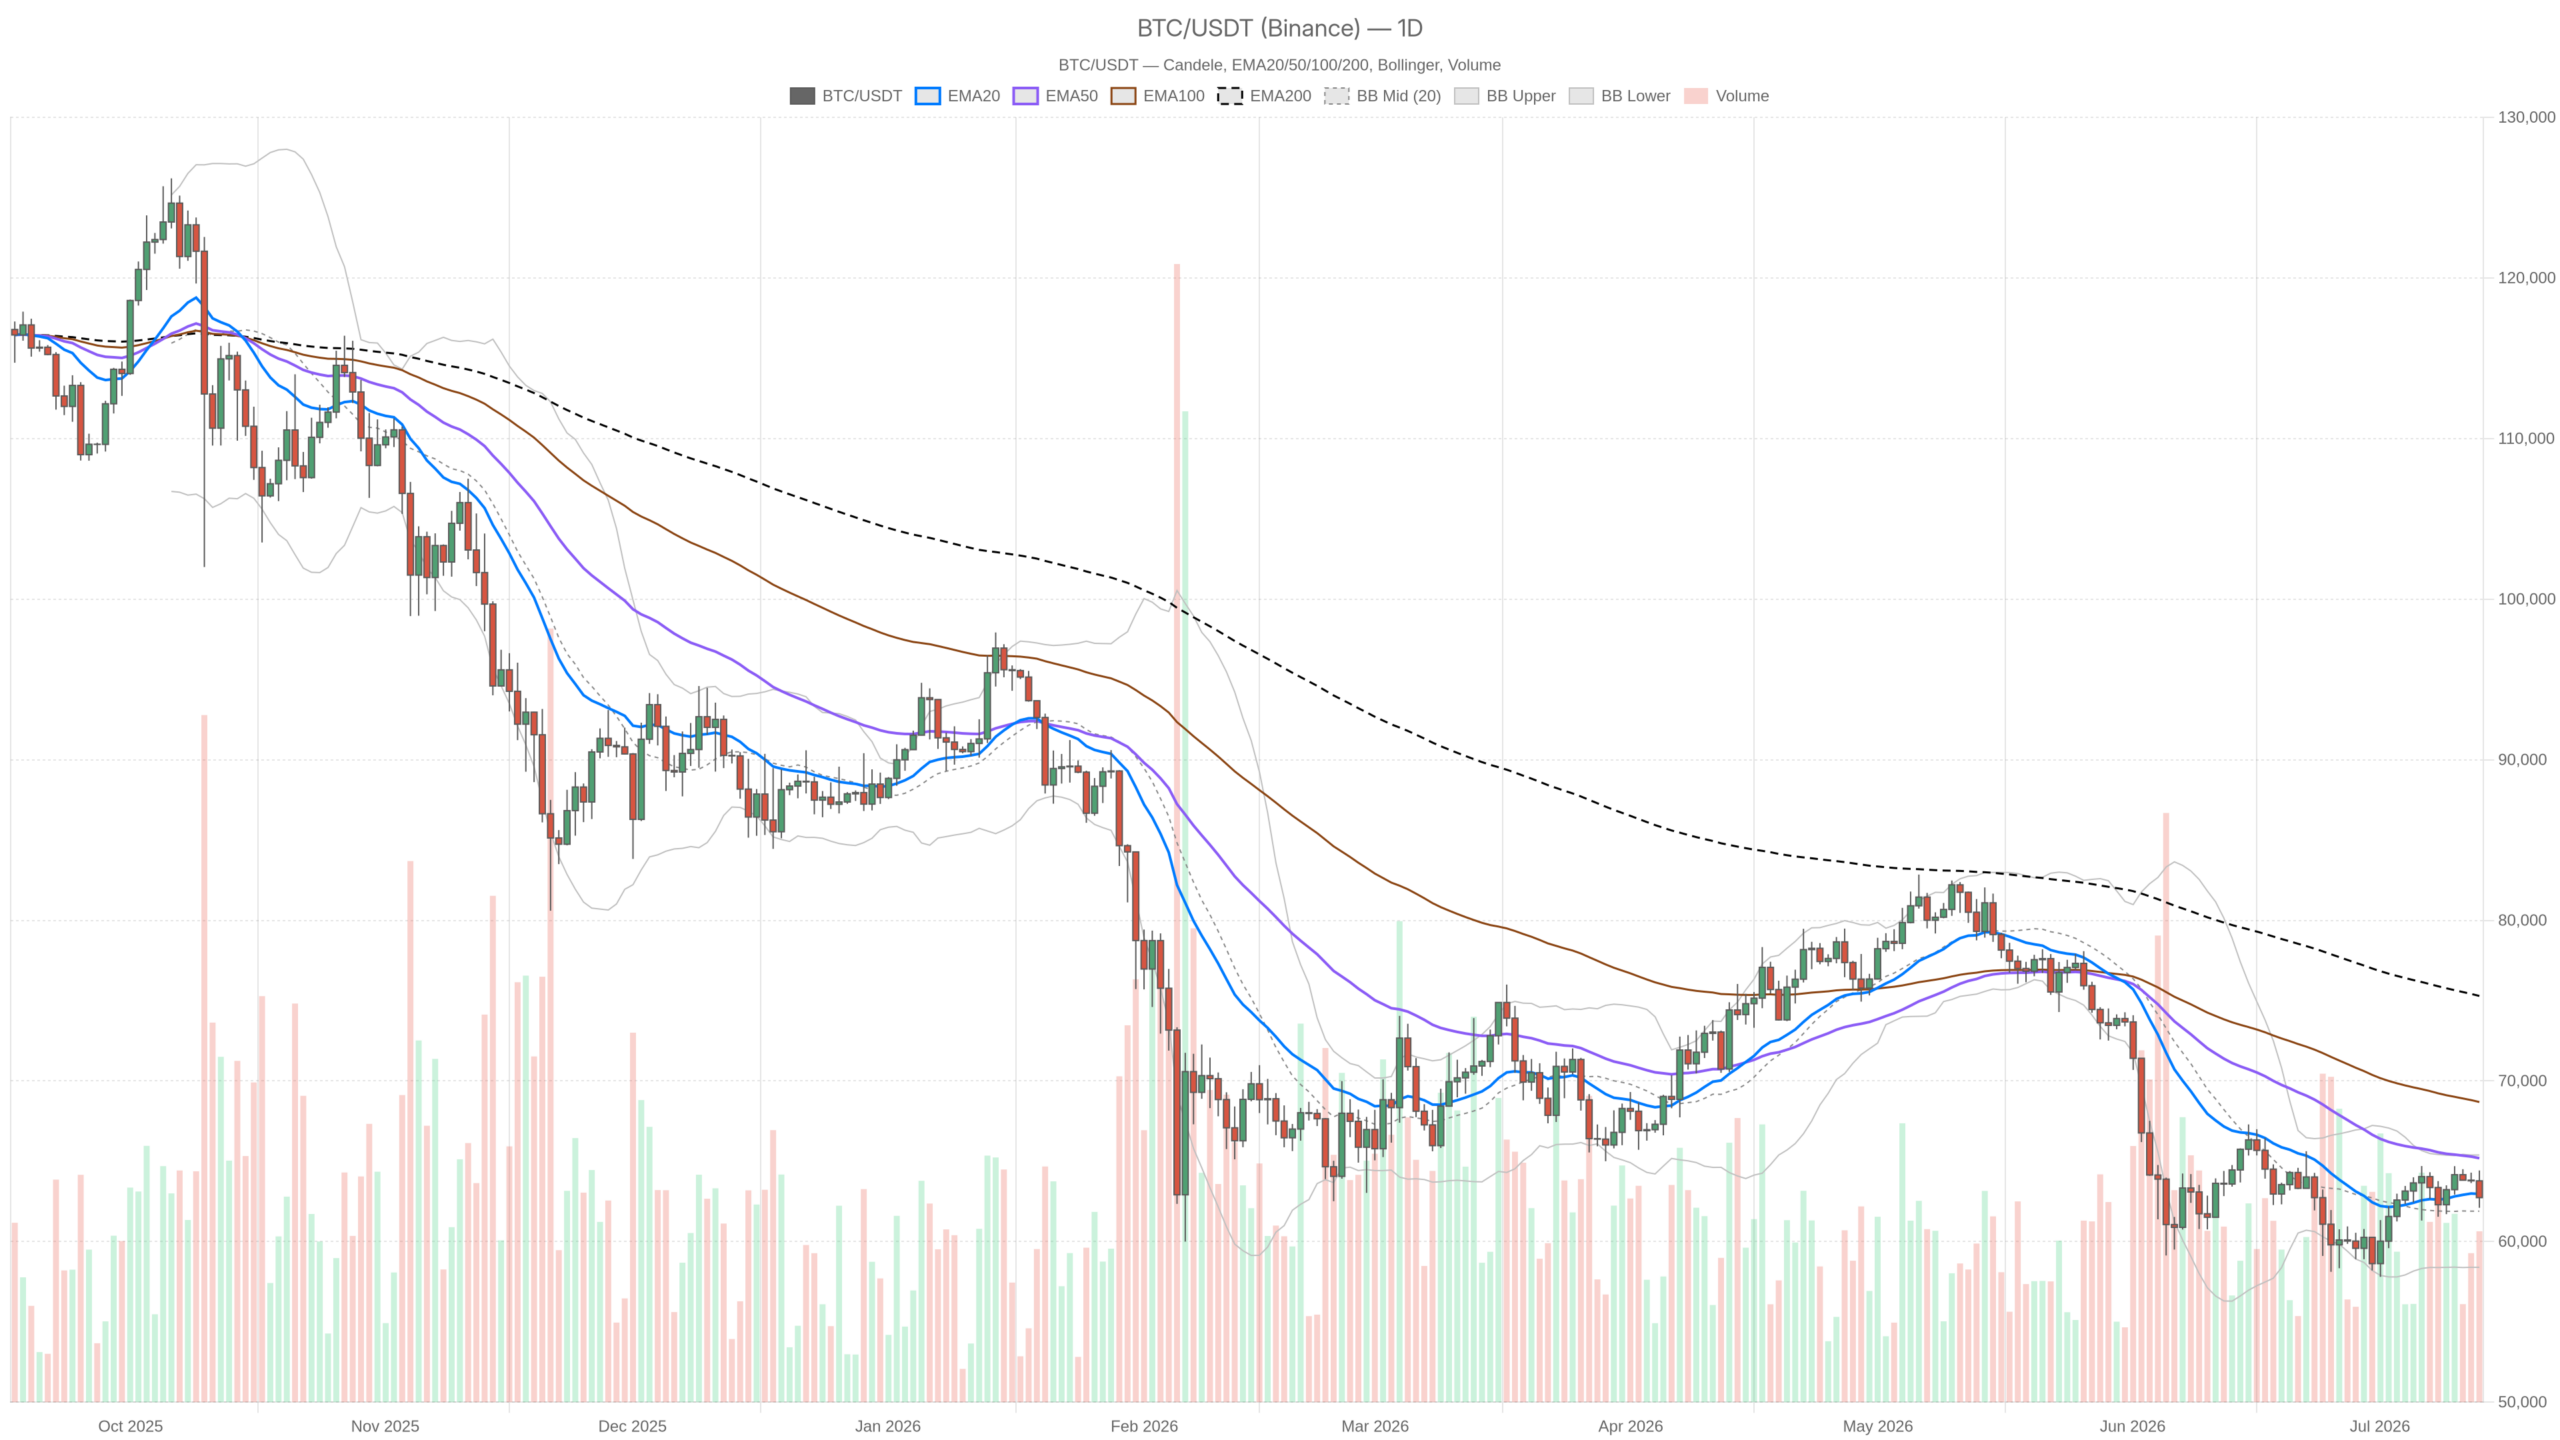
The daily chart confirms a bearish regime with price trapped below all major moving averages, though momentum indicators are beginning to signal that selling pressure is losing steam. Price at $62,734 sits below the EMA20 at $62,965 and well below the EMA50 at $65,188 — both acting as dynamic resistance sellers have successfully defended. Meanwhile, the EMA200 sits far above at $75,291, underscoring how deep the structural damage runs.
The daily RSI at 47.37 sits just below the neutral 50 line — not oversold, not in free-fall. This tells you sellers are in control but have not fully exhausted themselves. The MACD is more interesting: the line is at -238.51 against a signal at -664.46, generating a histogram of +425.95. That is a meaningful bullish histogram expansion. In practical terms, the rate of decline is slowing; the bears are losing momentum even if they have not lost direction.
Bollinger Bands on the daily place the midline at $61,892 and the upper band at $65,386. Current price sits between the midline and the upper band, which sounds constructive until you realize the upper band aligns almost perfectly with the EMA50 resistance cluster around $65,188–$65,386. That entire zone is a wall. The lower band at $58,397 represents the downside target if bulls lose the current range. Moreover, with ATR at $1,937, a single volatile session could cover that distance fast.
Pivot Levels: The Market’s Short-Term Scoreboard
Bitcoin is pinned below its daily pivot at $63,086, meaning the path of least resistance remains downward until bulls can reclaim that level on a closing basis. Resistance at R1 ($64,072) and support at S1 ($61,748) define the immediate range. That said, a close above $63,086 would flip the short-term pivot dynamic and shift intraday sentiment, while a break below $61,748 opens the door toward the lower Bollinger Band at $58,397.
Hourly Regime: Neutral, But Leaning Weak
The hourly timeframe tells a sobering story — all three EMAs are stacked above price in a bearish configuration, meaning any relief bounce will face immediate structural resistance. Price at $62,740 is below the 1H EMA20 ($63,099), EMA50 ($63,491), and EMA200 ($63,165). The 1H RSI at 39.54 is approaching oversold territory without quite touching it, suggesting the market is tired but has not capitulated.
The 1H MACD histogram at -24.09 is mildly negative, confirming the bearish lean without showing acceleration. The hourly Bollinger Band lower boundary at $62,101 is the nearest support worth watching — it is close enough to be tested within hours. Consequently, any daily-level relief bounce will face immediate resistance from all three EMAs clustered between $63,099 and $63,491. The bulls would need to reclaim and hold that zone to build any meaningful case for continuation higher.
15-Minute: A Flicker of Stabilization
The 15-minute chart offers the only constructive signal available, with price stabilizing just above the EMA20 and the MACD histogram flipping slightly positive. The M15 regime is neutral, the RSI is at 49.1 — right at the midpoint — and the MACD histogram has flipped to +22.14. The price ($62,742) is just above the M15 EMA20 ($62,706), which is a minor but real data point.
This is not a reversal signal; rather, it is stabilization after a move down. For execution purposes, it means short-term longs have a narrow window of relative calm. However, the overhead supply from higher timeframes makes any aggressive long risky without confirmation.
Bitcoin’s Dominant Market Force: Fear Is Real
Fear dominates the current market, with the Fear & Greed Index at 28 and on-chain data showing traders scrambling to reposition. Total crypto market cap has dropped 1.88% in 24 hours to approximately $2.245 trillion, according to CoinGecko figures. Bitcoin dominance holds at 56.03%, which is notable: when dominance stays elevated during a selloff, it typically means altcoins are bleeding harder and capital is rotating defensively within crypto rather than leaving uniformly.
On the DeFi side, DefiLlama data shows Uniswap V3 fees surged 63.14% in a single day and 140.63% over seven days — a spike that often indicates elevated volatility and hedging activity on-chain. Curve DEX fees doubled in a day (+100.16%) with a staggering +221.22% weekly change. That kind of DEX fee explosion is not a sign of healthy organic trading; it reflects traders scrambling to reposition, which aligns with the broader anxiety picture.
The Bullish Scenario — and What It Requires
The bullish case hinges entirely on the daily MACD histogram continuing to expand toward zero and eventually flipping positive, combined with a price reclaim of the daily pivot at $63,086 and a sustained push through the $63,099–$63,491 EMA cluster on the hourly. If those levels fold to buyers, the next real target is the daily R1 at $64,072 and then the upper Bollinger Band / EMA50 zone at $65,188–$65,386. Invalidation is clean: a daily close back below $61,748 (S1) would confirm the bear case and expose $58,397.
Strategy’s ongoing accumulation — raising reserves to $3 billion — provides a fundamental underpinning that keeps the floor from being structurally empty. Institutions buying dips does not guarantee a bottom, but it does compress the downside tail risk meaningfully.
The Bearish Scenario — Structurally, It’s Still in Charge
The bearish case remains structurally dominant — price below every key EMA, fear elevated, and macro headwinds all point toward continued distribution. If Bitcoin fails to reclaim the daily pivot and the 1H EMA cluster holds as resistance, the next move tests $61,748 and then the psychological and technical zone near $58,397. Moreover, with the daily ATR at $1,937, that move is achievable within two or three sessions. Invalidation for the bears: a decisive daily close above $65,188 with volume would shift the regime reading and force a reassessment.
Positioning in a Market Running on Fear
This is the reality of Bitcoin at a Crossroads: Bears Hold the Structure While MACD Hints at Relief — neither side has claimed a decisive edge, and the next few sessions will likely determine whether bulls or bears take control. The daily structure is bearish, the hourly internals are weak, and the only constructive signals are tentative: a recovering MACD histogram and 15-minute stabilization. Those are reasons to watch, not reasons to act.
The rational posture is to let the daily pivot and the 1H EMA cluster define the outcome. A confirmed reclaim of those levels shifts the conversation toward a relief rally. A rejection keeps the bears in the driver’s seat and the $58,000 zone on the table. In a Fear-dominated market with macro uncertainty still active, clarity is worth more than conviction — wait for the market to show its hand before committing size either way.
FAQ
What level does Bitcoin need to reclaim for a bullish shift?
Bitcoin must close above the daily pivot at $63,086 and then push through the hourly EMA cluster between $63,099 and $63,491. A decisive daily close above $65,188 would shift the regime reading and force a bearish reassessment.
Is the MACD histogram divergence a reliable reversal signal?
The bullish MACD histogram expansion at +425.95 indicates that selling momentum is decelerating, but it historically precedes consolidation or a counter-trend bounce — not necessarily a full reversal. Structure must confirm before treating it as actionable.
What does elevated Bitcoin dominance during a selloff tell us?
Bitcoin dominance at 56.03% during a market-wide decline typically means altcoins are underperforming more severely. Capital is rotating defensively within crypto rather than exiting entirely — Bitcoin is acting as the sector’s safe haven for now.
Where is Bitcoin’s downside target if current support fails?
A break below S1 at $61,748 opens the path toward the daily Bollinger Band lower boundary at $58,397. With the daily ATR at $1,937, that move could unfold within two to three volatile sessions if selling pressure accelerates.
Disclaimer: This article is for informational purposes only and does not constitute financial advice, an investment recommendation, or a solicitation to buy or sell any financial instrument or cryptocurrency. The analysis provided is not indicative of future results. Investing in crypto assets and financial markets carries a high risk of capital loss. Always do your own research (DYOR) and consult a qualified financial advisor before making any decision.
Article produced with the assistance of artificial intelligence and reviewed by the editorial team.
