




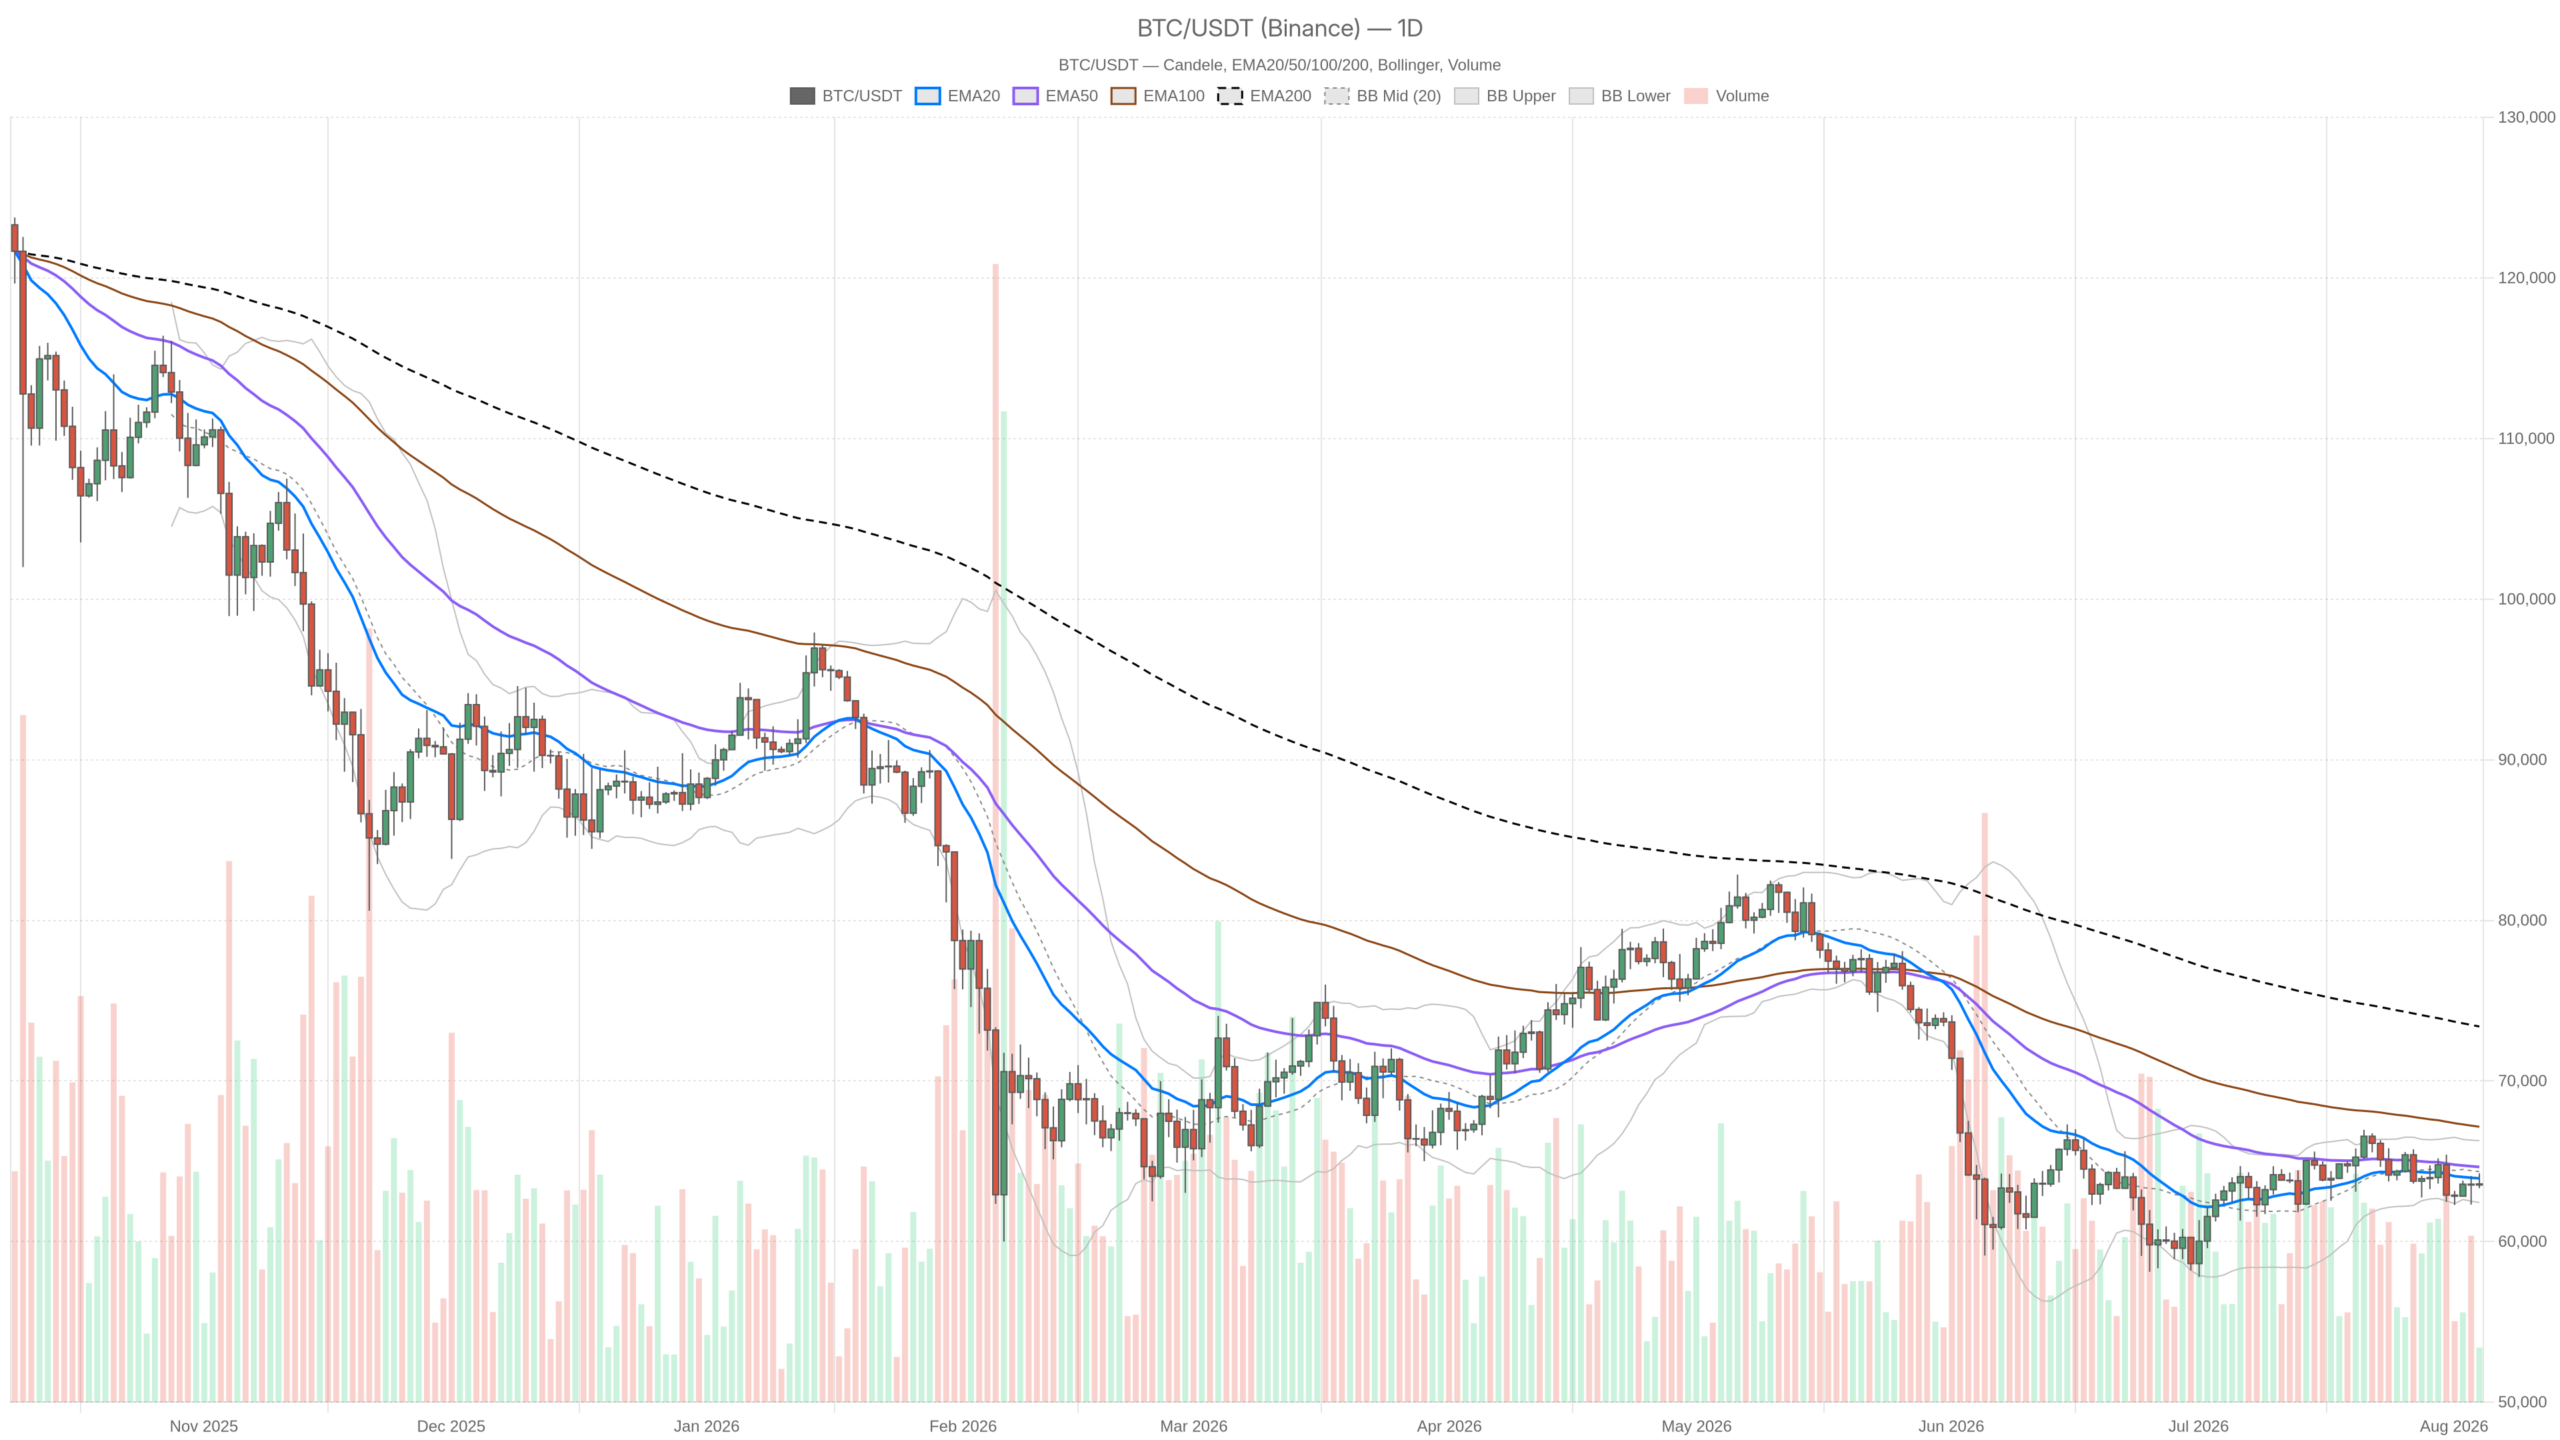
Digital asset markets have turned decisively defensive as of August 4, 2026, with Bitcoin crypto trading in a compressed range just under $63,600. The Fear & Greed Index has dropped to 25, squarely in Extreme Fear territory, while total crypto market capitalization hovers near $2.26 trillion, according to CoinGecko-derived aggregate data.
Summary
Key takeaways
- Bitcoin trades near $63,588, below all major daily moving averages including the EMA200 at $73,388.
- The Fear & Greed Index sits at 25, signaling Extreme Fear among market participants.
- Daily RSI at 47.82 shows neutral momentum, while MACD remains negative with a histogram of -166.5.
- Bitcoin dominance holds firm above 56% despite the broader sentiment deterioration.
- Short-term timeframes display neutral stabilization, but the daily bearish structure remains intact.
Daily Timeframe: Bearish Structure Still Dominates
The daily chart remains unequivocally bearish, with price trapped below every major moving average that matters. At $63,588, Bitcoin sits beneath the EMA20 at 63,934, the EMA50 at 64,643, and dramatically below the EMA200 at 73,388. That wide gap between short-term and long-term averages is not a minor pullback — it reflects a market that spent months trending down hard enough to drag the long-term average far above where price actually trades today. Until Bitcoin reclaims and holds above the EMA50, the path of least resistance on the daily stays tilted lower.
RSI14 on the daily is printing 47.82 — essentially neutral, neither oversold nor showing any bullish momentum surge. That detail matters: after a drop of this magnitude, RSI would normally be pinned near oversold if selling pressure were still accelerating. Instead it sits mid-range, which aligns more with a market pausing to digest than one in freefall. Moreover, the MACD tells a different story: the MACD line at -130.38 sits below its signal line of 36.12, producing a histogram of -166.5. That is a clearly negative momentum reading, and it diverges from the calmer RSI — a classic signal that downside momentum remains technically dominant even as the pace of decline has slowed.
The Bollinger Bands on the daily frame — with a mid-band at 64,354, upper at 66,279, and lower at 62,428 — show price hugging the lower half of the range without touching the extremes. There is no band squeeze forcing an imminent breakout, nor any band-walk suggesting relentless one-directional pressure. ATR14 at 1,494.54 confirms that daily volatility remains elevated, so moves of $1,000 to $1,500 in a single session should not surprise anyone positioned here. Daily pivot levels place the pivot point at 63,717.94, with resistance R1 at 64,113.88 and support S1 at 63,192.08 — and price sitting just below the pivot is a subtle bearish tell on its own.
1H and 15m: Short-Term Stabilization Takes Hold
The shorter timeframes reveal a market attempting to stabilize rather than accelerate lower. The hourly chart shows a flat, compressed EMA structure — price at 63,585 is sandwiched between the EMA20 at 63,613 and EMA50 at 63,449, with the EMA200 close by at 63,776. That is the opposite of the wide daily spread, and it signals short-term indecision rather than active selling pressure. H1 RSI at 50.78 sits dead-center neutral, and while the hourly MACD is also negative, the gap between line and signal is far narrower than on the daily chart.
In practical terms, the hourly chart does not confirm fresh bearish acceleration. It shows a market pausing right at the edge of a larger downtrend — a very different setup from one where every timeframe screams sell. Dropping to the 15-minute chart, the picture stays neutral but slightly heavier: RSI14 at 42.07 and a negative MACD histogram of -20.99 suggest short-term sellers hold a marginal edge inside this range. However, for execution purposes, the 15m remains useful mainly for timing entries around the 63,535–63,616 pivot band rather than for reading direction. This timeframe is noise-level compared to the daily macro signal.
Bullish Scenario
A credible bullish reversal requires Bitcoin to reclaim the daily EMA20 near 63,934 and then push through the EMA50 at 64,643 with conviction. Ideally, the MACD histogram would narrow back toward zero while RSI pushes convincingly above 50. If that occurs alongside the bottoming pattern some chart analysts have flagged, a move toward the daily pivot resistance at 64,113 and then the upper Bollinger Band near 66,279 becomes realistic. That said, this scenario would be invalidated immediately if price fails at the EMA20/EMA50 cluster and rolls back below the daily S1 at 63,192. Such a rejection would confirm sellers remain in control and the bounce was simply noise inside a larger downtrend.
Bearish Scenario
The bearish case remains the path of least resistance given the current daily regime. A breakdown below the daily S1 at 63,192 — particularly if accompanied by rising ATR and a widening negative MACD histogram — would open the door toward the lower Bollinger Band at 62,428 and potentially beyond. Given how far the EMA200 sits at 73,388 above current price, there is no nearby long-term average to act as structural support. A genuinely bearish continuation could therefore move fast once S1 gives way. This scenario would lose credibility if the hourly chart’s neutral stabilization begins spreading into the daily timeframe — specifically, if RSI14 daily breaks above 50 while the MACD histogram compresses rather than expands, suggesting sellers are losing momentum rather than gaining it.
Positioning and Risk
Right now the honest read is that Bitcoin sits at a genuine crossroads rather than inside a clean trend. The daily structure still favors caution: the regime is bearish, momentum is negative, and price is well below every major moving average that matters on that timeframe. Yet the hourly compression and the flattened EMA cluster show sellers have not fully committed to another leg down either. Moreover, the bottom-forming narrative referenced by CNBC chart analysts is not something the charts flatly contradict. Layer on Extreme Fear sentiment readings at 25 alongside the mixed macro backdrop, and the result is a market where both headlines and technicals are hedging rather than committing. Volatility, as ATR readings across timeframes confirm, remains real enough that whichever side breaks the current pivot-level standoff could move quickly. This is a moment to watch the reaction at the daily EMA20/EMA50 cluster above and the S1 pivot below — not a moment to assume the next move is obvious.
FAQ
What does a Fear & Greed Index of 25 signal for the Bitcoin market?
A reading of 25 places market sentiment firmly in Extreme Fear territory. Historically, such low readings often coincide with periods of capitulation or bottoming behavior, though they do not guarantee an immediate reversal. In the current context, it reflects widespread defensive positioning rather than conviction in further downside.
Is Bitcoin’s daily chart still structurally bearish?
Yes. Price at $63,588 sits below the EMA20 at 63,934, the EMA50 at 64,643, and the EMA200 at 73,388. MACD remains negative with a histogram of -166.5, and the overall regime on the daily timeframe is flagged as bearish. Until price reclaims the EMA50, the path of least resistance stays tilted lower.
Where is the nearest support level for Bitcoin right now?
The nearest critical support is the daily S1 pivot at $63,192. Below that, the lower Bollinger Band at $62,428 represents the next significant level. A break beneath S1, especially on rising ATR, would open the door toward that lower band and potentially beyond.
What would invalidate the bearish outlook?
The bearish case would weaken if daily RSI14 breaks above 50 while the MACD histogram compresses toward zero rather than expanding. Additionally, a decisive reclaim of the EMA50 at 64,643 would shift the technical structure toward a more neutral or potentially bullish posture.
Disclaimer: This article is for informational purposes only and does not constitute financial advice, an investment recommendation, or a solicitation to buy or sell any financial instrument or cryptocurrency. The analysis provided is not indicative of future results. Investing in crypto assets and financial markets carries a high risk of capital loss. Always do your own research (DYOR) and consult a qualified financial advisor before making any decision.
Article produced with the assistance of artificial intelligence and reviewed by the editorial team.
