




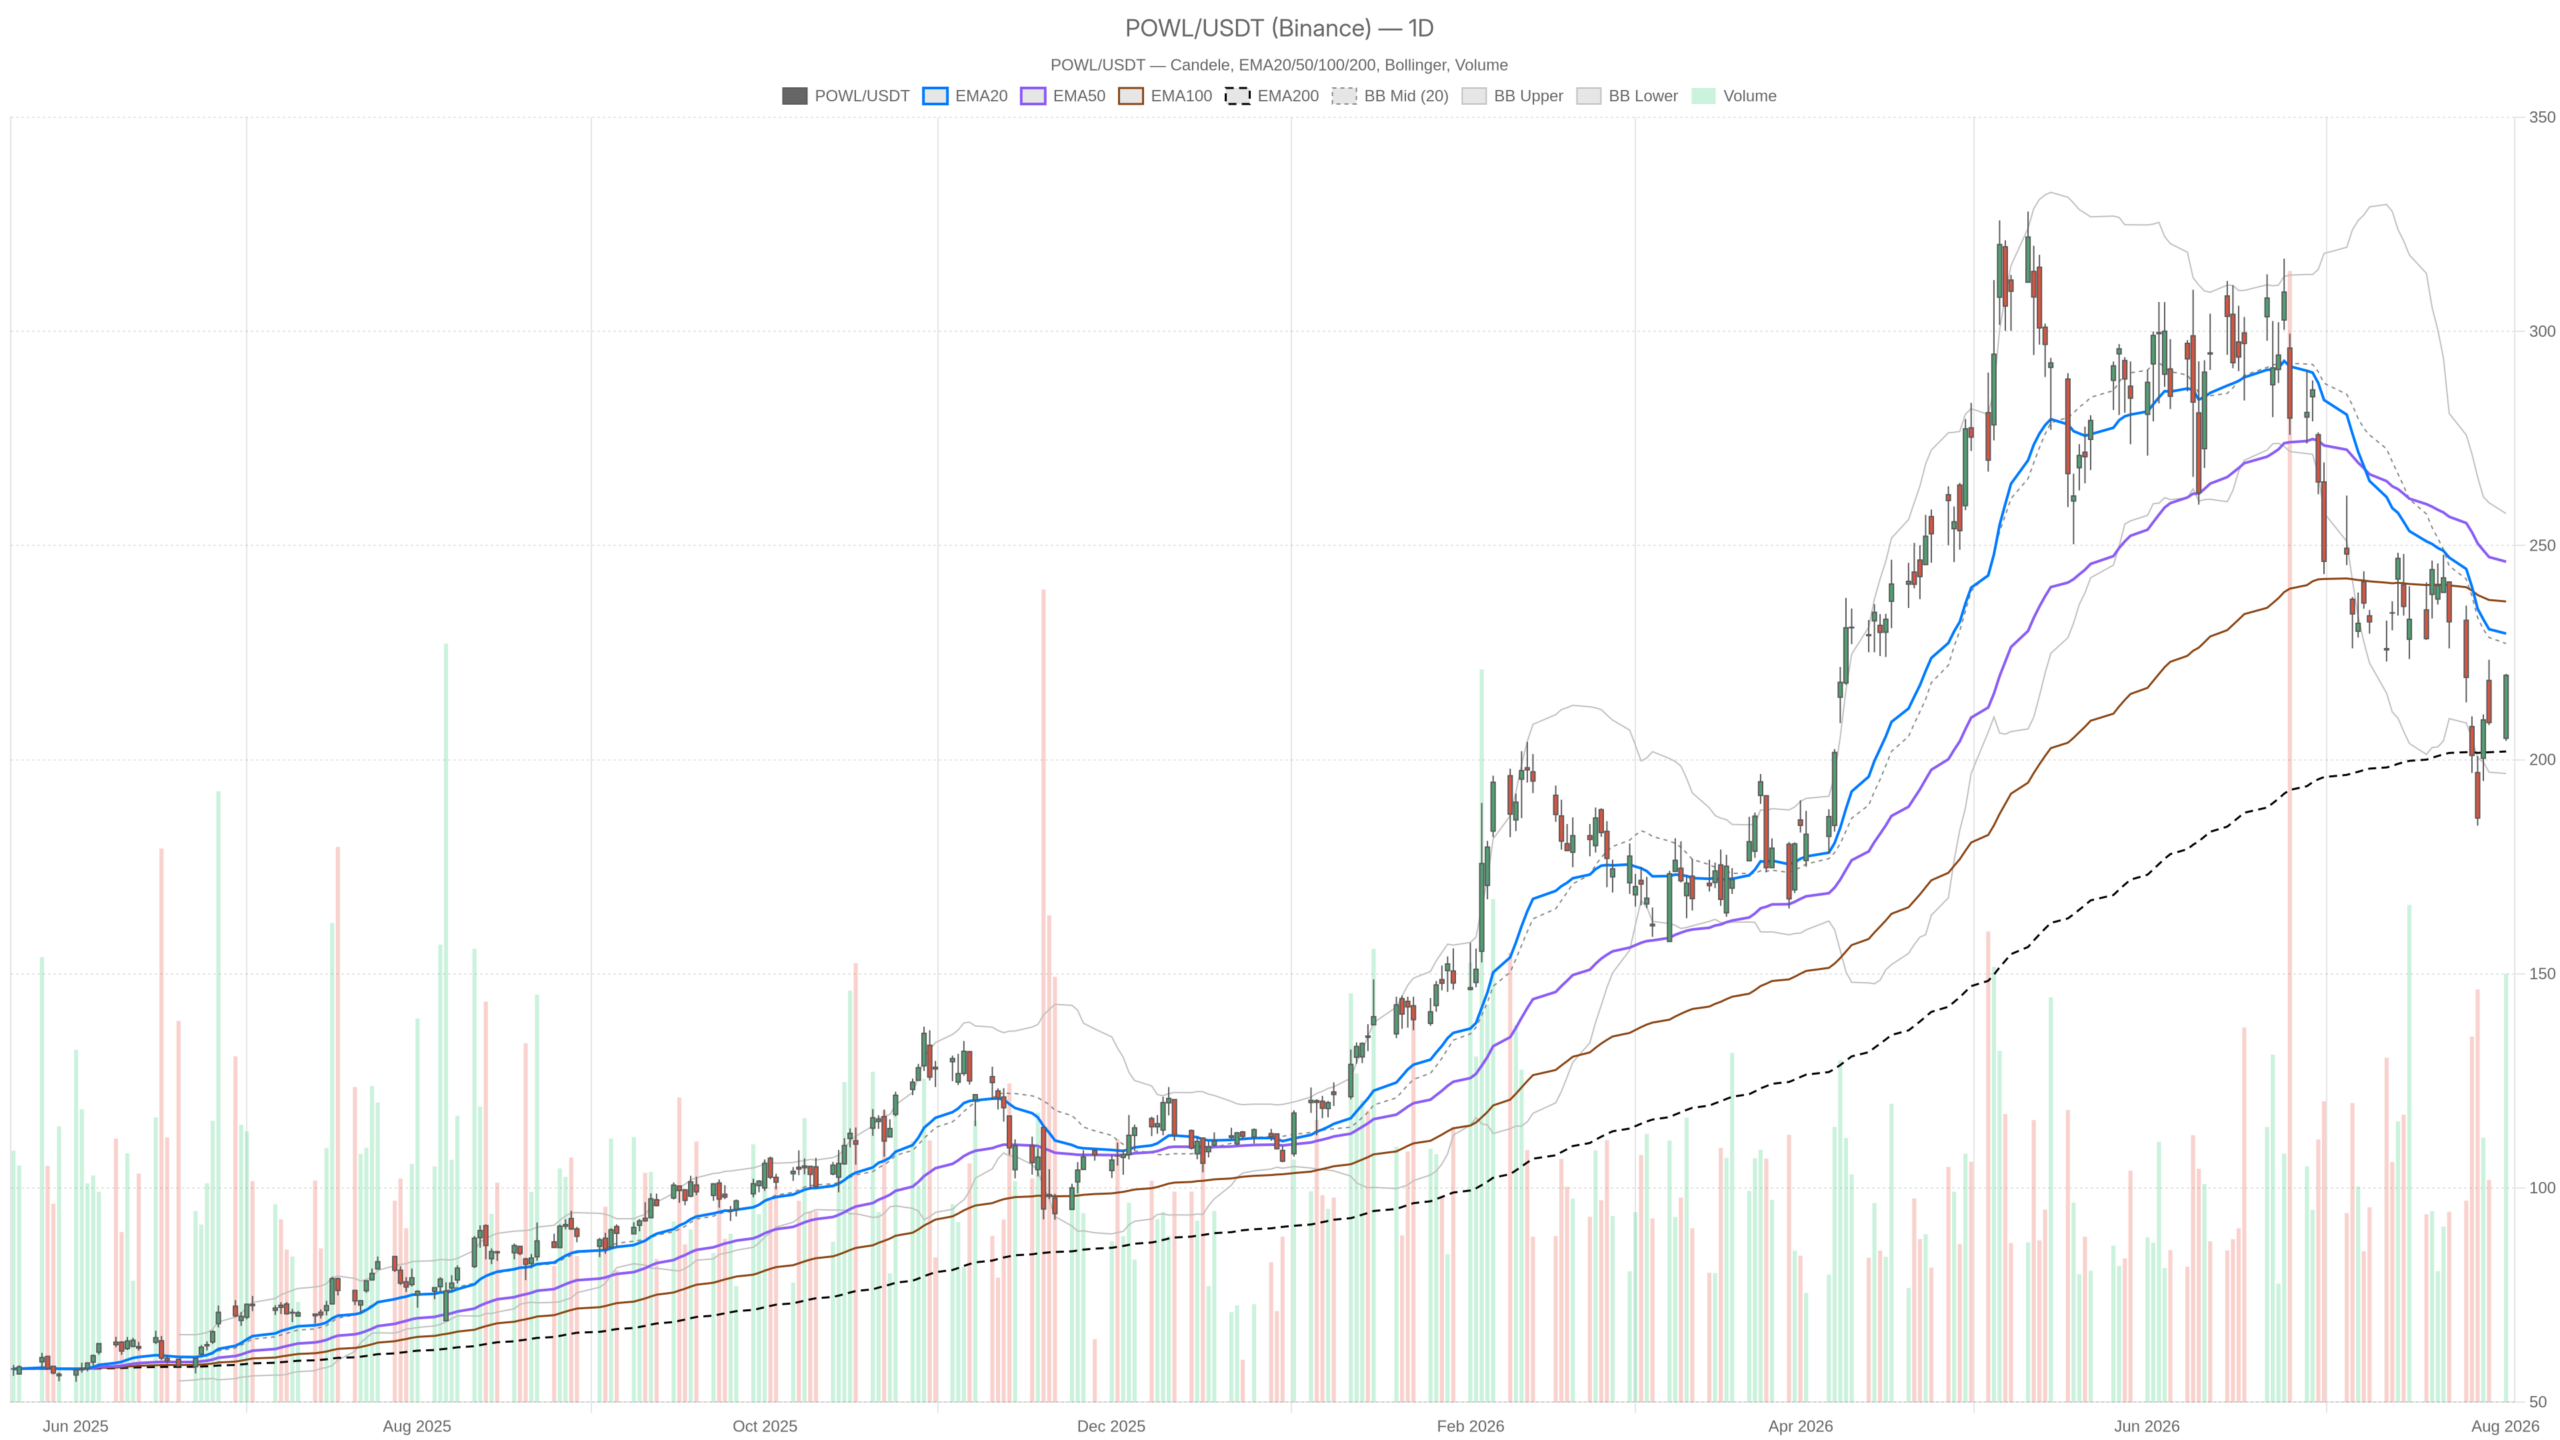
Powell Industries stock sits at a critical juncture. The daily chart still shows scars from a meaningful pullback, yet the most recent session produced a powerful rebound. Short-term momentum now points sharply higher, creating a stark contrast with the broader daily structure.
Summary
Key takeaways
- POWL closed at 219.72 after a sharp rebound from an open of 205.01, but remains below the 20-day EMA at 229.46 and 50-day EMA at 246.24.
- Daily MACD histogram at -0.71 shows bearish momentum is fading, though the indicator has not yet crossed into positive territory.
- Hourly momentum is decisively bullish, with RSI at 63.25 and price above both the 20-hour EMA (212.22) and 50-hour EMA (214.14).
- The 214–221 zone is the key battleground between the corrective daily bias and short-term bullish momentum.
- Powell Industries holds an average Buy recommendation ahead of Q3 earnings, with expectations for double-digit growth.
Daily Structure: Correction Still in Control
Powell Industries stock remains entrenched in a correction on the daily chart, despite a visually impressive bullish session. Price closed at 219.72 but still trades below both the 20-day EMA and 50-day EMA.
On the daily timeframe, Powell Industries opened at 205.01 and printed a high of 220.03. That is a wide-range bullish candle. Taken in isolation, it looks impressive. However, the broader trend picture tells a more cautious story. Price remains well below the 20-day EMA at 229.46 and the 50-day EMA at 246.24. It still sits above the 200-day EMA at 201.93.
That alignment matters. A stock trading beneath its medium-term averages but above its long-term average typically signals a correction inside a longer uptrend. In other words, the pullback from the highs has been sharp. The long-term trend, however, has not been broken.
Momentum Indicators Stabilize but Remain Cautious
Daily RSI at 43.76 sits in neutral territory, leaning slightly soft rather than oversold. Meanwhile, the daily MACD line at -15.19 remains below the signal line at -14.48, with a histogram of -0.71. The gap between the two lines is narrowing. This suggests bearish momentum is fading rather than accelerating. Still, the MACD has not crossed back into positive territory, so the daily bias remains cautious.
Volatility and Pivot Levels Frame the Range
The daily Bollinger Bands frame this well. Price at 219.72 sits below the midline of 227.13, with the upper band at 257.47 and the lower band at 196.79. That positioning confirms the stock is recovering from the lower half of its recent range. It is not yet pushing into strength.
Daily ATR14 at 16.35 confirms this is a volatile name, with wide daily swings that traders need to respect. On the pivot framework, the daily pivot point sits at 214.72. Resistance stands at 225.02 (R1) and support at 209.42 (S1). Price has already reclaimed the pivot and is working toward R1.
Momentum Improves Sharply on Lower Timeframes
Short-term momentum for Powell Industries stock has turned decisively bullish. The hourly chart shows price comfortably above its 20-hour and 50-hour EMAs, confirming buyer control on intraday timeframes.
Price closed at 219.8 on the hourly chart, above the 20-hour EMA at 212.22 and the 50-hour EMA at 214.14. That is a clean bullish stack on the intraday structure. On the other hand, price remains well below the 200-hour EMA at 238.69. This is a reminder that the larger decline is still visible even on this timeframe.
Indicators Confirm Bullish Intraday Control
Hourly RSI at 63.25 reflects genuine bullish momentum, approaching overbought without yet flashing exhaustion. The hourly MACD line at 2.57 sits above its signal line at 1.27, with a histogram of 1.3. This confirms buyers have taken control of the short-term tape.
Price is pressing against the upper Bollinger band at 220.95, with the midline at 211.88. The rally has real force behind it. Hourly ATR14 at 4.53 confirms elevated intraday volatility, consistent with the size of the recent move. The hourly pivot sits at 218.76, with R1 at 221.06. Price is testing that pivot-to-resistance zone directly.
Therefore, the hourly picture actively confirms short-term strength. The daily chart, in contrast, urges patience. This is a classic case of a lower timeframe leading a potential trend change before the higher timeframe fully confirms it.
Execution Context on the 15-Minute Chart
The 15-minute chart for Powell Industries stock is fully aligned with the bullish intraday thesis. All short-term EMAs point higher, making this timeframe useful for timing entries around key pivot zones.
On this timeframe, price at 219.8 trades above the 20-period EMA at 215.91, the 50-period EMA at 213.15, and the 200-period EMA at 214.42. RSI14 at 65.78 shows strong short-term momentum. The MACD histogram at 0.23 is positive but modest, hinting that the immediate push may be losing steam near current levels.
Price sits on the upper Bollinger band at 219.97, with the 15-minute pivot at 218.78 and R1 at 221.04. In practical terms, this timeframe is useful mainly for timing entries or exits around the 218.78–221.04 zone. It is not intended for defining the broader trend.
The Bullish Case for Powell Industries Stock
The bullish thesis for Powell Industries stock rests on the idea that this rebound marks the start of genuine trend repair rather than a temporary bounce. Several fundamental factors lend weight to this view.
The average brokerage recommendation for POWL is equivalent to a Buy. The company heads into its Q3 earnings report with expectations for double-digit growth, backed by a strong backlog and steady demand across utility and energy markets.
If the daily MACD histogram continues to shrink and eventually crosses positive, the correction would look increasingly complete. A reclaim of the 20-day and 50-day EMAs near 229.46 and 246.24 would add further confidence. A clean push through daily pivot resistance at 225.02 would strengthen the bullish thesis materially.
The Bearish Case and What Would Invalidate the Rally
The bearish scenario argues that the daily downtrend still has the final say over Powell Industries stock. As long as price stays capped below the 229.46 and 246.24 EMAs, this rebound can still be read as a relief bounce inside a larger downtrend.
A failure at the hourly and daily resistance zones would weaken the bullish thesis quickly. Notably, a rejection near 220–221 and 225.02 would be particularly damaging to the short-term momentum case.
If price then loses the daily pivot at 214.72 and slips back toward support at 209.42, the correction narrative would reassert itself. The recent strength on the hourly and 15-minute charts would be exposed as short-lived. Traders should watch these levels closely for early signs of failure.
Closing Take
Powell Industries stock presents a clear conflict between timeframes heading into its next moves. The daily chart still reflects an unresolved correction. Price sits beneath key medium-term EMAs while MACD is only beginning to stabilize.
Meanwhile, the hourly and 15-minute charts show a sharp, confirmed burst of bullish momentum testing resistance directly. Given elevated ATR readings on both the daily and hourly charts, volatility is likely to remain high in either direction. Positioning around this name should account for that uncertainty. The 214–221 zone acts as the key battleground between the corrective daily bias and the more optimistic short-term momentum.
FAQ
Is Powell Industries stock still in a correction?
Yes. Despite the sharp recent rebound, POWL remains below its 20-day EMA at 229.46 and 50-day EMA at 246.24. The daily MACD remains negative, though bearish momentum is fading. Price would need to reclaim both EMAs to signal the correction is complete.
What are the key resistance levels for POWL?
Immediate resistance sits in the 220–221 zone, with hourly R1 at 221.06. The next major hurdle is daily R1 at 225.02. Beyond that, the 20-day EMA at 229.46 and 50-day EMA at 246.24 represent structurally significant resistance levels.
What would confirm a trend reversal for Powell Industries stock?
A confirmed reclaim of the 20-day EMA (229.46) and 50-day EMA (246.24), coupled with a daily MACD crossover into positive territory, would signal the correction is complete. A push through daily pivot resistance at 225.02 would be an early confirmation step.
What is the analyst outlook for Powell Industries stock?
The average brokerage recommendation for Powell Industries is equivalent to a Buy. The company heads into its Q3 earnings report with expectations for double-digit growth, supported by a strong backlog and steady demand across utility and energy markets.
Disclaimer: This article is for informational purposes only and does not constitute financial advice, an investment recommendation, or a solicitation to buy or sell any financial instrument or cryptocurrency. The analysis provided is not indicative of future results. Investing in crypto assets and financial markets carries a high risk of capital loss. Always do your own research (DYOR) and consult a qualified financial advisor before making any decision.
Article produced with the assistance of artificial intelligence and reviewed by the editorial team.
