




Uber Technologies, Inc. stock sits at a crossroads. The daily chart still points lower, with price trading beneath every major moving average. Yet buyers have stepped back in over the last few hours, creating tension between a tired daily trend and a fresher intraday bid.
Summary
Key takeaways
- UBER closed at $70.36, below its 20-day, 50-day, and 200-day EMAs — a textbook bearish regime on the daily chart.
- Daily MACD remains negative at -0.79 against a signal of -0.65, confirming sellers still hold the higher-timeframe edge.
- The hourly chart shows a neutral regime with a mild bullish tilt; price has reclaimed its 20 and 50-period EMAs but remains below the 200-period EMA at $71.47.
- The 15-minute chart displays the strongest bounce, with RSI at 65.35 approaching overbought territory near resistance at $70.56.
- The daily ATR of 2.39 points to elevated volatility, with the lower Bollinger band at $67.25 marking the next bearish target if the bounce fails.
Uber Stock’s Daily Chart: Bearish Regime Remains in Control
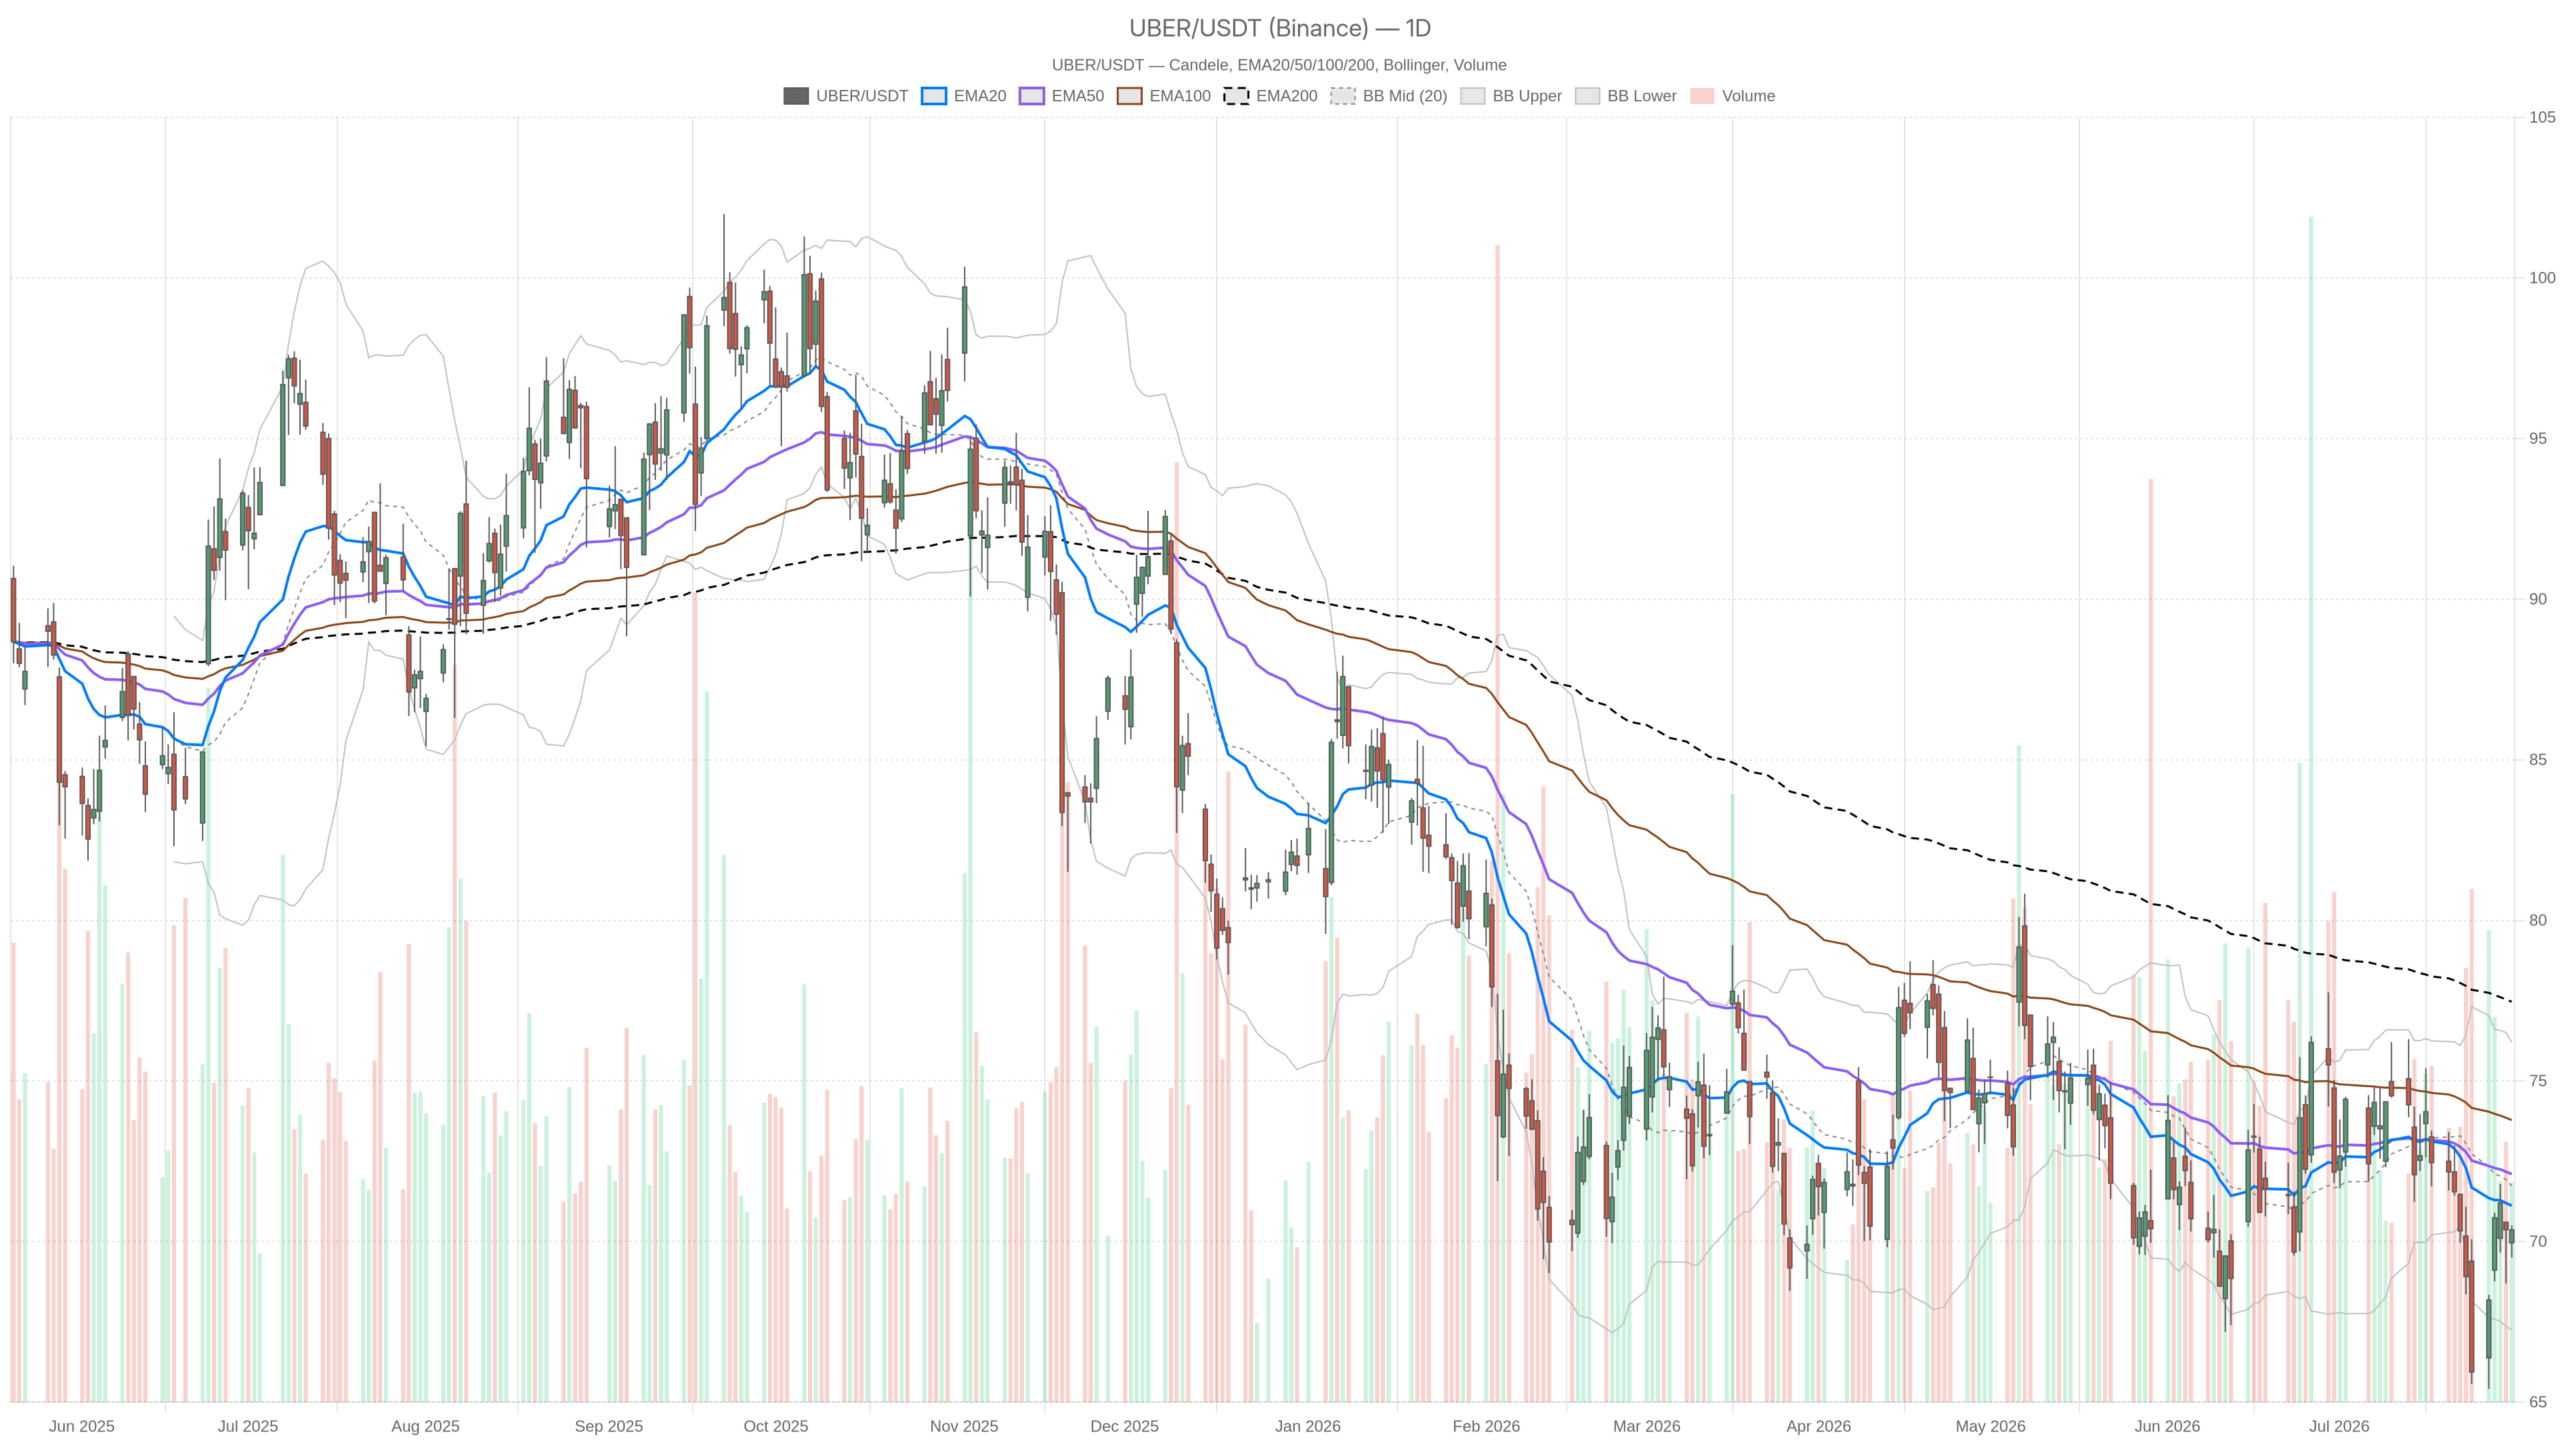
The daily chart for Uber Technologies, Inc. stock remains firmly in bearish territory. Price is trapped below every major moving average, and momentum indicators still favor sellers. UBER closed the last daily session at $70.36. It sits below the 20-day EMA at $71.12 and the 50-day EMA at $72.10. Price also trades well under the 200-day EMA at $77.47. That gap underscores how much technical damage has accumulated over the medium term.
Stacked EMAs sloping down above price signal a textbook bearish regime. The system’s daily reading confirms this. Momentum data reinforces the picture: RSI14 at 46.86 is a neutral-to-soft reading that shows no real buying conviction. Meanwhile, MACD is more revealing — the line sits at -0.79 against a signal of -0.65, with a histogram of -0.14. That negative MACD structure is consistent with a market where sellers still control the daily timeframe.
Bollinger Bands add volatility context. The daily mid-band is at $71.73, with the upper band at $76.20 and the lower band at $67.25. Price closing below the midline and closer to the lower band reinforces the downside tilt. The daily ATR of 2.39 is meaningful for a stock near $70. It signals that swings of a dollar or two in a single session should not surprise anyone right now.
What the 1-Hour Chart Reveals About Uber Technologies, Inc. Stock
The hourly chart complicates the bearish daily narrative with a shift toward neutral. UBER closed at $70.38 on the 1H timeframe, above its 20-period EMA of $69.92 and 50-period EMA of $70.00. However, it remains below the 200-period EMA at $71.47. The regime here is labeled neutral, not bearish. That distinction matters — price has reclaimed its short-term averages even while the daily trend stays heavy overhead.
RSI14 on the 1H chart reads 55.59, marking a mildly bullish tilt rather than an overbought extreme. At the same time, MACD on the hourly has flipped positive. The line sits at 0.13 above a signal of 0.10, with a histogram of 0.02. That is a modest but real shift in short-term momentum. The hourly pivot point sits at $70.31, with resistance at $70.56 and support at $70.12. Price closing at $70.38 puts it just above the pivot, testing the path toward that first resistance level.
In contrast to the daily setup, this is a market attempting a relief bounce rather than confirming a fresh uptrend. The 1H Bollinger mid-band at $70.05 and upper band at $71.38 suggest some room to extend higher before the hourly structure gets stretched. Still, the 200-period EMA overhead at $71.47 remains a logical cap for now.
The 15-Minute Execution View
The 15-minute chart shows the bounce is more advanced than on higher timeframes. Price at $70.38 trades above its 20, 50, and 200-period EMAs, which cluster tightly between $69.93 and $70.04. RSI14 has climbed to 65.35, closer to overbought territory. MACD remains positive with a line of 0.11 versus a signal of 0.08. This short-term momentum picture is clearly stronger than either the daily or hourly reading.
Notably, the 15m Bollinger upper band sits at $70.33, just below the current close. That hints at a short-term stretch. The 15m pivot point at $70.33, with resistance at $70.54, is essentially where price is trading right now. For traders using this timeframe purely for entry timing, the easy part of the bounce may already be behind it. Any continuation higher will likely need fresh volume rather than simple momentum carry-over.
Bullish Scenario for Uber Stock
A constructive case for Uber Technologies, Inc. stock would require the hourly reclaim of the $69.92–$70.00 EMA cluster to hold. That would then need a clean push through the 1H resistance at $70.56. Eventually, price must clear the 200-period EMA at $71.47. If MACD on both timeframes continues improving, the bearish case would weaken. Daily RSI pushing convincingly above 50 would further erode the current bearish daily regime. A move back above the daily 20-day EMA at $71.12 would be an important technical signal. It would suggest the broader downtrend is losing force, not just pausing.
On the fundamental side, recent coverage has been constructive. Seeking Alpha highlighted an attractive valuation call on UBER. The publication framed the stock as a Buy, citing strong business fundamentals and diversified services. Separately, Uber Eats has been expanding its U.S. grocery delivery network. It added regional chains such as Busch’s Fresh Food Market, Hays, Lowe’s Market, and Piggly Wiggly. These additions span states including Arkansas, Michigan, Missouri, North Carolina, Ohio, and Texas. That kind of diversification supports the longer-term growth narrative, even if it does not move the technical picture in the short run.
Bearish Scenario: What Invalidates the Bounce in Uber Stock
On the other hand, the bearish case remains the default given the daily structure. If price fails at the hourly resistance near $70.56, the bounce is at risk. A roll back below the 1H pivot at $70.31 would signal the intraday bid is fading quickly. A break back under the daily S1 at $69.74 would put sellers back in control. It would also open the door toward the lower Bollinger band at $67.25. Given the daily ATR of 2.39, that kind of move is well within normal volatility for this name.
Therefore, the bearish MACD reading on the daily chart carries weight. Combined with price trading well below the 200-day EMA, any rally attempt warrants caution. Confirmation on the higher timeframe is needed before turning bullish. News flow around the Uber-Waymo dispute over autonomous vehicle regulation in Washington, D.C., also adds a layer of headline risk. Labor battles over AV deployment could weigh on sentiment if the dispute escalates. So far, however, it has not shown up directly in price action.
Closing Take
Overall, Uber Technologies, Inc. stock is caught between conflicting forces. The daily downtrend has not yet broken. Yet a short-term bounce offers real but limited technical backing. The daily regime remains bearish. The hourly chart is neutral with a mild bullish tilt. The 15-minute chart shows the most short-term strength but is arguably starting to look stretched near its own resistance.
Meanwhile, fundamental headlines offer some support to the long-term story. A bullish valuation call and Uber Eats’ grocery expansion do not, however, change the near-term technical setup. Positioning around current levels should account for elevated volatility. With the daily ATR near 2.39, sharp moves in either direction remain possible. Until price reclaims the daily EMA cluster with conviction, the higher-timeframe path of least resistance still points down. The intraday tape, however, argues otherwise.
FAQ
Is Uber Technologies, Inc. stock in a bearish or bullish trend?
The daily chart shows a bearish regime. UBER closed at $70.36, below its 20-day EMA at $71.12, 50-day EMA at $72.10, and 200-day EMA at $77.47. Daily MACD remains negative at -0.79, confirming sellers still hold the edge on the higher timeframe.
What are the key resistance levels for UBER stock right now?
Immediate resistance sits at the 1-hour pivot of $70.56. The next hurdle is the 1-hour 200-period EMA at $71.47. On the daily chart, the 20-day EMA at $71.12 serves as an important technical barrier. A close above all three would begin challenging the bearish regime.
Is the intraday bounce in Uber stock likely to continue?
The 15-minute chart shows the bounce is already advanced. RSI at 65.35 is nearing overbought territory, and price sits at the upper Bollinger band. Further upside likely requires fresh buying volume rather than momentum carry-over. Failure at $70.56 could see the bounce fade quickly.
What is the expected volatility range for Uber stock?
The daily ATR stands at 2.39, meaning swings of roughly $2 or more in a single session are within normal volatility for UBER stock. The daily Bollinger Bands range from $67.25 on the lower end to $76.20 on the upper end, framing the broader expected trading range.
Disclaimer: This article is for informational purposes only and does not constitute financial advice, an investment recommendation, or a solicitation to buy or sell any financial instrument or cryptocurrency. The analysis provided is not indicative of future results. Investing in crypto assets and financial markets carries a high risk of capital loss. Always do your own research (DYOR) and consult a qualified financial advisor before making any decision.
Article produced with the assistance of artificial intelligence and reviewed by the editorial team.
