



TSMC stock closed at $403.41 on July 24, trapped between record fundamentals and deteriorating technicals. Record Q2 results, a raised 2026 outlook, and $100 billion in U.S. CapEx have not translated into price momentum. The disconnect demands careful examination.
Summary
Key takeaways
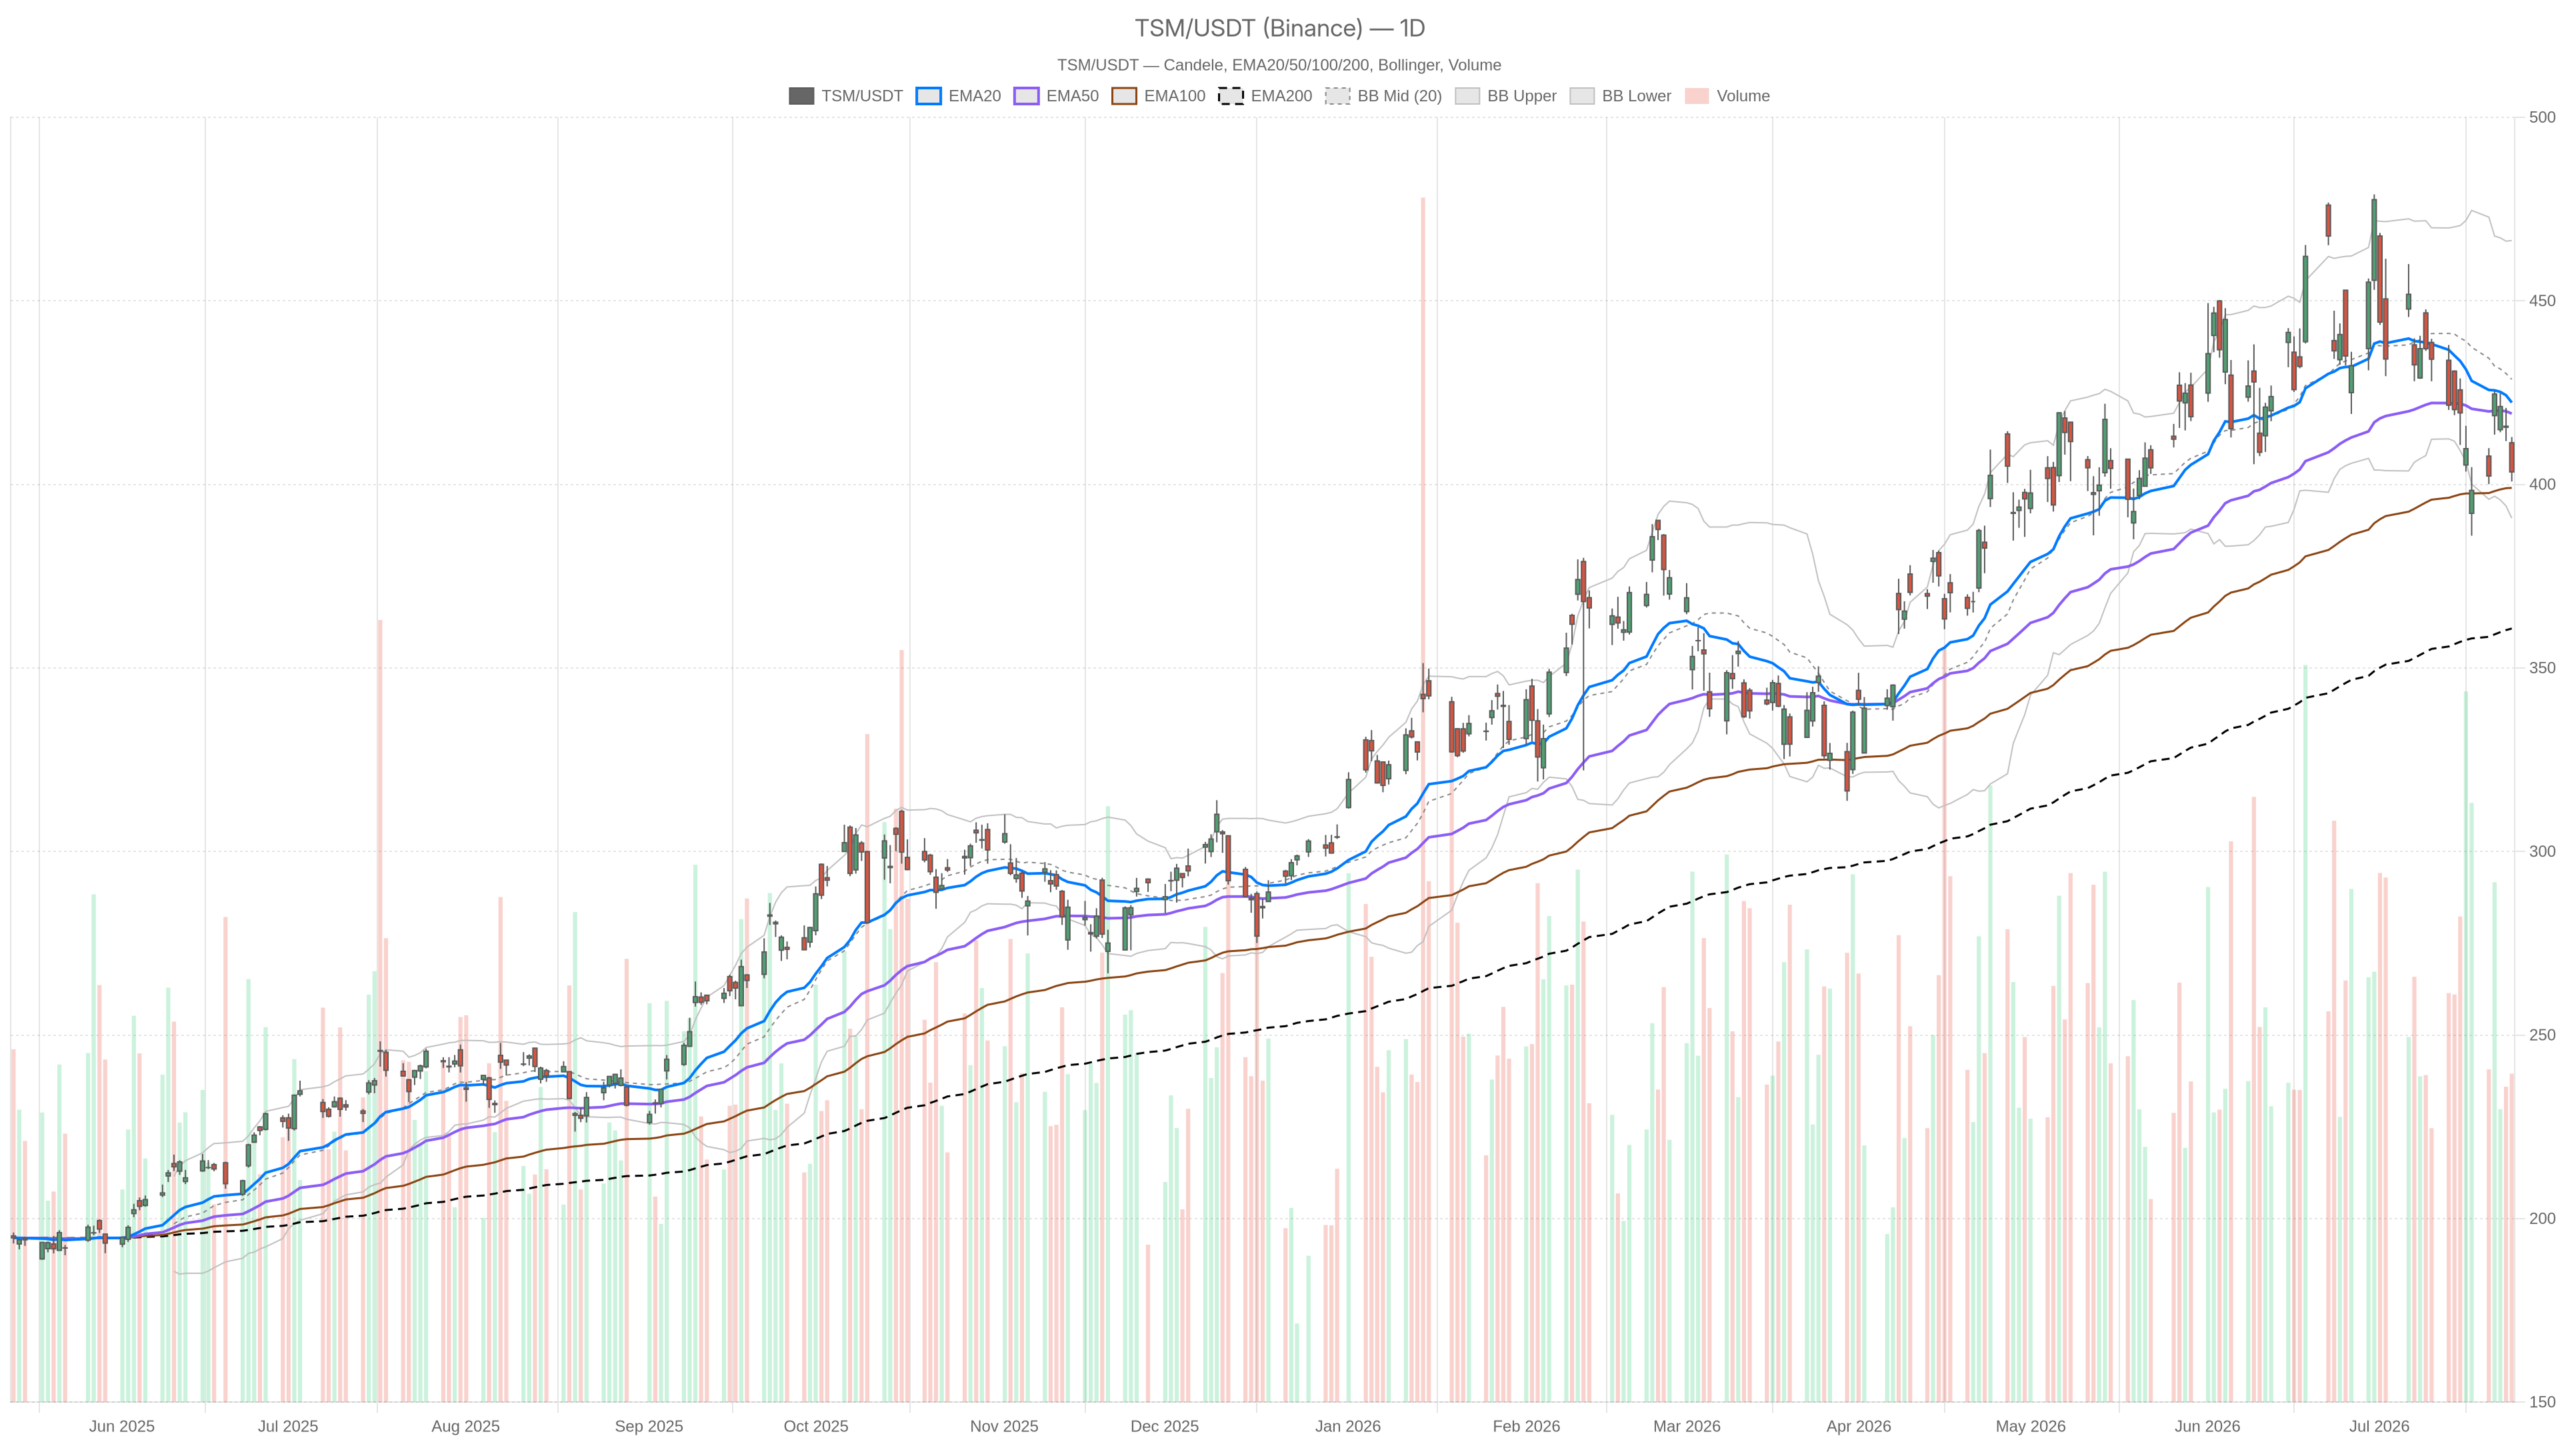
- TSMC stock closed at $403.41 on July 24, below both the 20-day EMA ($422.30) and 50-day EMA ($419.29).
- The daily MACD histogram is widening to the downside at -2.78, confirming accelerating selling pressure.
- The hourly chart shows a full bearish stack with all three EMAs positioned above price.
- Record Q2 earnings, a raised 2026 outlook, and $100 billion in U.S. CapEx have not translated into price momentum.
- Key support sits at $398.50, with the lower Bollinger Band at $390.81 as the next downside target.
Daily Timeframe: A Neutral Regime Masking Bearish Drift
The daily chart reveals TSMC stock in a neutral regime with a clear bearish drift, closing below both key moving averages and showing no signs of stabilization.
Moving Average Compression
TSM closed at $403.41, sitting below both the 20-day EMA at $422.30 and the 50-day EMA at $419.29. This double compression below two key trend filters signals a decisive loss of bullish momentum. Price is not collapsing outright, but it is not holding support either.
Momentum Signals Turn Decidedly Bearish
The daily RSI at 42.4 sits in a soft bearish zone — not yet oversold, but clearly under pressure. Meanwhile, the MACD tells a more decisive story. The MACD line is at -5.71, the signal at -2.92, and the histogram at -2.78. Notably, the histogram is widening to the downside, confirming that selling pressure is accelerating rather than stabilizing.
Volatility and Pivot Levels
The Bollinger Band picture adds further context. The midline sits at $428.62, and TSM is trading well below it. The lower band at $390.81 represents near-term downside risk if deterioration continues. The daily ATR of $15.39 reflects meaningful intraday swings — this is not a low-volatility consolidation. Daily pivot analysis places the pivot point at $405.71, with R1 at $410.62 and S1 at $398.50. TSM closed just below the pivot — a mild but notable sign of weakness. Overall, the daily regime is classified as neutral, but the weight of evidence leans bearish in the short run.
TSMC Stock on the Hourly Chart: Bearish Confirmation
The 1-hour chart confirms an explicitly bearish regime for TSMC stock. Every single moving average is positioned above price — a full bearish stack that reflects sustained directional selling.
TSM is trading at $403.69 on the hourly close. It sits below the 20-hour EMA at $411.29, the 50-hour EMA at $414.67, and the 200-hour EMA at $425.12. This alignment is not coincidental. It signals persistent selling across multiple time horizons.
The hourly RSI at 35.7 is approaching oversold territory without quite reaching it. That positioning can be interpreted two ways. Either a bounce is near, or momentum is strong enough to push RSI lower before any recovery. Given the MACD configuration — line at -3.02, signal at -1.37, histogram at -1.65 — the latter scenario carries more weight. The hourly MACD histogram remains negative and expanding.
On the hourly Bollinger Bands, TSM is pressing against the lower band at $400.36. However, in a strongly trending bearish environment, price can walk the lower band rather than bounce off it. That is the risk traders must account for here. The hourly ATR of $4.95 confirms active intraday volatility. Pivots are tight: PP at $403.09, R1 at $405.11, S1 at $401.66. The stock hovers just above S1, making $401.66 an immediate line in the sand.
15-Minute View: Marginal Stabilization, Not a Reversal
The 15-minute chart shows TSMC stock stabilizing marginally — but this is exhaustion, not a reversal. The MACD histogram has nearly flattened at -0.05, a near-zero reading after a sustained negative run. Selling momentum is briefly decelerating, not reversing.
The 15-minute RSI at 38.69 mirrors the hourly setup — weak but not fully oversold. Price remains below all three EMAs on this timeframe as well. The 15-minute Bollinger lower band at $402.20 provides immediate intraday support. Meanwhile, the upper band at $409.61 acts as a ceiling for any bounce attempt. ATR at $1.97 reflects a contained intraday range. Tactically, the 15-minute chart suggests a brief consolidation rather than a turning point.
The Fundamental Backdrop: Strong Earnings, Tempered Enthusiasm
TSMC’s fundamentals remain formidable by any objective measure — yet the market’s reaction has been notably restrained. Record Q2 results, a raised 2026 outlook, and $100 billion in fresh U.S. CapEx commitments speak to a company operating at peak demand.
Record Results Meet Market Skepticism
AI chip demand that TSMC reportedly still cannot fully meet underscores its structural positioning. However, the planned 2027 price hikes of 5% to 10%, plus HPC surcharges, will test pricing power across its customer base. This includes NVIDIA, Broadcom, AMD, and Qualcomm. Analysts on Seeking Alpha have openly noted that aggressive CapEx and already-elevated expectations have tempered enthusiasm. Geopolitical risk tied to Taiwan remains a persistent discount factor, as noted by Motley Fool commentary.
One analyst revised their view to a hold, citing the tension between strong execution and market-priced perfection. Another argued that TSMC is a far safer buy than fabless competitors, given its insulation from AI price wars. The divergence in analyst opinion itself reflects the market’s current ambivalence.
The Long-Term Anchor
In contrast to the technical pressure, the long-term structural case for TSMC has not changed. The 200-day EMA at $360.75 remains far below current price. It serves as a reminder that the broader uptrend is still intact from a longer perspective. That level is a meaningful floor if the current correction deepens significantly.
Bullish Scenario: What TSMC Stock Needs to Recover
A bullish recovery in TSMC stock would require a clean recapture of the $410–$415 zone. That range corresponds to the hourly EMA cluster and the daily pivot resistance at $410.62. A daily close back above the 20-day EMA at $422.30 would be the stronger signal. It would confirm the recent pullback was a correction within an ongoing uptrend — not a trend reversal.
On the momentum side, the daily MACD histogram would need to stop widening and begin compressing back toward zero. The RSI reclaiming the 50 level on the daily chart would add further confirmation. Fundamentally, continued AI-driven demand visibility and clarity on the CapEx return timeline could help restore institutional confidence. Any positive geopolitical development regarding Taiwan would also remove a structural discount that has capped valuation.
Bearish Scenario: Risks That Could Deepen the Decline
The bearish case for TSMC stock centers on a break below daily S1 at $398.50. That would expose the lower Bollinger Band at $390.81 as the next natural target. Below that level, there is meaningful space before the 200-day EMA at $360.75 provides structural support.
The bearish case does not require fundamental deterioration. It simply requires the current technical momentum to persist. Aggressive CapEx commitments, while strategically sound, introduce near-term margin uncertainty. If the market begins to price in execution risk on the U.S. expansion, the technical weakness could find fundamental justification. Similarly, if AI chip demand visibility narrows, the selling pressure could deepen. Meanwhile, the 2027 price hike plan — while positive for long-term margins — could trigger demand caution from major customers in the near term.
Positioning and Volatility: A Market at a Crossroads
Overall, TSMC stock presents a technically bearish short-term setup against a fundamentally compelling long-term story. The daily chart signals a neutral-to-weak regime. The hourly chart confirms active bearish pressure. The 15-minute chart shows only a pause — not a pivot. Volatility remains elevated with a daily ATR of $15.39, meaning intraday swings can be punishing for undisciplined positioning.
The $398–$403 zone is now the immediate battleground. How TSM handles that range in the sessions ahead will likely determine the next directional move. Either this becomes a buyable pullback within a longer uptrend, or it marks the beginning of a deeper corrective phase. Caution is warranted until the hourly regime flips. The daily MACD must stabilize, and price must reclaim at least the nearest EMA resistance. Until then, the chart deserves as much attention as the earnings release.
FAQ
Is TSMC stock a buy right now?
Based on the technical picture, caution is warranted. The daily chart shows a neutral-to-bearish regime with TSMC stock below both the 20-day and 50-day EMAs. The hourly chart confirms active bearish pressure with a full bearish stack. A recovery above the $410–$415 zone would be needed to shift the near-term bias. Until then, the weight of evidence leans bearish in the short run.
What are the key support levels for TSMC stock?
Immediate support sits at $398.50, which is the daily S1 pivot level. Below that, the lower Bollinger Band at $390.81 becomes the next target. For longer-term perspective, the 200-day EMA at $360.75 provides structural support and remains far below the current price.
Why is TSMC stock falling despite record earnings?
Aggressive CapEx commitments and already-elevated expectations have tempered market enthusiasm despite record Q2 results. Geopolitical risk tied to Taiwan remains a persistent discount factor on the stock. The market also appears to be pricing in execution risk on the U.S. expansion and near-term margin uncertainty tied to the $100 billion CapEx plan.
Disclaimer: This article is for informational purposes only and does not constitute financial advice, an investment recommendation, or a solicitation to buy or sell any financial instrument or cryptocurrency. The analysis provided is not indicative of future results. Investing in crypto assets and financial markets carries a high risk of capital loss. Always do your own research (DYOR) and consult a qualified financial advisor before making any decision.
Article produced with the assistance of artificial intelligence and reviewed by the editorial team.
