

Taiwan Semiconductor stock maintains a structurally bullish daily posture, but short-term momentum is wavering. TSM closed at $432.35 on June 26, above key moving averages. Strong fundamentals support the bull case, yet the hourly chart signals an active pullback in progress.
Summary
Key takeaways
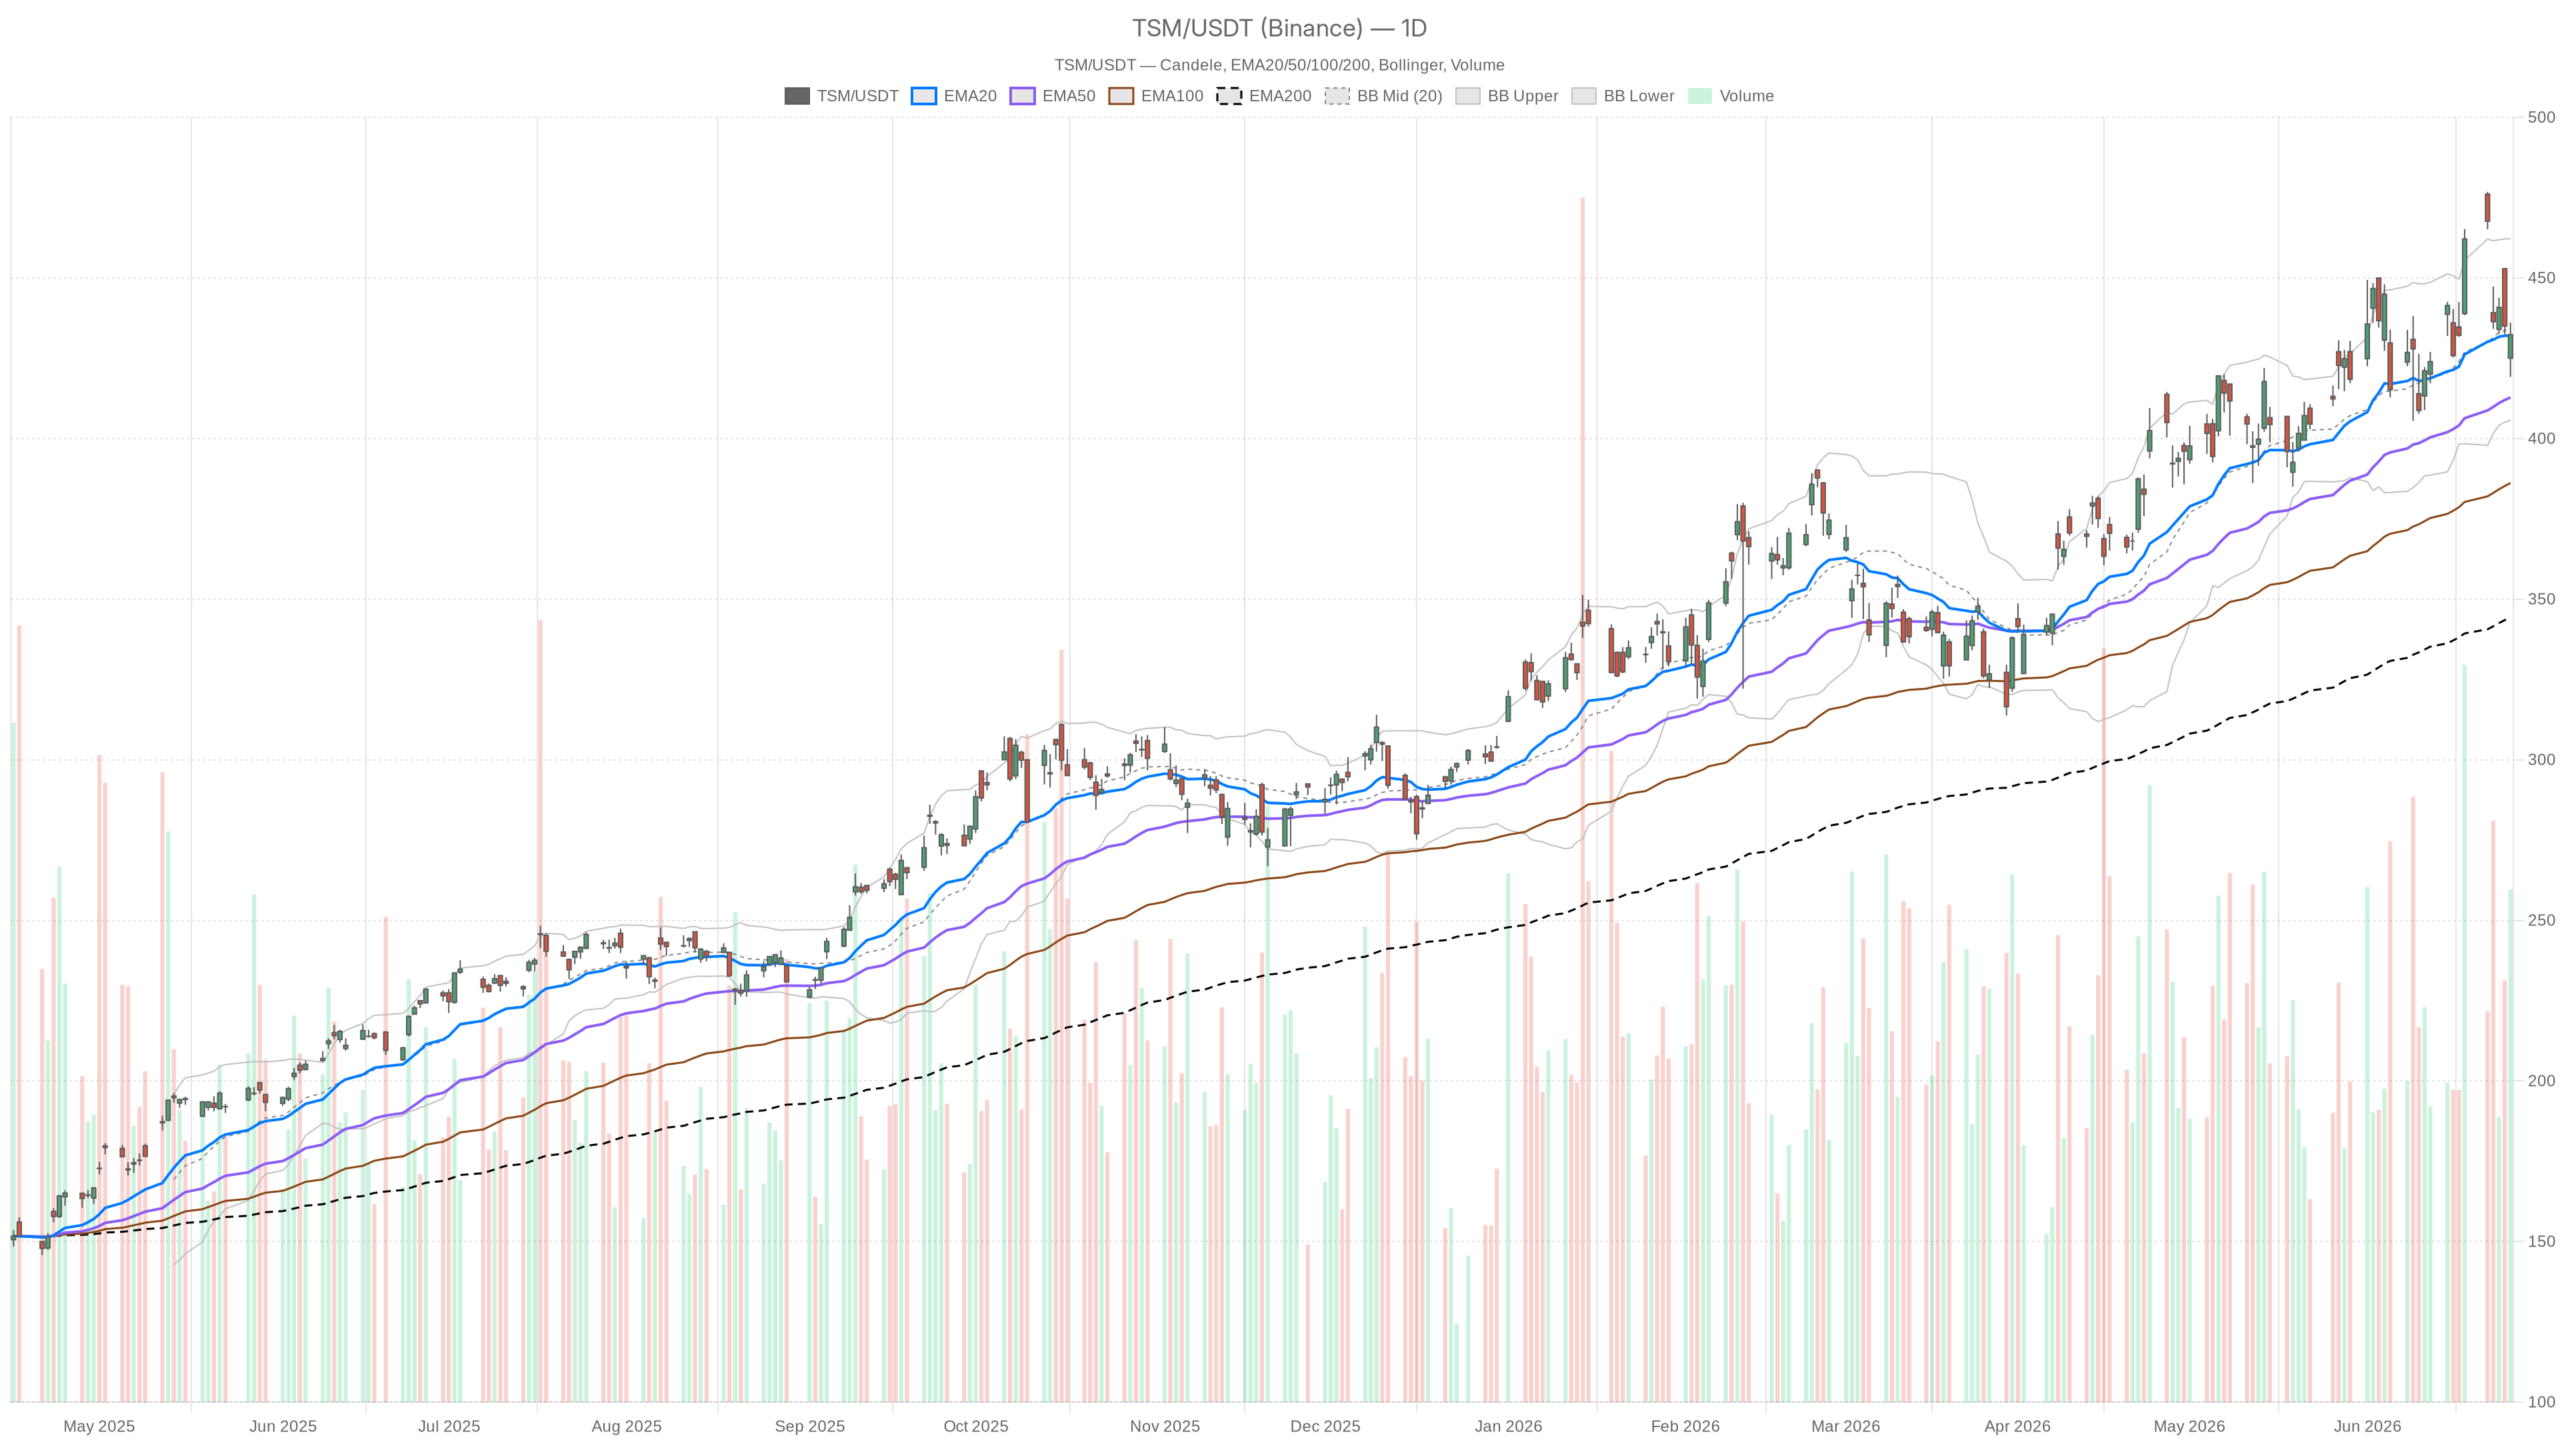
- TSM closed at $432.35 on June 26, holding above the 20-day, 50-day, and 200-day EMAs in a firmly bullish daily structure.
- The hourly chart reflects an active pullback, with price below both the 1H EMA20 and EMA50 and RSI at 43.2.
- Bank of America raised its price target to $590, implying roughly 36% upside from current levels.
- The daily MACD histogram has turned negative, signalling momentum deceleration rather than a trend reversal.
- Key support sits in the $422–$429 zone; a break below the daily EMA20 at $432.04 would flip near-term structure neutral.
Taiwan Semiconductor Stock Daily Structure: Trend Firmly Bullish
The daily chart confirms a firmly bullish structure for Taiwan Semiconductor stock. All key moving averages are aligned in the correct order, and the broader uptrend remains well supported by institutional flow.
The EMA stack is perfectly ordered on the daily timeframe. The 20-day EMA at $432.04 and the 50-day EMA at $412.79 are both trending higher beneath current price. Meanwhile, the 200-day EMA at $344.35 sits nearly $88 below the last close. That gap underscores how much ground TSM has covered in the broader rally. Such separation between price and the 200-day EMA reflects a sustained institutional bid, not a speculative bounce.
Momentum Indicators Signal Deceleration, Not Reversal
Daily RSI at 51.69 is neutral-to-slightly-bullish. It is not overbought, which is notable given the extent of the underlying rally. There is room for further upside before momentum becomes a concern. However, the daily MACD presents a mild red flag. The MACD line at 8.47 sits below the signal line at 9.69, producing a histogram reading of -1.22. The line remains positive, confirming the trend is intact. Yet the histogram turning negative indicates a loss of upward momentum. This is a deceleration signal, not a reversal signal.
The Bollinger Bands on the daily chart place current price near the midpoint at $433.99, well between the upper band at $462.23 and the lower band at $405.75. TSM is not stretched in either direction. That middle-band positioning suggests the stock is digesting recent gains rather than breaking down. Daily ATR at $19.73 reflects healthy, tradeable volatility. Meanwhile, daily pivot analysis places support at $422.32 (S1) and resistance at $439.26 (R1). The close at $432.35 is above the pivot point of $429.22, a mild intraday bias toward the bulls.
Hourly Timeframe Signals Active Pullback for TSM
The hourly chart tells a different story. Taiwan Semiconductor stock is experiencing an active pullback on the 1H timeframe, with bearish momentum clearly in control. However, this pullback does not yet threaten the larger daily bullish structure.
Price at $432.26 is below the 1H EMA20 at $436.21 and the 1H EMA50 at $439.01. Both of those moving averages are acting as overhead resistance in the near term. Notably, TSM is above the 1H EMA200 at $428.96, which provides a meaningful short-term floor. A break below that level would signal a more meaningful deterioration in hourly structure.
The 1H MACD line at -3.72 is below the signal line at -3.43, confirming bearish momentum on this timeframe. The histogram at -0.29 is slightly improving, but the trend remains negative. At the same time, the 1H RSI at 43.2 is approaching oversold territory without yet triggering it. This suggests there may be a little more near-term weakness before buyers step back in. The 1H Bollinger Band midpoint at $436.54 confirms that price has slipped below its short-term mean. Overall, the hourly regime is classified as neutral, but the lean within that neutrality is clearly bearish.
Taken together, the hourly data points to an active pullback from recent highs. This does not invalidate the daily bullish structure. It does, however, suggest that the path to new highs involves working through current overhead resistance first.
15-Minute Chart Shows Early Stabilisation
The 15-minute chart offers tentative signs that TSM is stabilising near support. While the trend remains neutral on this timeframe, early constructive signals are emerging.
The MACD histogram turned positive at 0.30, even as the MACD line remains slightly negative at -0.31. RSI on the 15m frame is near-neutral at 50.02. Price has also reclaimed the 15m EMA20 at $431.92, which is a short-term constructive signal. The 15m regime is neutral, consistent with a market consolidating rather than breaking lower.
The 15m pivot support at $431.12 is close by. A hold above that level on a closing basis would keep the near-term execution context intact for dip buyers. Conversely, a decisive break below it would expose the 1H EMA200 support zone around $428.96.
Fundamental Backdrop Reinforces Bullish Thesis for Taiwan Semiconductor Stock
The fundamental picture for Taiwan Semiconductor stock aligns squarely with the bullish daily structure. Hard data and analyst actions point to sustained demand, not speculative enthusiasm.
TSM’s May monthly sales jumped 30% year-over-year — a hard number that reflects genuine AI-driven demand, not anticipation. UBS has raised its price target and reiterated a Buy rating ahead of Q2 earnings. Bank of America lifted its target to $590 from $490 on June 24. These are not minor incremental adjustments. A $590 target represents roughly 36% upside from current levels. This implies that major institutional desks see the current price as far from stretched.
In addition, TSMC’s 10-year advanced packaging partnership with Amkor in Arizona signals a long-term commitment to onshoring U.S. semiconductor capacity. That kind of structural initiative reduces geopolitical risk perceptions over time. It also underpins the sustained institutional interest reflected in the daily chart.
Bullish Scenario for TSM
The primary bull case rests on the daily trend remaining intact. For upside to resume, TSM must reclaim the 1H EMA50 at $439.01 and clear the daily R1 resistance at $439.26.
A close above that zone would signal that the current hourly pullback is resolved and the larger trend has resumed. From there, the Bollinger upper band at $462.23 becomes the logical next target on the daily chart. The strong analyst consensus, including BofA’s $590 target, provides a fundamental anchor for continued positioning.
Bearish Scenario for Taiwan Semiconductor Stock
The bearish case hinges on hourly weakness spreading into the daily structure. A close below the daily S1 at $422.32 would serve as an early warning sign.
More critically, a sustained break below the daily EMA20 at $432.04 — essentially at current price — would flip the near-term daily structure neutral. Below the daily EMA50 at $412.79, the bullish thesis would be materially weakened. The daily MACD histogram already flipping negative is worth watching closely. If the MACD line itself crosses below the signal line on the daily chart, that would confirm a more meaningful momentum shift.
Positioning and Volatility Outlook
Overall, Taiwan Semiconductor stock remains in a bullish regime at the macro level. However, short-term traders face a conflicted signal environment. The daily trend is intact, fundamental news flow is supportive, and major institutions are raising price targets. Yet the hourly chart reflects active selling pressure that needs to be absorbed before the next leg higher can develop.
With daily ATR near $20, the stock has ample room for intraday swings in either direction. Patience at current levels is warranted. The setup favours buyers on confirmed dips toward the $422–$429 daily support zone rather than chasing strength at current prices. Q2 earnings will likely serve as the next major catalyst to resolve this near-term directional uncertainty.
FAQ
Is Taiwan Semiconductor stock still in a bullish trend?
Yes. The daily chart confirms a bullish structure with all key EMAs aligned in the correct order. TSM closed at $432.35 on June 26, well above the 200-day EMA at $344.35. However, the hourly chart shows an active pullback, introducing short-term uncertainty.
What are the key support levels for TSM right now?
The nearest support is the 1H EMA200 at $428.96, followed by daily S1 at $422.32 and the daily EMA50 at $412.79. A break below the daily EMA20 at $432.04 would weaken the near-term bullish case and flip short-term structure to neutral.
What is the analyst outlook for Taiwan Semiconductor stock?
Analyst sentiment is strongly bullish. Bank of America raised its target to $590, implying roughly 36% upside. UBS reiterated a Buy rating ahead of Q2 earnings, and May sales jumped 30% year-over-year, driven by AI-related demand.
What would flip the bullish thesis bearish for TSM?
A sustained break below the daily EMA50 at $412.79 would materially weaken the bullish case. Additionally, if the daily MACD line crosses below the signal line, that would confirm a meaningful momentum shift from bullish to bearish.
Disclaimer: This article is for informational purposes only and does not constitute financial advice, an investment recommendation, or a solicitation to buy or sell any financial instrument or cryptocurrency. The analysis provided is not indicative of future results. Investing in crypto assets and financial markets carries a high risk of capital loss. Always do your own research (DYOR) and consult a qualified financial advisor before making any decision.
Article produced with the assistance of artificial intelligence and reviewed by the editorial team.