




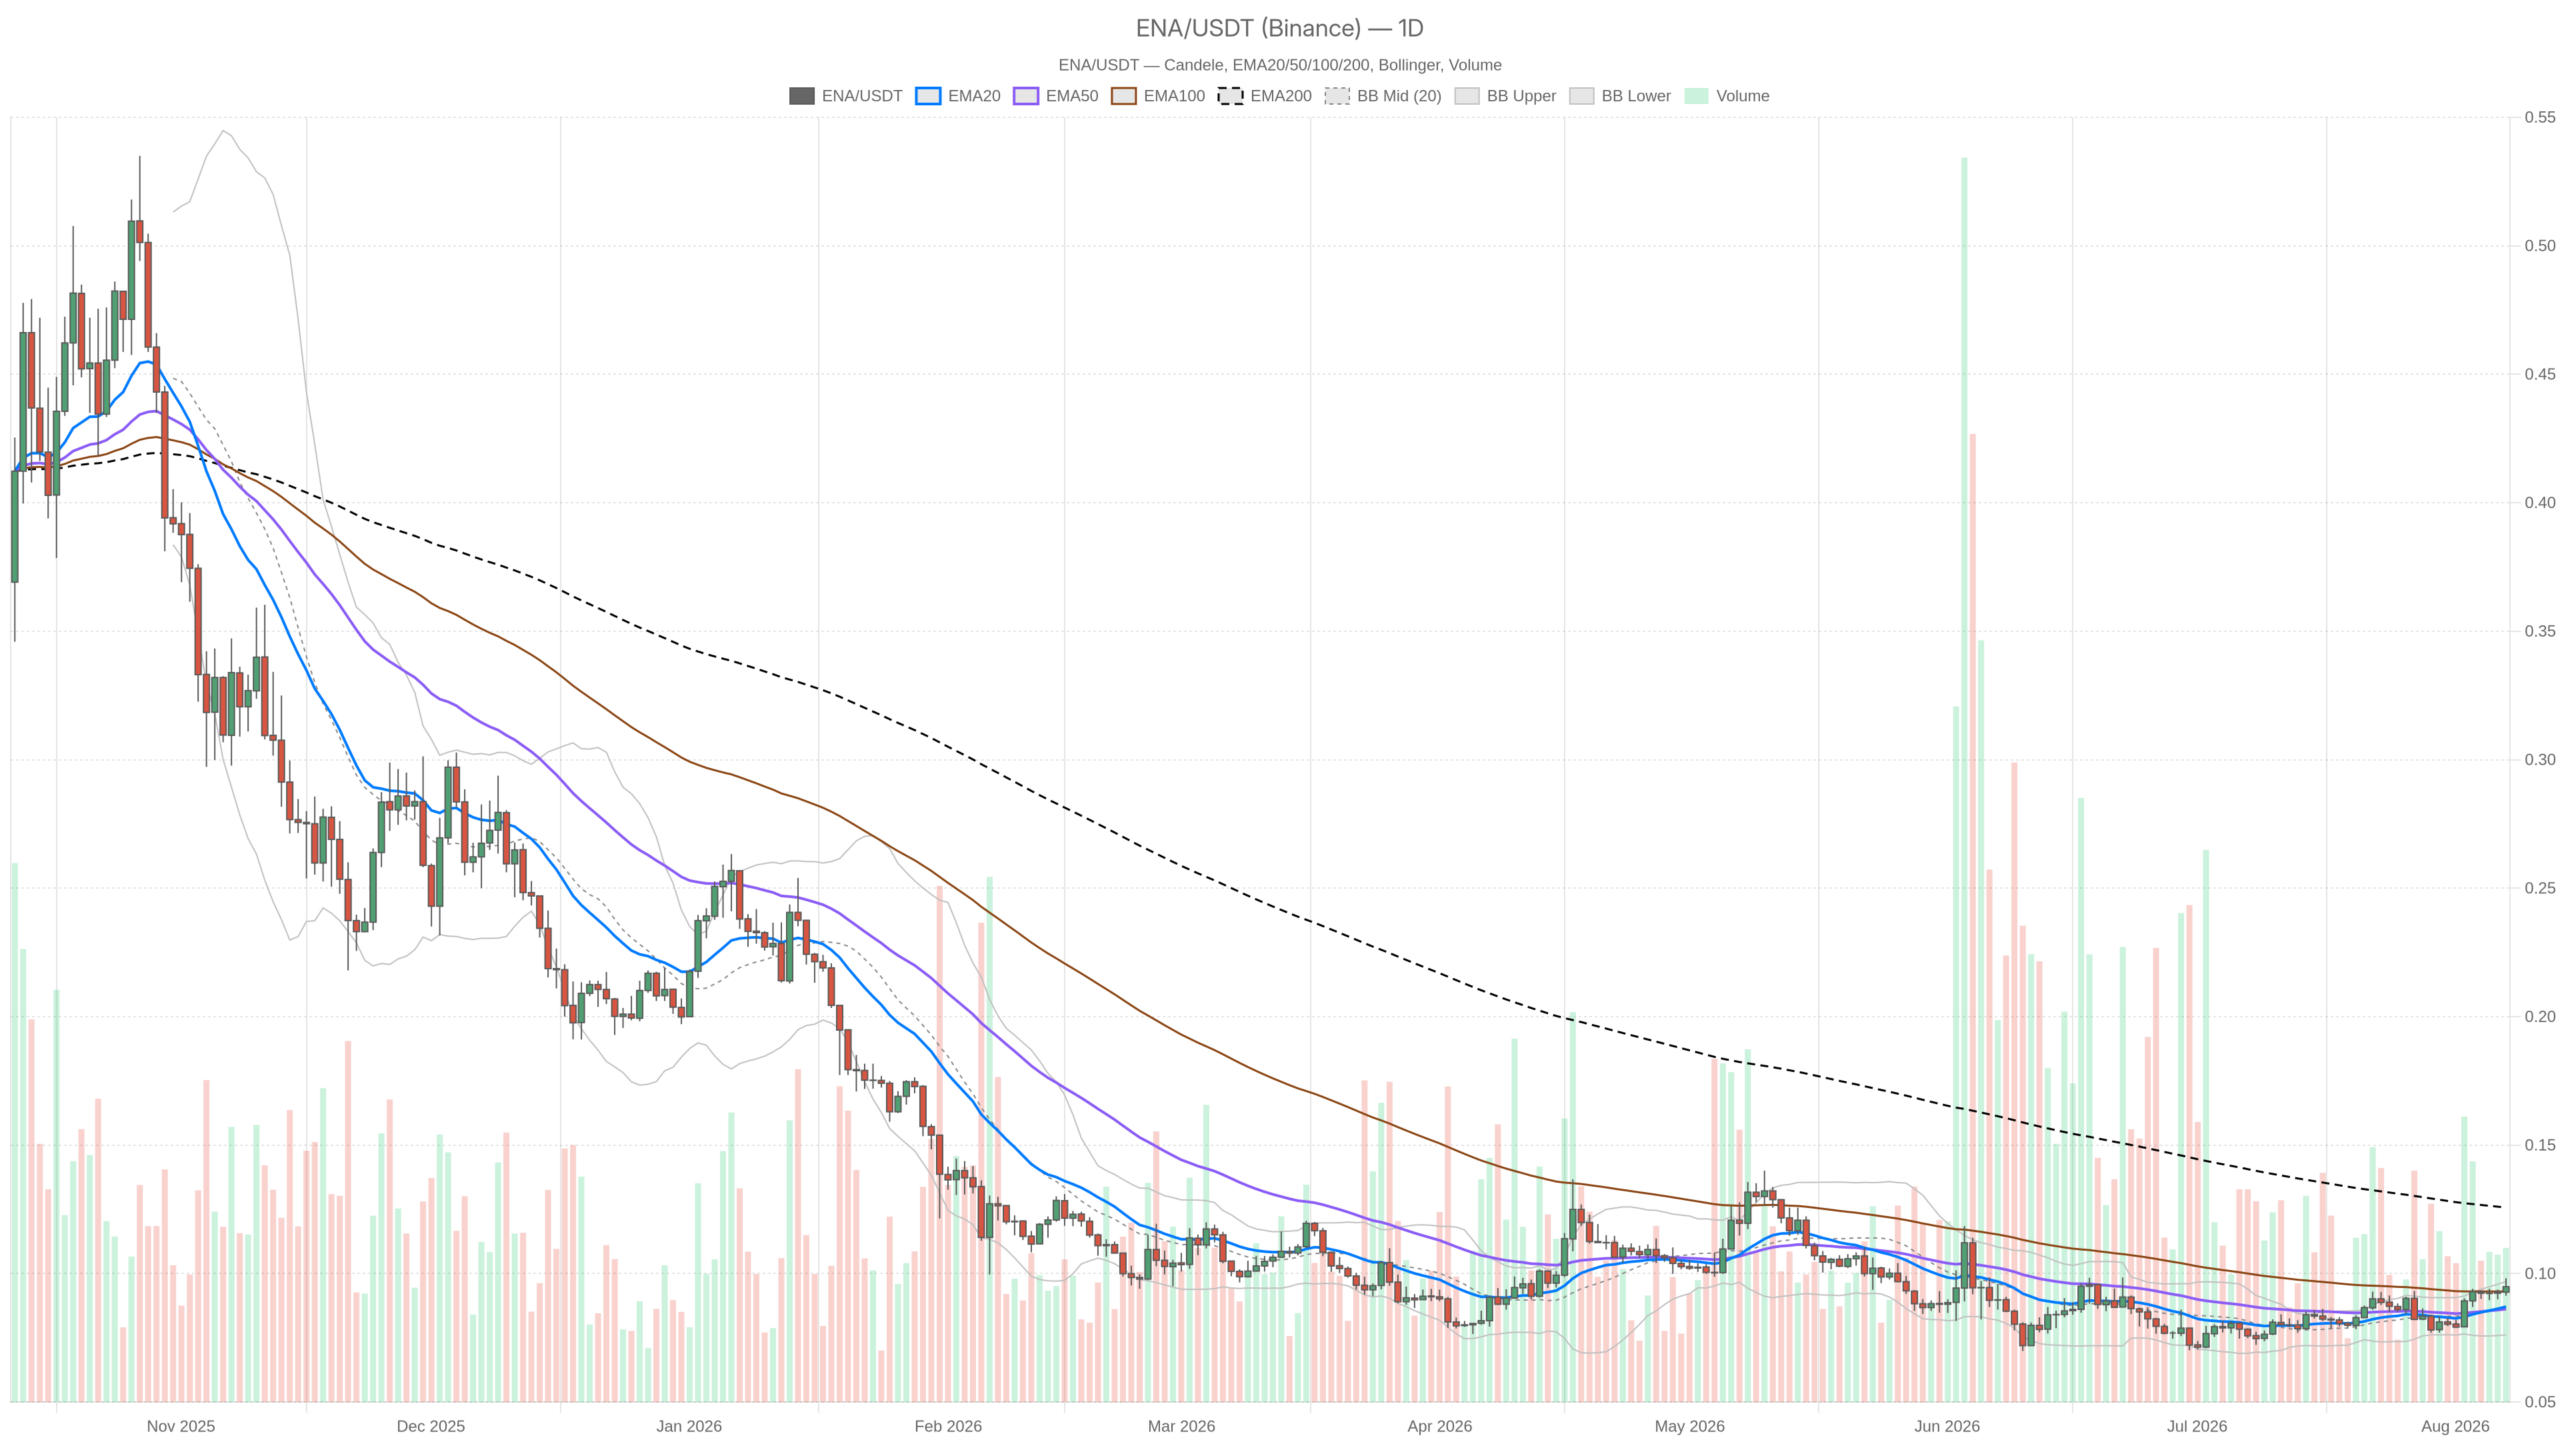
As of August 7, 2026, Ethena crypto finds itself in a precarious stalemate: ENAUSDT is pinned around 0.09 against USDT, stuck to its 20- and 50-day averages, while the 200-day exponential average looms at 0.13. Nothing is breaking — and that compression is precisely the story.
Summary
Key takeaways
- ENAUSDT is trading at 0.09, compressed between its 20- and 50-day EMAs, while the EMA200 at 0.13 keeps the broader trend structurally bearish.
- Daily RSI at 62.83 shows constructive short-term momentum, but a flat daily MACD signals zero trend energy behind the bounce.
- The Fear & Greed index reads 29 and Bitcoin dominance sits at 56.78%, creating a defensive macro environment that starves altcoins of speculative capital.
- The 0.10 resistance — where the Bollinger upper band and pivot R1 converge — is the critical level; failure at 0.09 support opens a direct path to 0.08.
Why the Daily Chart Defines a Neutral-to-Bearish Bias
The daily chart for ENAUSDT is neutral-to-bearish because price at 0.09 sits far below the EMA200 at 0.13, keeping every rally structurally a counter-trend move inside a broken uptrend. The daily structure is officially neutral, and the internals confirm it rather than contradict it. Price at 0.09 is sitting exactly on the EMA20 and EMA50, both also at 0.09 — a market with no short-term directional memory left. Buyers and sellers have fought to a draw across the last few weeks, and the moving averages have collapsed into the price rather than fanning out.
That compression does not tell you the direction of the break by itself. However, as long as spot trades a wide distance below the EMA200, the burden of proof stays with the buyers. Reclaiming 0.13 is not a nearby technical detail — it represents a completely different market regime, and nothing in the current data suggests it is imminent.
Momentum is where the tension shows up. Daily RSI at 62.83 is firmly in the upper half of its range, which is genuinely constructive: sellers are not in control of the short-term impulse, and dips have been getting absorbed. Yet that strength is happening while price remains miles beneath the 200-day, and while the daily MACD is effectively flat — line, signal and histogram all sitting on the zero line. In other words, there is buying interest but zero trend energy behind it. When RSI and MACD disagree, the honest read is range, not reversal.
Volatility Is the Real Tell: Bollinger Bands and ATR
The daily Bollinger structure has price at the midline of 0.09, with the upper band at 0.10 and the lower at 0.08. That narrow envelope frames the entire near-term battlefield. However, bands this tight usually resolve with an expansion move rather than a slow drift, and because the daily regime is neutral, that expansion can fire in either direction. Traders who treat the upper band as an automatic target are guessing.
Daily ATR at 0.01 puts hard numbers on the risk. On a 0.09 asset, an average true range of one cent is proportionally enormous — a single normal session can move this token by a double-digit percentage. Moreover, that matters far more for position sizing than any signal on the chart. On the hourly and 15-minute timeframes, ATR is compressed to effectively nothing, the classic signature of a market resting before it moves. Quiet intraday volatility on top of a large daily range is not safety; it is stored energy.
Pivot Levels: The Map Everyone Is Trading Against
Daily pivots put the pivot point at 0.09, resistance at 0.10 and support at 0.09 — a mechanically tight cluster that mirrors the Bollinger read. The hourly pivot set is subtly more revealing: the pivot point sits at 0.10 with R1 also at 0.10 and S1 at 0.09. That means intraday price is currently trading beneath its own hourly pivot, and the 0.10 area is where two independent frameworks — Bollinger upper band and pivot resistance — line up. That is the level that decides whether this compression is a base or a pause before another leg down.
Where the Timeframes Fight Each Other
The multi-timeframe picture for ENAUSDT is not aligned: the hourly chart reads mildly bullish while the 15-minute is showing weakness, placing the market in transition rather than presenting a clear signal. This is the part worth slowing down on, because the picture for Ethena crypto is conflicted and pretending otherwise would be dishonest.
The hourly regime reads bullish with structural backing: price at 0.09 is sitting on EMA20, EMA50 and EMA200 all clustered at 0.09, meaning the intraday trend has fully repaired itself and is no longer capped by longer-term hourly resistance. Hourly RSI at 55.37 is mildly positive without being stretched — the kind of reading that supports grinding continuation rather than a violent squeeze. That said, the hourly MACD, like the daily, is flat at zero. The hourly says: bias slightly up, conviction low.
The 15-minute chart disagrees in a specific way. Price is trading below the 15-minute EMA20 at 0.10 while the EMA50 and EMA200 sit at 0.09, and RSI has slipped to 42.81 with the Bollinger midline overhead at 0.10. That is a short-term rejection from the 0.10 zone, not a breakdown. In execution terms, anyone buying strength right now is buying into immediate resistance while the fastest timeframe is still cooling. Consequently, the cleaner sequence is to let the 15-minute reclaim 0.10 and hold it before treating the hourly bullish lean as actionable.
The Macro Catalyst Nobody Should Ignore
Broader risk appetite across the speculative complex has taken a visible hit, and the macro data explains why a Fear & Greed reading of 29 coexists with a crypto market cap that is technically green on the day. Crypto is not pricing panic; it is pricing caution. CNBC reported on July 31, 2026 how Leopold Aschenbrenner built a $45 billion AI hedge fund and lost most of it in days — the kind of event that resets leverage tolerance well beyond the fund in question. Blow-ups of that scale tighten risk desks and shrink allocations to high-beta assets.
The on-chain fee data reinforces that rotation. DefiLlama figures show Curve DEX fees down 60.22% on the day and 61.63% over the week, with Uniswap V3 fees off 29.48% daily and 29.94% weekly — a broad cooling in the venues where stablecoin and blue-chip DeFi flow usually concentrates. Yet Ekubo fees are up 112.33% in a day and 78.78% on the week, and Fluid DEX is up 61.39% weekly. That is not a market with no money in it; it is a market where money is chasing narrower, faster corners while the core venues go quiet. For a token like ENA, whose fortunes are tied to DeFi activity and stablecoin-driven demand, softening flow at the biggest pools is a headwind that no oscillator will show you.
The Bullish Case — and What Kills It
The bullish case requires ENAUSDT to break and hold above 0.10, confirming the hourly regime and triggering the flat daily MACD to lift off zero. The constructive path is straightforward. Buyers need to push above the daily Bollinger upper band and daily R1 at 0.10, and — critically — hold it as support rather than tag it and fade. With daily RSI already at 62.83, the momentum tank is not empty; it just needs a trigger. In that scenario the compression resolves upward and the conversation shifts to how much distance can be closed toward the far-off EMA200 at 0.13.
What invalidates it: a rejection at 0.10 followed by a loss of the 0.09 shelf where the daily EMA20, EMA50 and pivot support all converge. If that cluster gives way, the bullish thesis is not weakened — it is finished, because there is no intermediate structure left between there and the lower Bollinger band at 0.08.
The Bearish Case — and What Kills It
The bearish case rests on the status quo persisting: price below the 200-day EMA at 0.13, Bitcoin dominance at 56.78%, sentiment at 29, and fee revenue draining out of the largest DEX venues. If 0.09 fails, the lower band at 0.08 becomes the magnet, and with daily ATR at 0.01 that move can happen inside a single session. The tell would be repeated failures at the 0.10 pivot combined with the 15-minute RSI staying capped below the mid-40s — sellers defending overhead supply while buyers refuse to raise their bid.
What invalidates it: a decisive daily close above 0.10 with the MACD histogram turning genuinely positive, and Bitcoin dominance easing off its current level. Dominance rolling over is arguably the single most important external condition here — altcoins do not sustain breakouts while capital is consolidating into BTC.
Positioning Into a Coiled Market
In this low-information, high-risk environment, patience trumps prediction. Waiting for 0.10 to be reclaimed and held, or for 0.09 to fail on volume, converts a coin-flip into a defined setup. The practical reality is that every daily moving average, the Bollinger midline and both pivot references have converged around 0.09, which means stop placement and target placement are competing for the same few basis points. That is a structural problem — it is what tight compression on a sub-dime asset does to risk-reward math. Moreover, the price data is quoted to two decimals, so the difference between holding support and losing it may live inside the rounding; treating 0.09 as a zone rather than a line is the more realistic approach.
In a market where the Fear & Greed index reads 29 and aggregate volume is contracting, being early is functionally the same as being wrong. Volatility will return — ATR at 0.01 on a 0.09 token guarantees it. The open question is only which side of the range gets taken out first, and nothing in the current data set answers that with confidence. Anyone claiming otherwise is reading conviction into a flat MACD.
FAQ
What is the current price of Ethena crypto?
As of August 7, 2026, ENAUSDT is trading around 0.09 against USDT, sitting directly on its 20- and 50-day exponential moving averages. The 200-day EMA sits significantly higher at 0.13, keeping the broader trend structurally bearish.
Is ENAUSDT bullish or bearish right now?
The daily chart is neutral-to-bearish. While daily RSI at 62.83 shows constructive short-term momentum, price remains far below the 200-day EMA at 0.13, and the daily MACD is flat at zero — indicating no trend energy behind the bounce. The hourly chart leans mildly bullish, but the 15-minute timeframe shows short-term rejection from the 0.10 zone.
What are the key levels to watch for Ethena crypto?
The critical resistance is 0.10, where the daily Bollinger upper band and pivot R1 converge. Support sits at 0.09, where the daily EMA20, EMA50 and pivot support all cluster. A break below 0.09 opens the path to 0.08; a decisive close above 0.10 shifts the conversation toward the 200-day EMA at 0.13.
What macro factors are affecting ENA right now?
The Fear & Greed index reads 29 (Fear), Bitcoin dominance is elevated at 56.78%, and major DEX venues like Curve and Uniswap are showing significant fee declines — all pointing to defensive positioning that starves altcoins of capital. Total crypto market cap is around $2.30 trillion with aggregate volume declining roughly 2% on the day.
Disclaimer: This article is for informational purposes only and does not constitute financial advice, an investment recommendation, or a solicitation to buy or sell any financial instrument or cryptocurrency. The analysis provided is not indicative of future results. Investing in crypto assets and financial markets carries a high risk of capital loss. Always do your own research (DYOR) and consult a qualified financial advisor before making any decision.
Article produced with the assistance of artificial intelligence and reviewed by the editorial team.
