




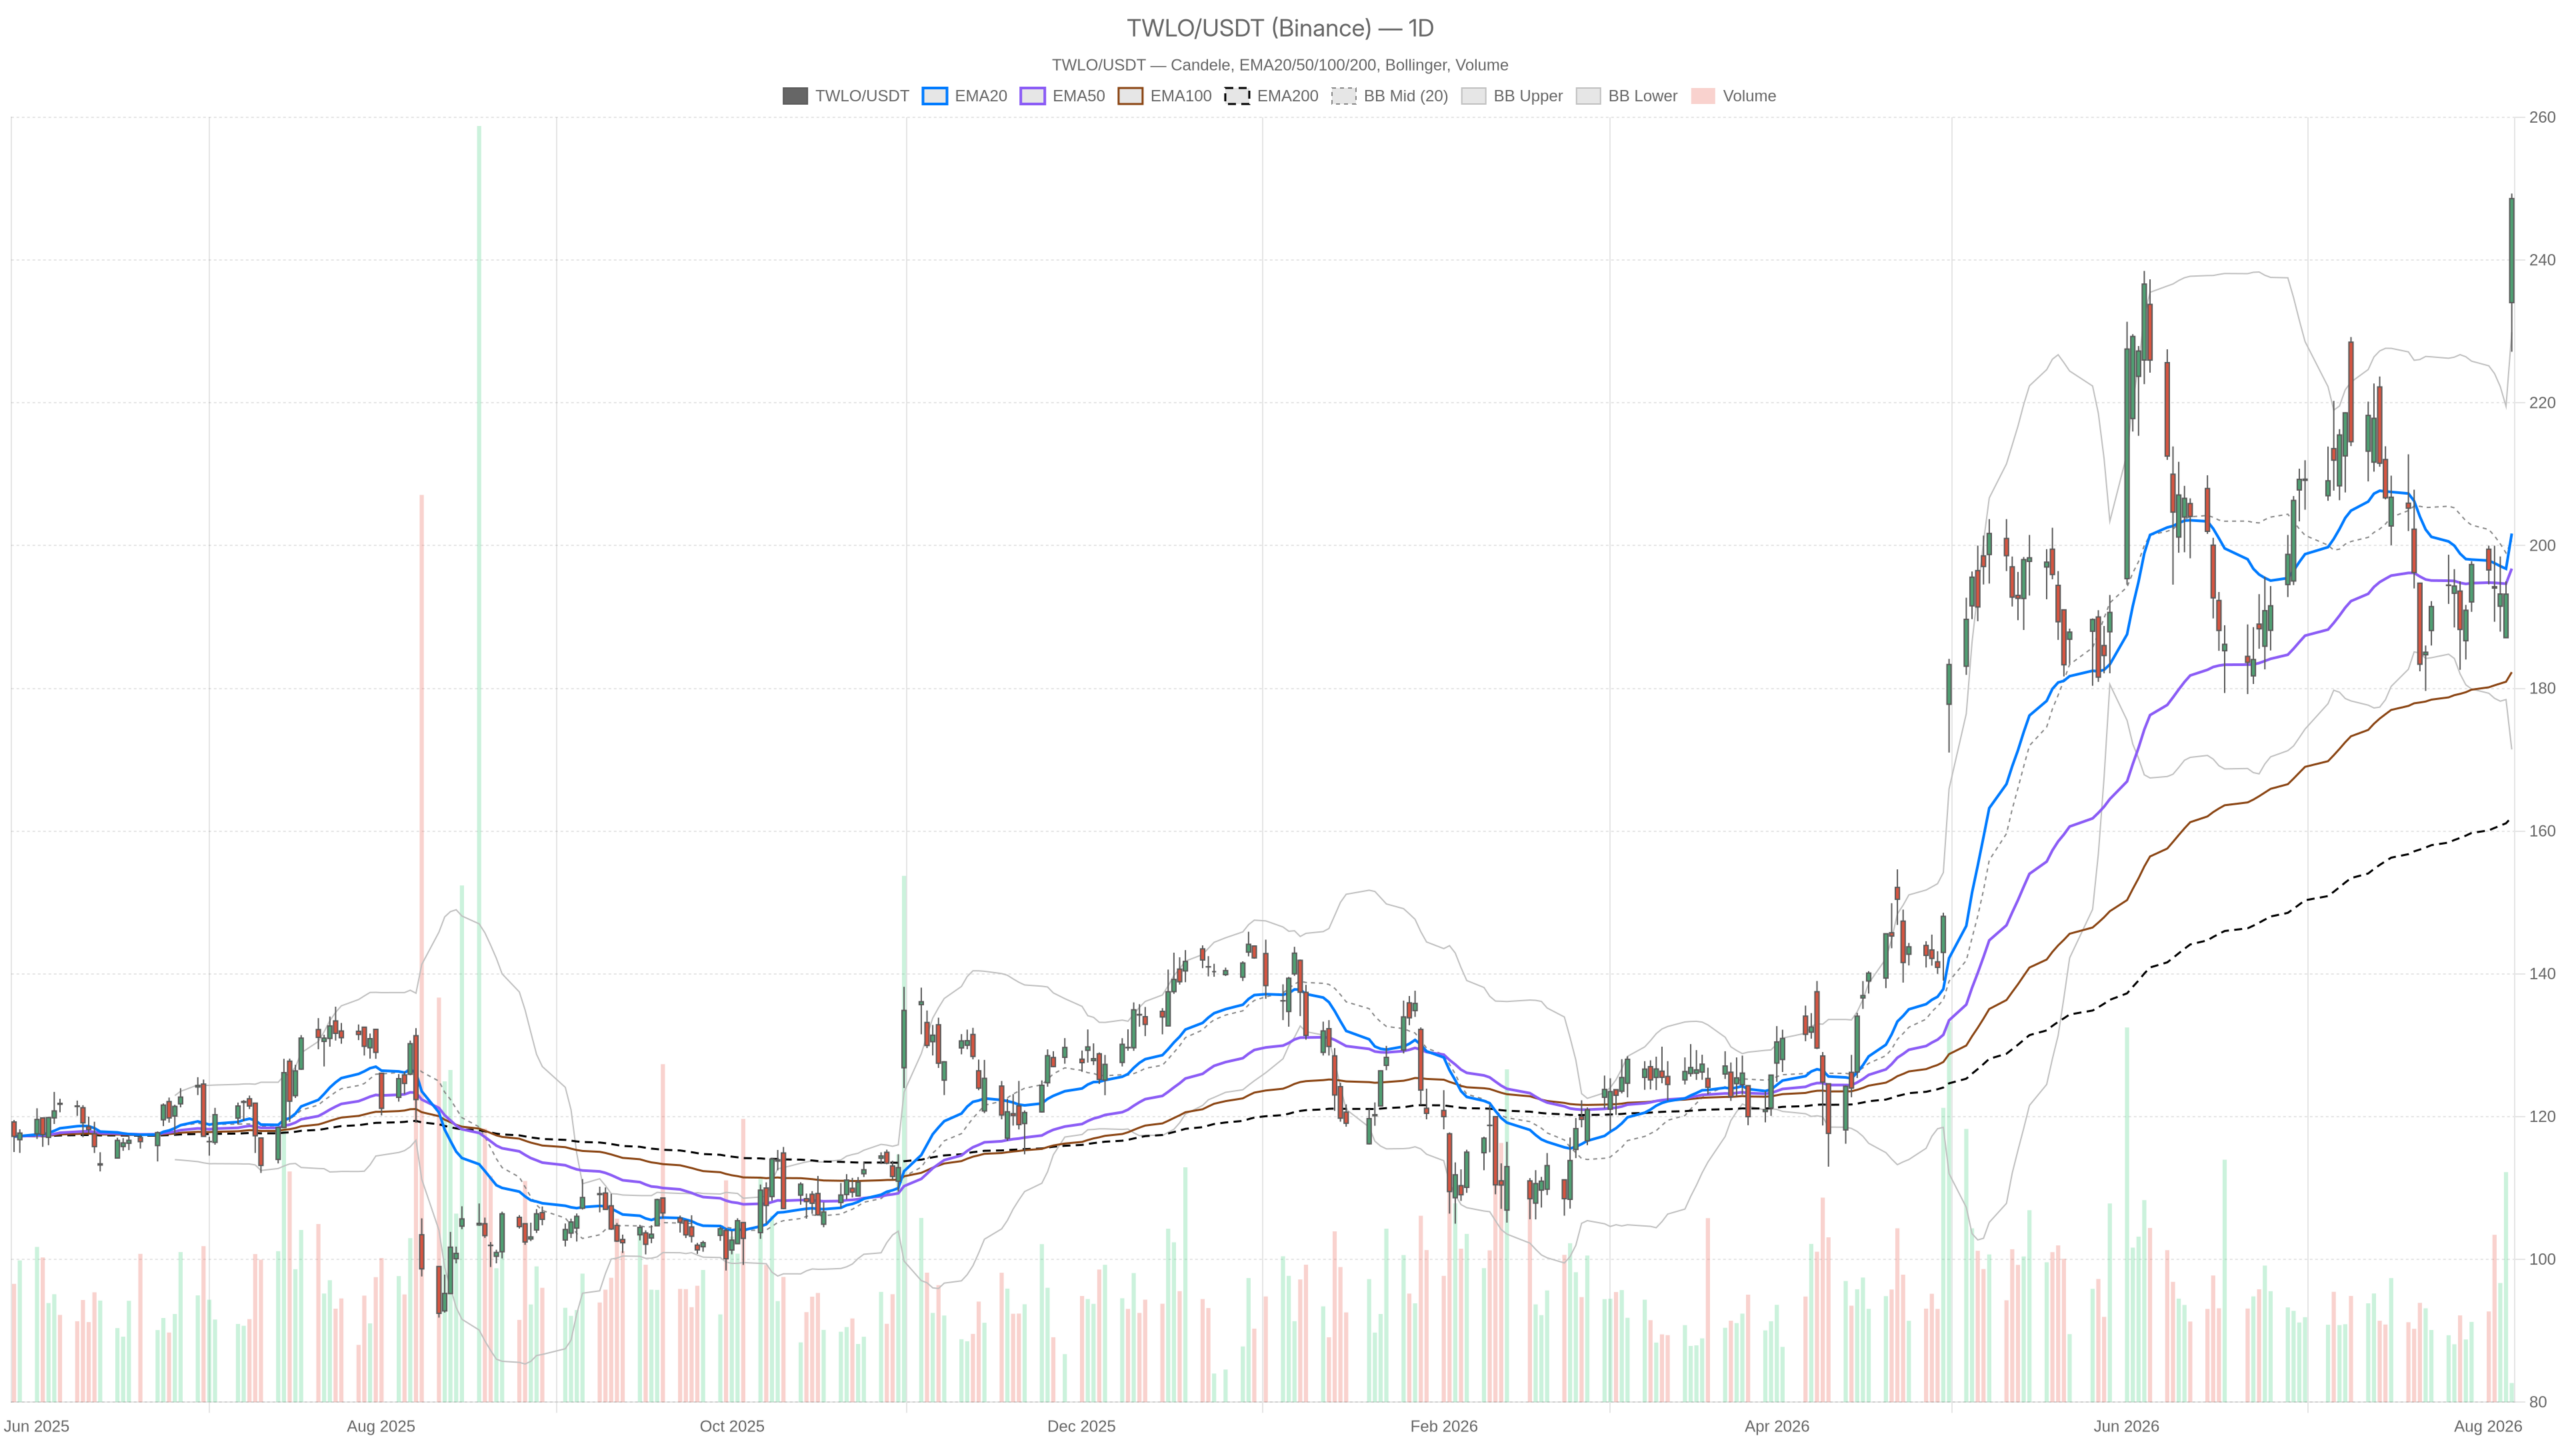
Twilio Inc. stock surged roughly 18% on Friday after Q2 earnings beat consensus with adjusted earnings of $1.47 per share. TWLO closed at 248.62 near the session high of 249.32. The daily chart confirms an accelerating uptrend, yet the move has left the stock stretched across multiple timeframes.
Summary
Key takeaways
- Daily trend is unambiguously bullish with price above all major moving averages and a fresh MACD crossover.
- RSI readings of 75, 86, and 92 across daily, hourly, and 15m timeframes signal extreme overbought conditions.
- Price closed at 248.62, well above the daily upper Bollinger band at 229.90, flagging near-term consolidation risk.
- Key support rests at the daily pivot of 241.70, with deeper support at 234.08 and the 20-day EMA at 201.69.
- Bullish continuation requires consolidation above 241.70 followed by acceptance above 251.01 on the hourly chart.
Why the Daily Chart Still Owns the Bias in Twilio Inc. Stock
The daily timeframe remains unambiguously bullish for Twilio Inc. stock because price sits above all major moving averages and momentum has turned decisively positive. The structure is clear. Price holds above the 20-day EMA at 201.69, the 50-day at 196.78, and the 200-day at 161.97. The moving average stack is correctly ordered and widely spaced. That configuration belongs to a market in an established uptrend, now accelerating on a fundamental catalyst.
Daily momentum confirms the move. MACD has flipped decisively, with the line at 2 above a signal still at -1.21 and a histogram of 3.22. That is a fresh momentum crossover rather than a late-cycle one. Notably, the signal line remains below zero. This means the impulse is young in momentum terms.
Meanwhile, RSI on the daily reads 75.53. Overbought, but overbought in a strong trend is a symptom of demand, not an automatic reversal signal. The Bollinger picture, however, tells a more important story. The upper band sits at 229.90, yet price closed at 248.62. Twilio Inc. stock is trading well outside its own volatility envelope. The mid-band at 200.67 now sits almost 48 points below the market.
Gap Risk and Pivot Structure
That gap matters. Prices that break far outside the bands tend to either consolidate sideways or retrace toward the band edge. Therefore, the bullish bias comes with an explicit warning. The warning is about entry timing rather than direction.
Volatility has also repriced. Daily ATR stands at 12.46, and the session range alone was over 22 points. Position sizing built on pre-earnings volatility is now out of date. At the same time, the daily pivot structure delivers clean reference points. Pivot sits at 241.70, resistance at 256.24, and support at 234.08. The close above the pivot keeps the burden of proof on sellers.
The 1H Timeframe Complicates the Picture
The hourly chart for Twilio Inc. stock reads neutral rather than bullish because the EMA structure still reflects the pre-earnings range. The 1H EMA200 sits at 200.66, above the EMA50 at 197.73. The gap move has left hourly trend structure lagging far behind price. This is a mechanical effect, not a sign of weakness.
Momentum on the hourly, in contrast, is extreme. MACD line at 6.76 versus a 1.38 signal produces a histogram of 5.38. That describes a violent one-directional expansion. RSI at 86.15 confirms it. This is a market being repriced in a hurry, not one being distributed into.
However, that same reading is the core risk. Hourly ATR of 6.79 means a single adverse candle can travel meaningfully against a poorly placed position. Hourly pivots are tight: 246.92 as the reference, 251.01 above, and 244.53 below. Holding above 244.53 keeps the intraday impulse intact. Losing it would be the first genuine sign that the gap is being tested.
15m Execution Context: Chasing Is the Real Enemy
The 15-minute chart warns against chasing Twilio Inc. stock. RSI at 92.06 and price above the upper Bollinger band both flag short-term exhaustion risk. The regime is bullish on this timeframe. The numbers, however, sit near their practical limits. MACD histogram of 6.45 describes a vertical move. Price at 248.49 trades above the upper Bollinger band at 246.93.
At the same time, the 15m EMA structure is clean. The 20 EMA at 211.16 sits above the 50 at 201.24. The 200 EMA rests at 195.14. The message for execution is straightforward. The trend is up, but the short-term chart offers no discount. Intraday pivots at 250.93 and 244.45 frame the immediate battlefield. ATR at 6.11 defines realistic noise.
Bullish Scenario
The constructive path for Twilio Inc. stock requires consolidation above the daily pivot at 241.70. Ideally, price should also hold above the 234.08 support. That level also marks the session open area. From there, acceptance above 251.01 on the hourly opens the door toward daily resistance at 256.24.
Supporting evidence would include daily RSI holding in the 70s while price digests. A rising MACD signal line crossing above zero would add confirmation. Notably, the narrative backdrop helps here. Guidance topped expectations. The AI growth story is clearly something the market is willing to pay for.
Bearish Scenario
The bearish case for Twilio Inc. stock centers on a partial gap fill, not a trend breakdown. Failure to hold 244.53 on the hourly would be the first warning. A subsequent loss of the 241.70 daily pivot would signal that fast money is taking profits.
A break under 234.08 would put the 227.16 low back in play. That would turn the move into a classic post-earnings retracement. Deeper down, the 229.90 upper Bollinger band stands as the first natural magnet. Eventually, the 201.69 EMA20 would come into focus.
What would invalidate the bullish case outright is a different scenario. A daily close back inside the bands with MACD histogram compression would mark the impulse as a one-day event. That outcome would shift the bias from bullish-with-caution to neutral.
Overall, this is a bullish market with a stretched chart. Those two facts must be held together. The daily trend, moving average alignment, and fresh MACD crossover all argue for continuation over time. However, RSI readings of 75, 86, and 92 across three timeframes argue against paying the current print. Volatility has doubled in practical terms. The hourly regime is still classified as neutral. Pivot levels are the only clean structure available. Patience, not conviction, is the scarce resource in TWLO right now.
FAQ
Is Twilio stock still a buy after the 18% surge?
The daily trend remains bullish with a fresh MACD crossover and price above all major moving averages. However, RSI at 75.53 and price far outside the Bollinger bands warn against chasing the current print. The bullish case needs consolidation above 241.70 first.
What are the key support levels for TWLO?
The nearest support is the daily pivot at 241.70. Below that, 234.08 marks the session open area. Deeper supports sit at the upper Bollinger band of 229.90 and the 20-day EMA at 201.69.
What would invalidate the bullish outlook for Twilio Inc. stock?
A daily close back inside the Bollinger bands with MACD histogram compression would mark the post-earnings impulse as a one-day event. That would shift the bias from bullish-with-caution to neutral.
How overbought is TWLO right now?
RSI reads 75.53 on the daily, 86.15 on the hourly, and 92.06 on the 15-minute chart. All three timeframes signal extreme overbought conditions. Price also trades above the upper Bollinger band on both the daily and 15m timeframes.
Disclaimer: This article is for informational purposes only and does not constitute financial advice, an investment recommendation, or a solicitation to buy or sell any financial instrument or cryptocurrency. The analysis provided is not indicative of future results. Investing in crypto assets and financial markets carries a high risk of capital loss. Always do your own research (DYOR) and consult a qualified financial advisor before making any decision.
Article produced with the assistance of artificial intelligence and reviewed by the editorial team.
