




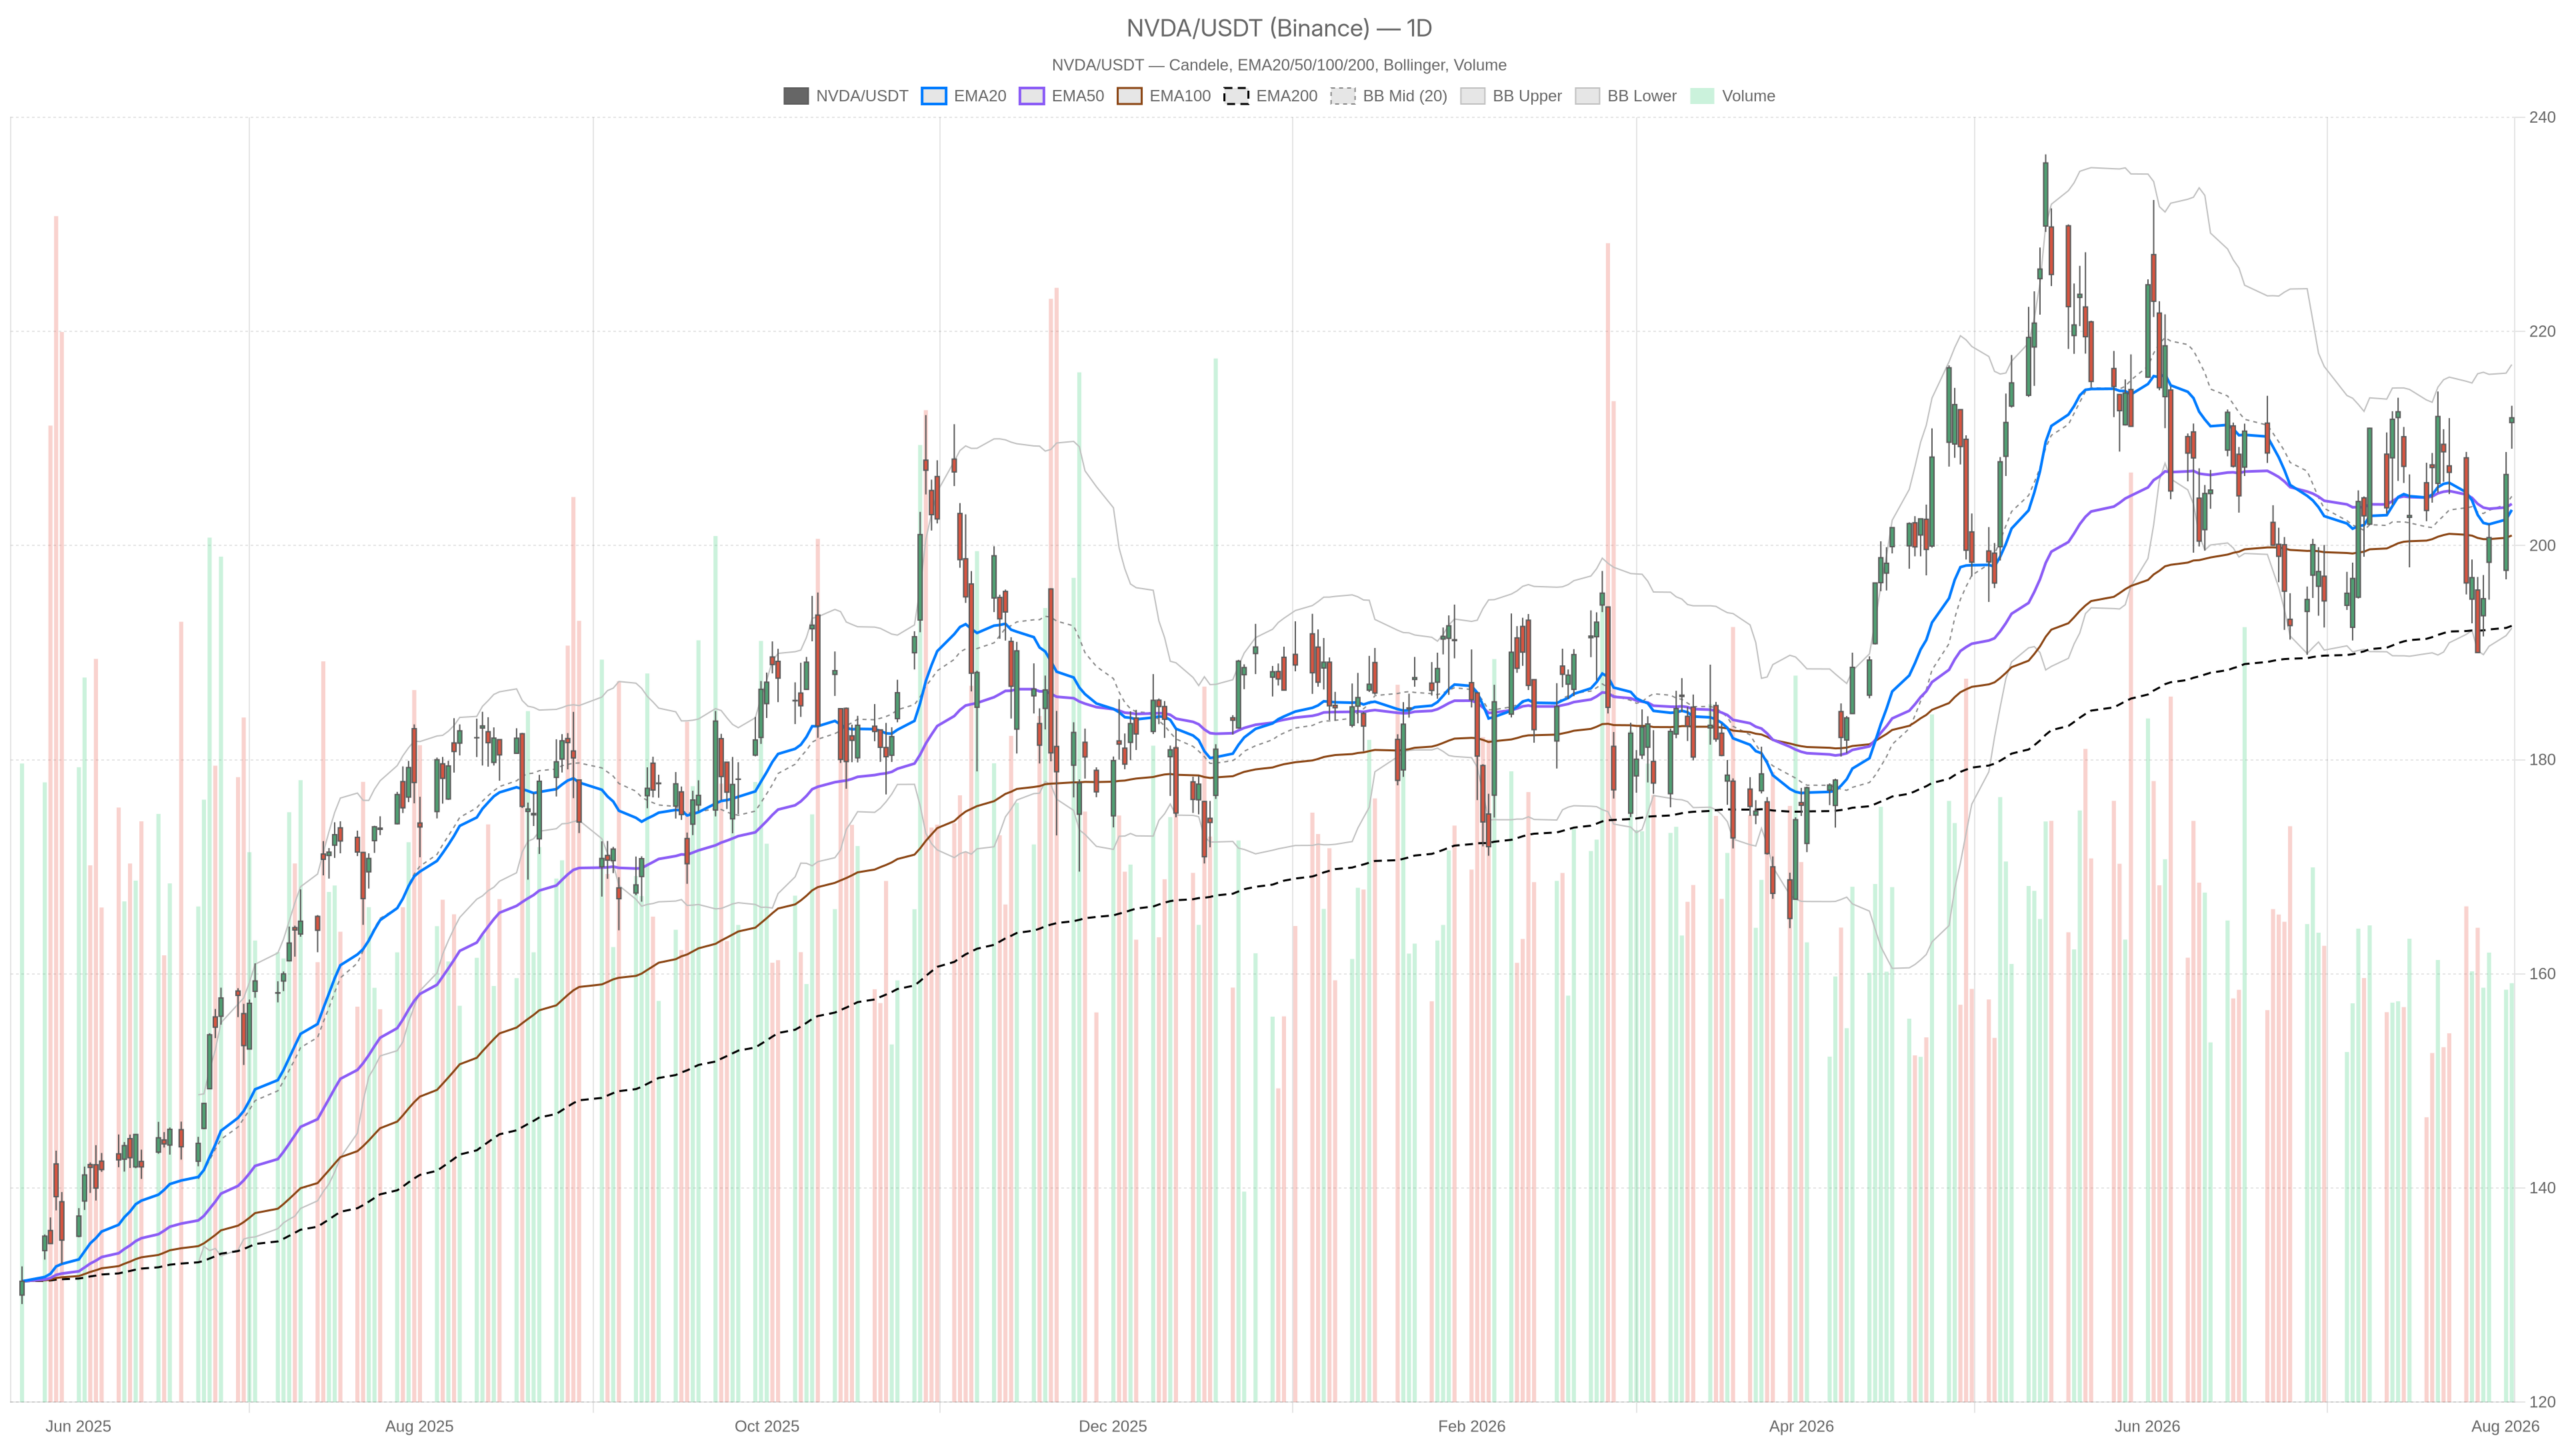
NVIDIA Corporation stock closed Tuesday at $211.94, holding above its 200-day trend line near $192.51 but below pivot resistance at $213.65. The daily structure looks constructive. Yet shorter timeframes are overbought, and with earnings due August 26, consolidation likely dominates near term.
Summary
Key takeaways
- NVIDIA Corporation stock closed at $211.94, just below daily pivot resistance at $213.65
- The daily EMA stack is firmly bullish, though MACD remains negative at -0.41
- Hourly RSI14 has reached 70.46, signaling overbought conditions on shorter timeframes
- Earnings are due August 26; 36 analysts reportedly hold buy ratings on the stock
- ATR14 at 7.75 confirms elevated daily volatility heading into the event
Daily Trend: Structure Bullish, Momentum Still Repairing
The daily trend for NVIDIA Corporation stock is structurally bullish, with price above all three major EMAs, but momentum has not yet fully recovered from a prior pullback.
Price trades above the EMA20 at 203.34, EMA50 at 203.89, and EMA200 at 192.51. That stacked order is a classic bullish structural signal. It confirms the broader uptrend that has carried NVIDIA Corporation stock higher over recent months. However, the MACD line remains negative at -0.41, below its signal at -0.93. The histogram has turned positive at 0.52. This combination points to a market climbing out of a recent pullback rather than one running with full conviction.
Notably, RSI14 at 56.93 supports that reading. It sits comfortably above the neutral 50 line but nowhere near overbought territory. This leaves room for further upside without immediate exhaustion risk. The daily Bollinger Bands frame the range clearly: mid at 204.6, upper at 216.91, lower at 192.29. Price sits between the midline and the upper band. That is typically where trending markets consolidate before extending or fading.
ATR14 at 7.75 confirms that daily volatility remains elevated. The stock has been moving in wide swings. Meanwhile, the daily regime reading is technically tagged neutral. Despite the bullish EMA stack, the trend has not yet fully re-established aggressive momentum.
1H Timeframe: Confirmation With a Warning Sign
The hourly chart confirms the bullish bias for NVDA but adds a clear warning — RSI has pushed into overbought territory.
EMA20 at 206.8, EMA50 at 203.43, and EMA200 at 203.76 are all aligned bullishly. The MACD line at 3.75 sits well above its signal at 3.23, with a positive histogram of 0.52. This is a much stronger momentum signature than the daily chart shows. It confirms buyers have been in control over the past several sessions.
However, RSI14 at 70.46 has pushed firmly into overbought territory. This is where the two timeframes start to diverge in tone. The daily chart says the uptrend has room to run. The hourly chart says the current leg has stretched fast and could be due a pause or a shallow pullback. Price trades between the hourly pivot point at 212.21 and support at 211.44. It sits just below resistance at 212.61. This suggests the market is already digesting that stretch in real time rather than pushing through cleanly.
15-Minute Context: Short-Term Cooling Near Resistance
On the 15-minute chart, the stock shows clear signs of near-term cooling right at resistance, with momentum beginning to fade.
The MACD histogram has flipped negative at -0.11. The line at 1.11 and signal at 1.22 remain close together. That is an early sign of fading short-term momentum right into resistance. Price hovers near the Bollinger midline at 211.43. It sits between the lower band at 209.5 and the upper band at 213.36 — essentially consolidating rather than trending.
RSI14 at 58.55 is neutral. Despite the labeled bullish regime on this timeframe, the tape looks more like a pause than a continuation. For traders using this window purely for execution timing, patience is warranted. The pivot cluster near 212.21–212.61 argues for waiting rather than chasing strength.
News Flow and Positioning Into Earnings
The fundamental backdrop for NVIDIA Corporation stock remains largely constructive ahead of the August 26 earnings report, though a notable contrarian signal has emerged.
NVIDIA reports fiscal 2027 second-quarter earnings on August 26. Sentiment among analysts remains largely constructive. Reportedly, 36 analysts hold buy ratings on the stock. At the same time, a note attributed to Michael Burry has flagged a $250 billion demand risk. This contrarian signal is worth acknowledging even as the broader analyst community stays bullish. Separately, comparative coverage highlights that NVIDIA’s revenue has nearly tripled over two years. AMD’s growth has stalled. This underlines the competitive gap that continues to support the bullish long-term narrative.
Bullish Scenario
The bullish case for NVIDIA Corporation stock rests on the daily EMA stack holding and MACD momentum continuing to build.
A clean move through the daily pivot resistance at 213.65 would be the first confirmation. A subsequent push toward the upper Bollinger band near 216.91 would confirm that momentum is genuinely re-accelerating rather than just stabilizing. Strength on the hourly chart holding above its EMA20 at 206.8 without a meaningful RSI reset would also support continuation. Positive analyst sentiment heading into the August 26 earnings date adds a fundamental tailwind to that technical setup.
Bearish Scenario
The bearish risk for the stock centers on the overbought hourly RSI resolving through a pullback rather than a sideways pause.
A break below the hourly support at 211.44 would weaken the near-term bullish thesis. A daily close under the pivot at 211.35 would add further pressure. A deeper slide toward the daily EMA50 at 203.89 or EMA20 at 203.34 would suggest the recovery in MACD has stalled. This would shift the daily regime from its current neutral reading toward something more clearly corrective. The $250 billion demand risk flagged ahead of earnings also represents a fundamental catalyst. It could accelerate any technical weakness if sentiment shifts.
Closing Take
Overall, NVIDIA Corporation stock is caught between a bullish daily structure and an overbought hourly market — a conflict that typically resolves through consolidation.
Volatility, as reflected in the elevated daily ATR of 7.75, remains a live factor. That is unlikely to fade with earnings just three weeks away. In contrast to the clean bullish alignment further out on the trend, the near-term picture calls for careful positioning. The 211–214 pivot zone will be key. Given the mixed signals across timeframes, patience into the earnings date looks more prudent than conviction in either direction right now.
FAQ
What is the current price of NVIDIA Corporation stock?
NVIDIA Corporation stock closed at $211.94 on Tuesday, sitting just below the daily pivot resistance at $213.65 and above its 200-day trend line near $192.51.
What are the key support and resistance levels for NVIDIA Corporation stock?
Key resistance sits at the daily pivot of $213.65 and the upper Bollinger band near $216.91. Support levels include the hourly support at $211.44, the daily EMA50 at $203.89, and the 200-day trend line near $192.51.
When does NVIDIA report earnings?
NVIDIA is scheduled to report fiscal 2027 second-quarter earnings on August 26.
Is NVIDIA Corporation stock overbought?
On the daily timeframe, RSI14 at 56.93 is comfortably neutral. However, the hourly RSI14 has reached 70.46, firmly in overbought territory, signaling that the recent short-term leg has stretched fast.
Disclaimer: This article is for informational purposes only and does not constitute financial advice, an investment recommendation, or a solicitation to buy or sell any financial instrument or cryptocurrency. The analysis provided is not indicative of future results. Investing in crypto assets and financial markets carries a high risk of capital loss. Always do your own research (DYOR) and consult a qualified financial advisor before making any decision.
Article produced with the assistance of artificial intelligence and reviewed by the editorial team.
