




As of August 5, 2026, TAO sits precisely at its daily pivot near $196, leaving Bittensor crypto trapped between a short-term bullish pulse and a macro structure that remains firmly in correction territory.
Summary
Key takeaways
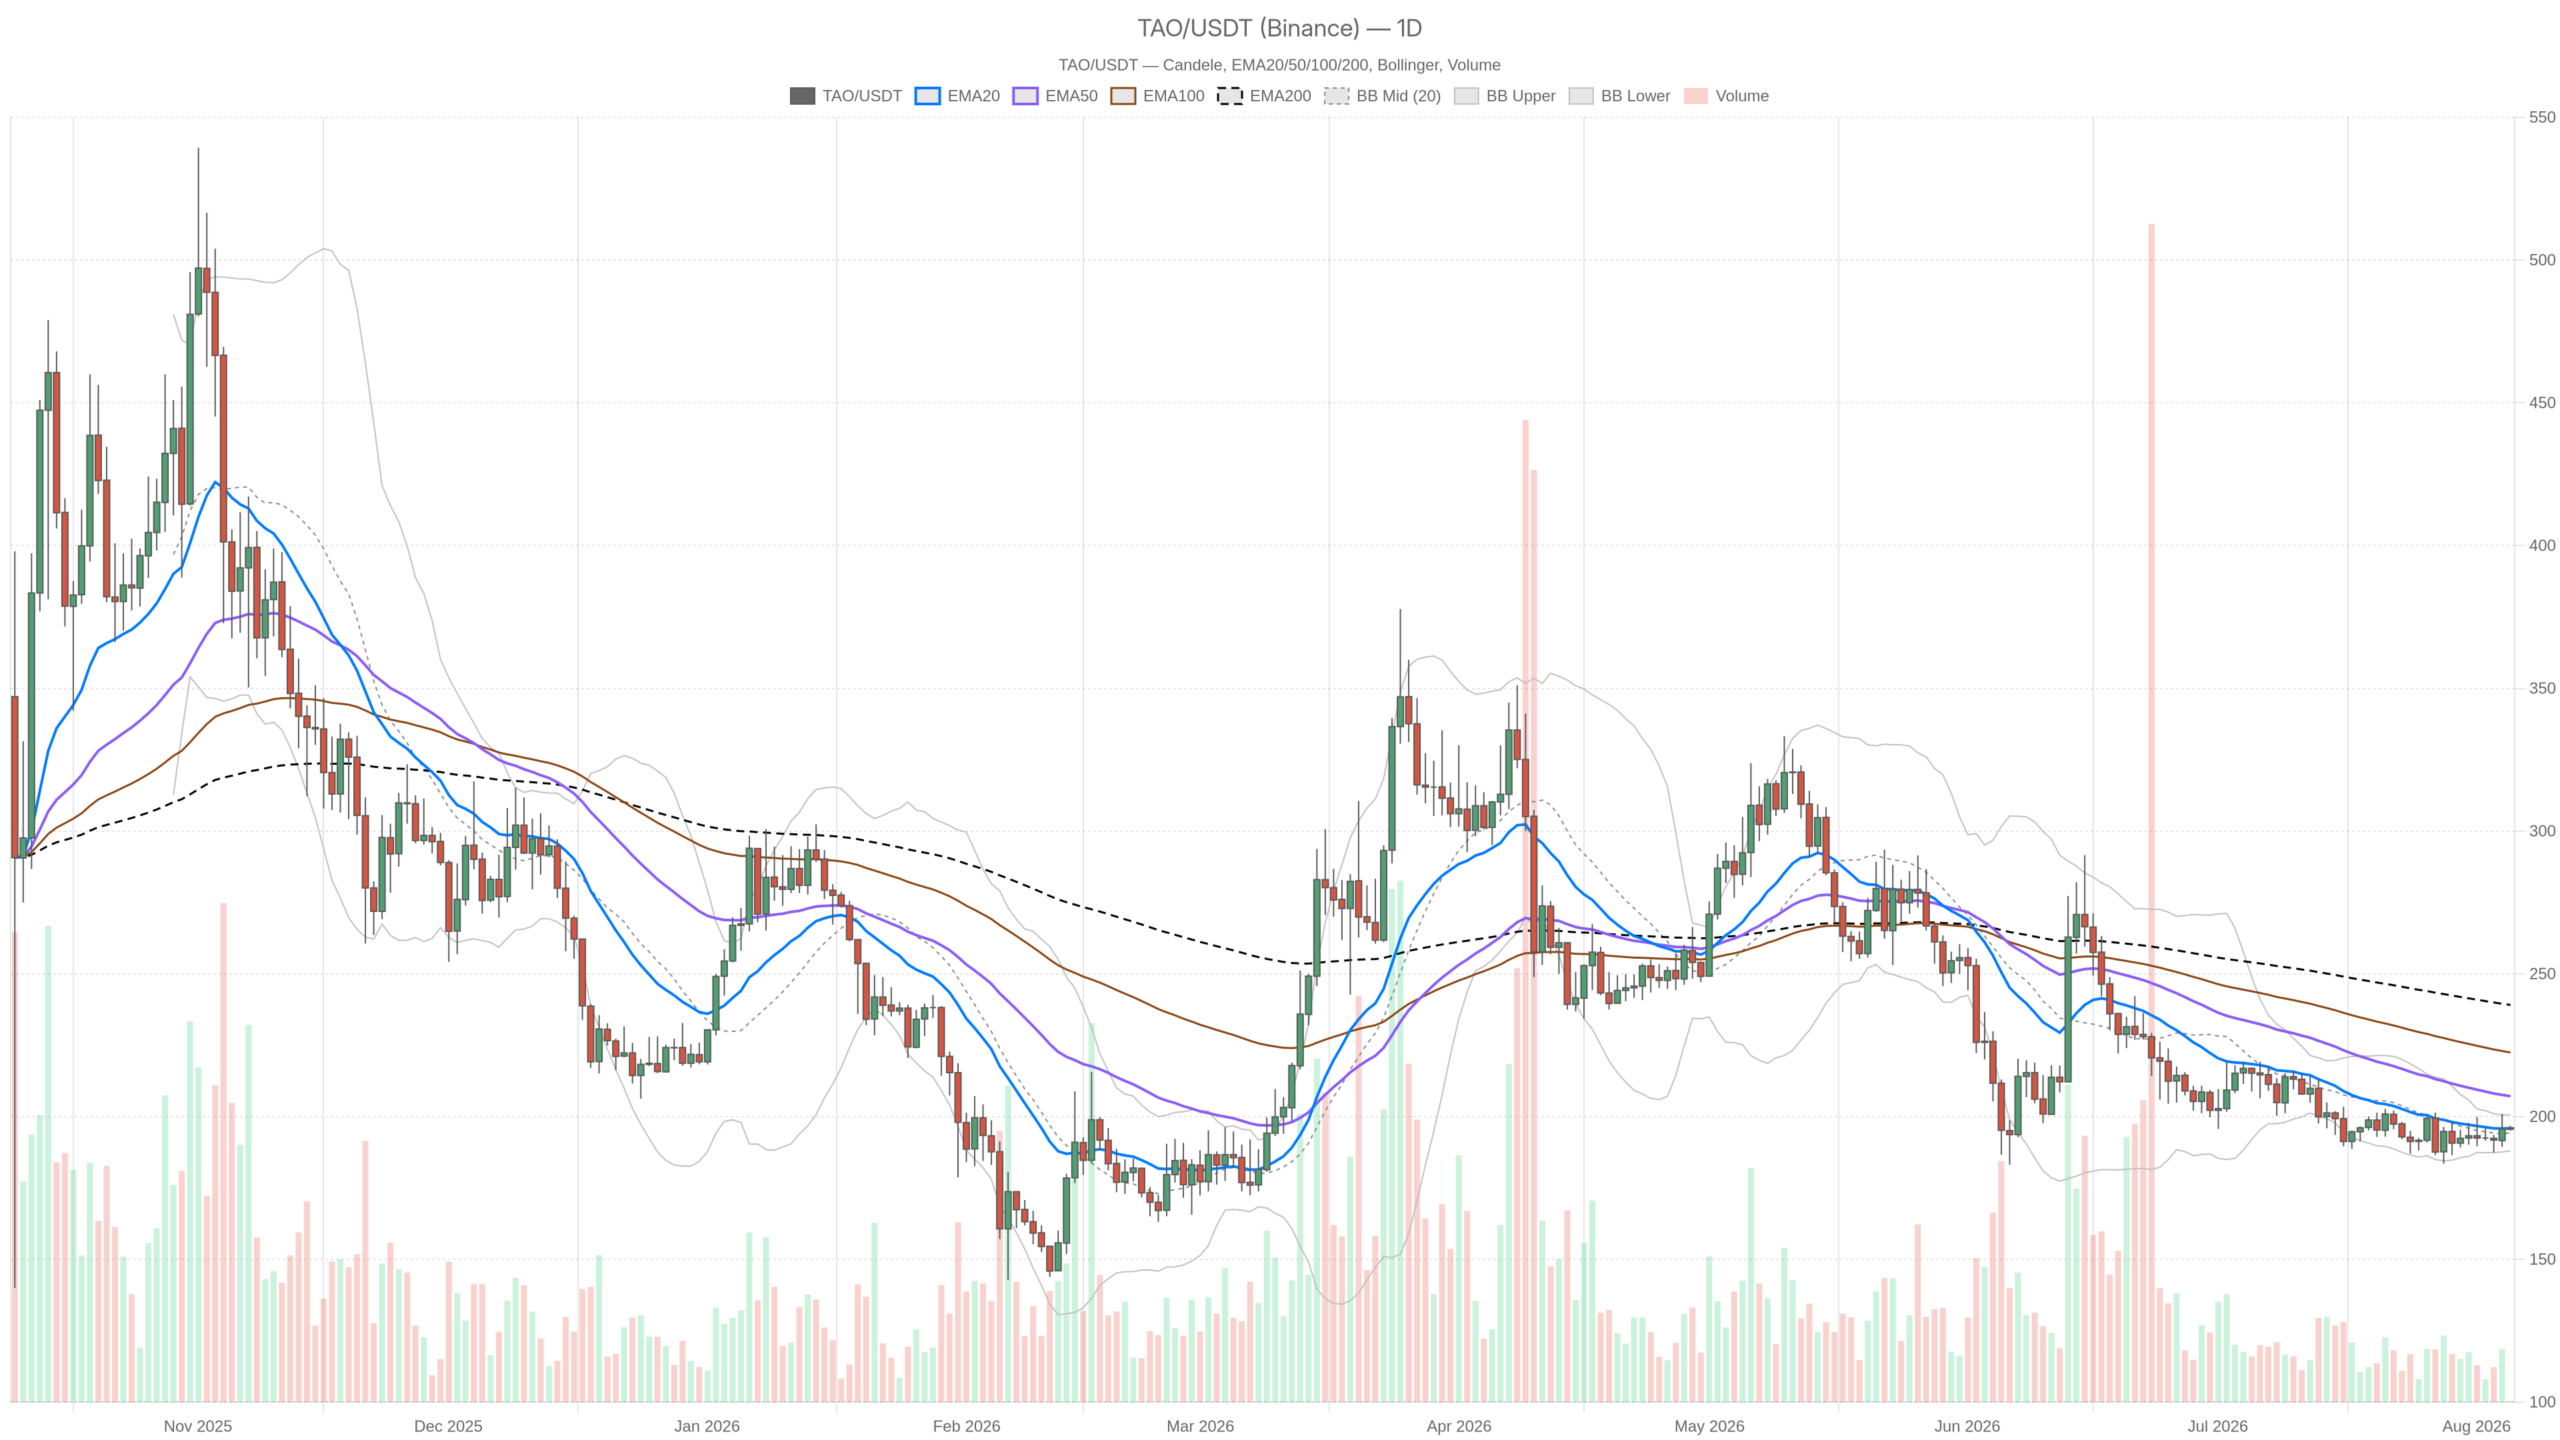
- TAO closed at $196.10, sitting on its 20-day EMA at $195.88, far below the 50-day EMA at $207.16 and the 200-day EMA at $239.10.
- Daily RSI at 47.71 signals neutrality; the MACD histogram has turned positive at 1.23 even though the MACD line remains below its signal.
- The hourly timeframe flipped bullish with price above all three key EMAs and hourly RSI near 60, creating a direct conflict with the cautious daily structure.
- Fear & Greed Index sits at 27 while Bitcoin dominance remains elevated at 56.55%, capping altcoin risk appetite across the board.
- The narrow $195.20–$196.90 pivot zone will likely determine the next directional move with the daily ATR of 8.23 implying rapid resolution.
Daily structure: fighting the downtrend
The daily RSI at 47.71 remains as neutral as it gets — no oversold bounce case, no overbought exhaustion case, just a market undecided about direction. The MACD tells a more nuanced story, however. The line at -3.60 remains below the signal at -4.83, which on its own suggests bearish continuation, but the histogram has turned positive at 1.23. That is a classic momentum-fading-into-a-downtrend setup: sellers still control this timeframe, but they are losing steam with every session that passes without a fresh leg lower.
Bollinger Bands on the daily reinforce the view that this is consolidation rather than a trending move. Price sits almost exactly on the mid-band at $194.30, comfortably inside the $187.94–$200.65 range. No squeeze, no expansion signal — just price drifting near equilibrium. Moreover, the daily ATR of 8.23 reminds traders that TAO can move roughly 4% in a single session, so whichever direction resolves this standoff is unlikely to be a slow grind.
In short, the pivot cluster maps the battle lines clearly: pivot at $196.00, resistance R1 at $196.90, support S1 at $195.20. TAO closing essentially on the pivot line, with barely 70 cents of room to either side, is exactly why this reads as a coiled setup rather than a clear trend.
Hourly momentum flips bullish — is it enough?
Zooming into the 1H chart, the picture changes meaningfully. Price at $196.30 trades above all three key EMAs — 20 at $194.45, 50 at $192.98, and 200 at $192.86 — which is enough for the system to flag this timeframe as outright bullish. Notably, RSI at 59.93 backs that up without being stretched; there is still room to run before this reaches overbought territory.
The hourly MACD is also constructive. The line at 1.52 sits above the signal at 1.28, with a small but positive histogram of 0.24. Momentum is genuinely building on this timeframe, not merely recovering from oversold conditions. That said, the hourly pivot levels are nearly identical to the daily ones — pivot at $196.07, R1 at $196.53, S1 at $195.83 — meaning the immediate resistance and support zone that matters across both timeframes is essentially the same narrow band. This convergence raises the stakes of whatever happens next around the $196–197 area.
15-minute execution context
On the 15-minute chart, price at $196.30 hugs its own 20 EMA at $196.23 and holds above the 50 and 200 EMAs, keeping the short-term regime technically bullish. However, the momentum signals here are cooling. RSI at 51.96 is unremarkable, and the MACD histogram has flipped slightly negative at -0.22, with the line at $0.11 now just under the signal at $0.32. This is the kind of micro-stall that typically appears before either a continuation push or a quick fade back toward the 15-minute Bollinger low near $194.83. It is not decisive on its own, but useful for timing entries rather than calling direction.
Where the tension actually lives
Here is the conflict worth being honest about. The daily timeframe, which defines the macro bias for Bittensor crypto, remains neutral-to-cautious, with price still trapped well under the 50- and 200-day EMAs. Meanwhile, the 1H timeframe has flipped bullish with real conviction in both RSI and MACD readings. The 15-minute chart is bullish in structure but losing momentum in real time. That is a textbook short-term bounce developing inside a larger, unresolved downtrend — not necessarily a reversal. Until the daily EMA50 at $207.16 gets challenged, every rally on the lower timeframes should be treated as a recovery attempt within a bigger correction, not confirmation that the trend has turned.
Bullish scenario
For bulls, the case builds if TAO clears the daily pivot at $196 and holds above R1 at $196.90 with follow-through volume. That would open the door toward the daily Bollinger upper band at $200.65, and eventually put the 50-day EMA at $207.16 back in play as the next real test. The hourly bullish regime — price above all three EMAs with RSI still under 60 — gives this scenario some short-term legitimacy. In that context, what would invalidate it is a rejection back below the 1H EMA20 at $194.45, or a daily close back under S1 at $195.20.
Bearish scenario
For bears, the setup is simpler. The daily MACD line remains below its signal, price remains far beneath the 200-day EMA at $239.10, and market-wide sentiment offers no tailwind. A daily close below S1 at $195.20 and through the 20-day EMA at $195.88 would open a path back toward the Bollinger lower band at $187.94, with the 8.23 ATR suggesting that move could happen quickly. Conversely, a daily RSI push convincingly above 50 combined with a MACD histogram continuing to expand positively would start to look less like a dead-cat bounce and more like genuine trend repair.
Positioning, risk, and the bigger picture
The macro backdrop is not doing the crypto market any favors at the moment. The Fear & Greed Index sits at 27, squarely in fear territory, and total crypto market cap is essentially flat near $2.27 trillion, according to CoinGecko data. With Bitcoin dominance still around 56.55%, risk appetite for altcoins broadly remains subdued. That context matters when assessing how far any TAO bounce can realistically extend before running into profit-taking.
For now, none of this resolves cleanly in either direction. The daily chart says “prove it” to the bulls, while the hourly chart says the near-term pressure has already shifted upward. Given the ATR-implied volatility on both timeframes, moves in either direction could happen fast once the $195.20–$196.90 zone breaks. Treat the current setup as a genuine technical coin-flip, with the broader market’s cautious mood acting as a mild headwind for any sustained upside — and size accordingly given how quickly the range could snap.
FAQ
What is the current price of TAO?
As of August 5, 2026, TAO closed at $196.10, sitting essentially on its daily pivot at $196.00 and the 20-day EMA at $195.88, far below both the 50-day and 200-day EMAs.
Is TAO in a bullish or bearish trend right now?
The daily timeframe remains neutral-to-cautious, with price below both the 50-day EMA at $207.16 and the 200-day EMA at $239.10. However, the 1H chart has flipped bullish, creating a conflicting signal that suggests a short-term bounce inside a larger downtrend rather than a confirmed reversal.
What are the key levels to watch for TAO?
The critical zone is $195.20 (S1 support) to $196.90 (R1 resistance). A break above R1 opens the path toward $200.65 and eventually the 50-day EMA at $207.16. A daily close below S1 exposes the Bollinger lower band at $187.94, with the daily ATR of 8.23 suggesting the move could unfold rapidly.
How does the macro environment affect TAO’s outlook?
The Fear & Greed Index at 27 and Bitcoin dominance at 56.55% indicate subdued risk appetite for altcoins. With total crypto market cap hovering around $2.27 trillion and showing little movement, capital rotation into assets like TAO remains limited, acting as a headwind for any sustained bounce.
Disclaimer: This article is for informational purposes only and does not constitute financial advice, an investment recommendation, or a solicitation to buy or sell any financial instrument or cryptocurrency. The analysis provided is not indicative of future results. Investing in crypto assets and financial markets carries a high risk of capital loss. Always do your own research (DYOR) and consult a qualified financial advisor before making any decision.
Article produced with the assistance of artificial intelligence and reviewed by the editorial team.
