



Eli Lilly and Company stock presents a sharp contrast: a strong Q2 earnings beat and raised 2026 guidance on one side, and a daily chart showing the stock giving back most gains on the other. Understanding why these two pictures disagree is key to reading LLY right now.
Summary
Key takeaways
- Eli Lilly reported better-than-expected Q2 2026 results, driven by injectable GLP-1 products and the oral pill Foundayo.
- Management raised full-year sales guidance, with the company now treating nearly 10% of the US obesity population with GLP-1 therapies.
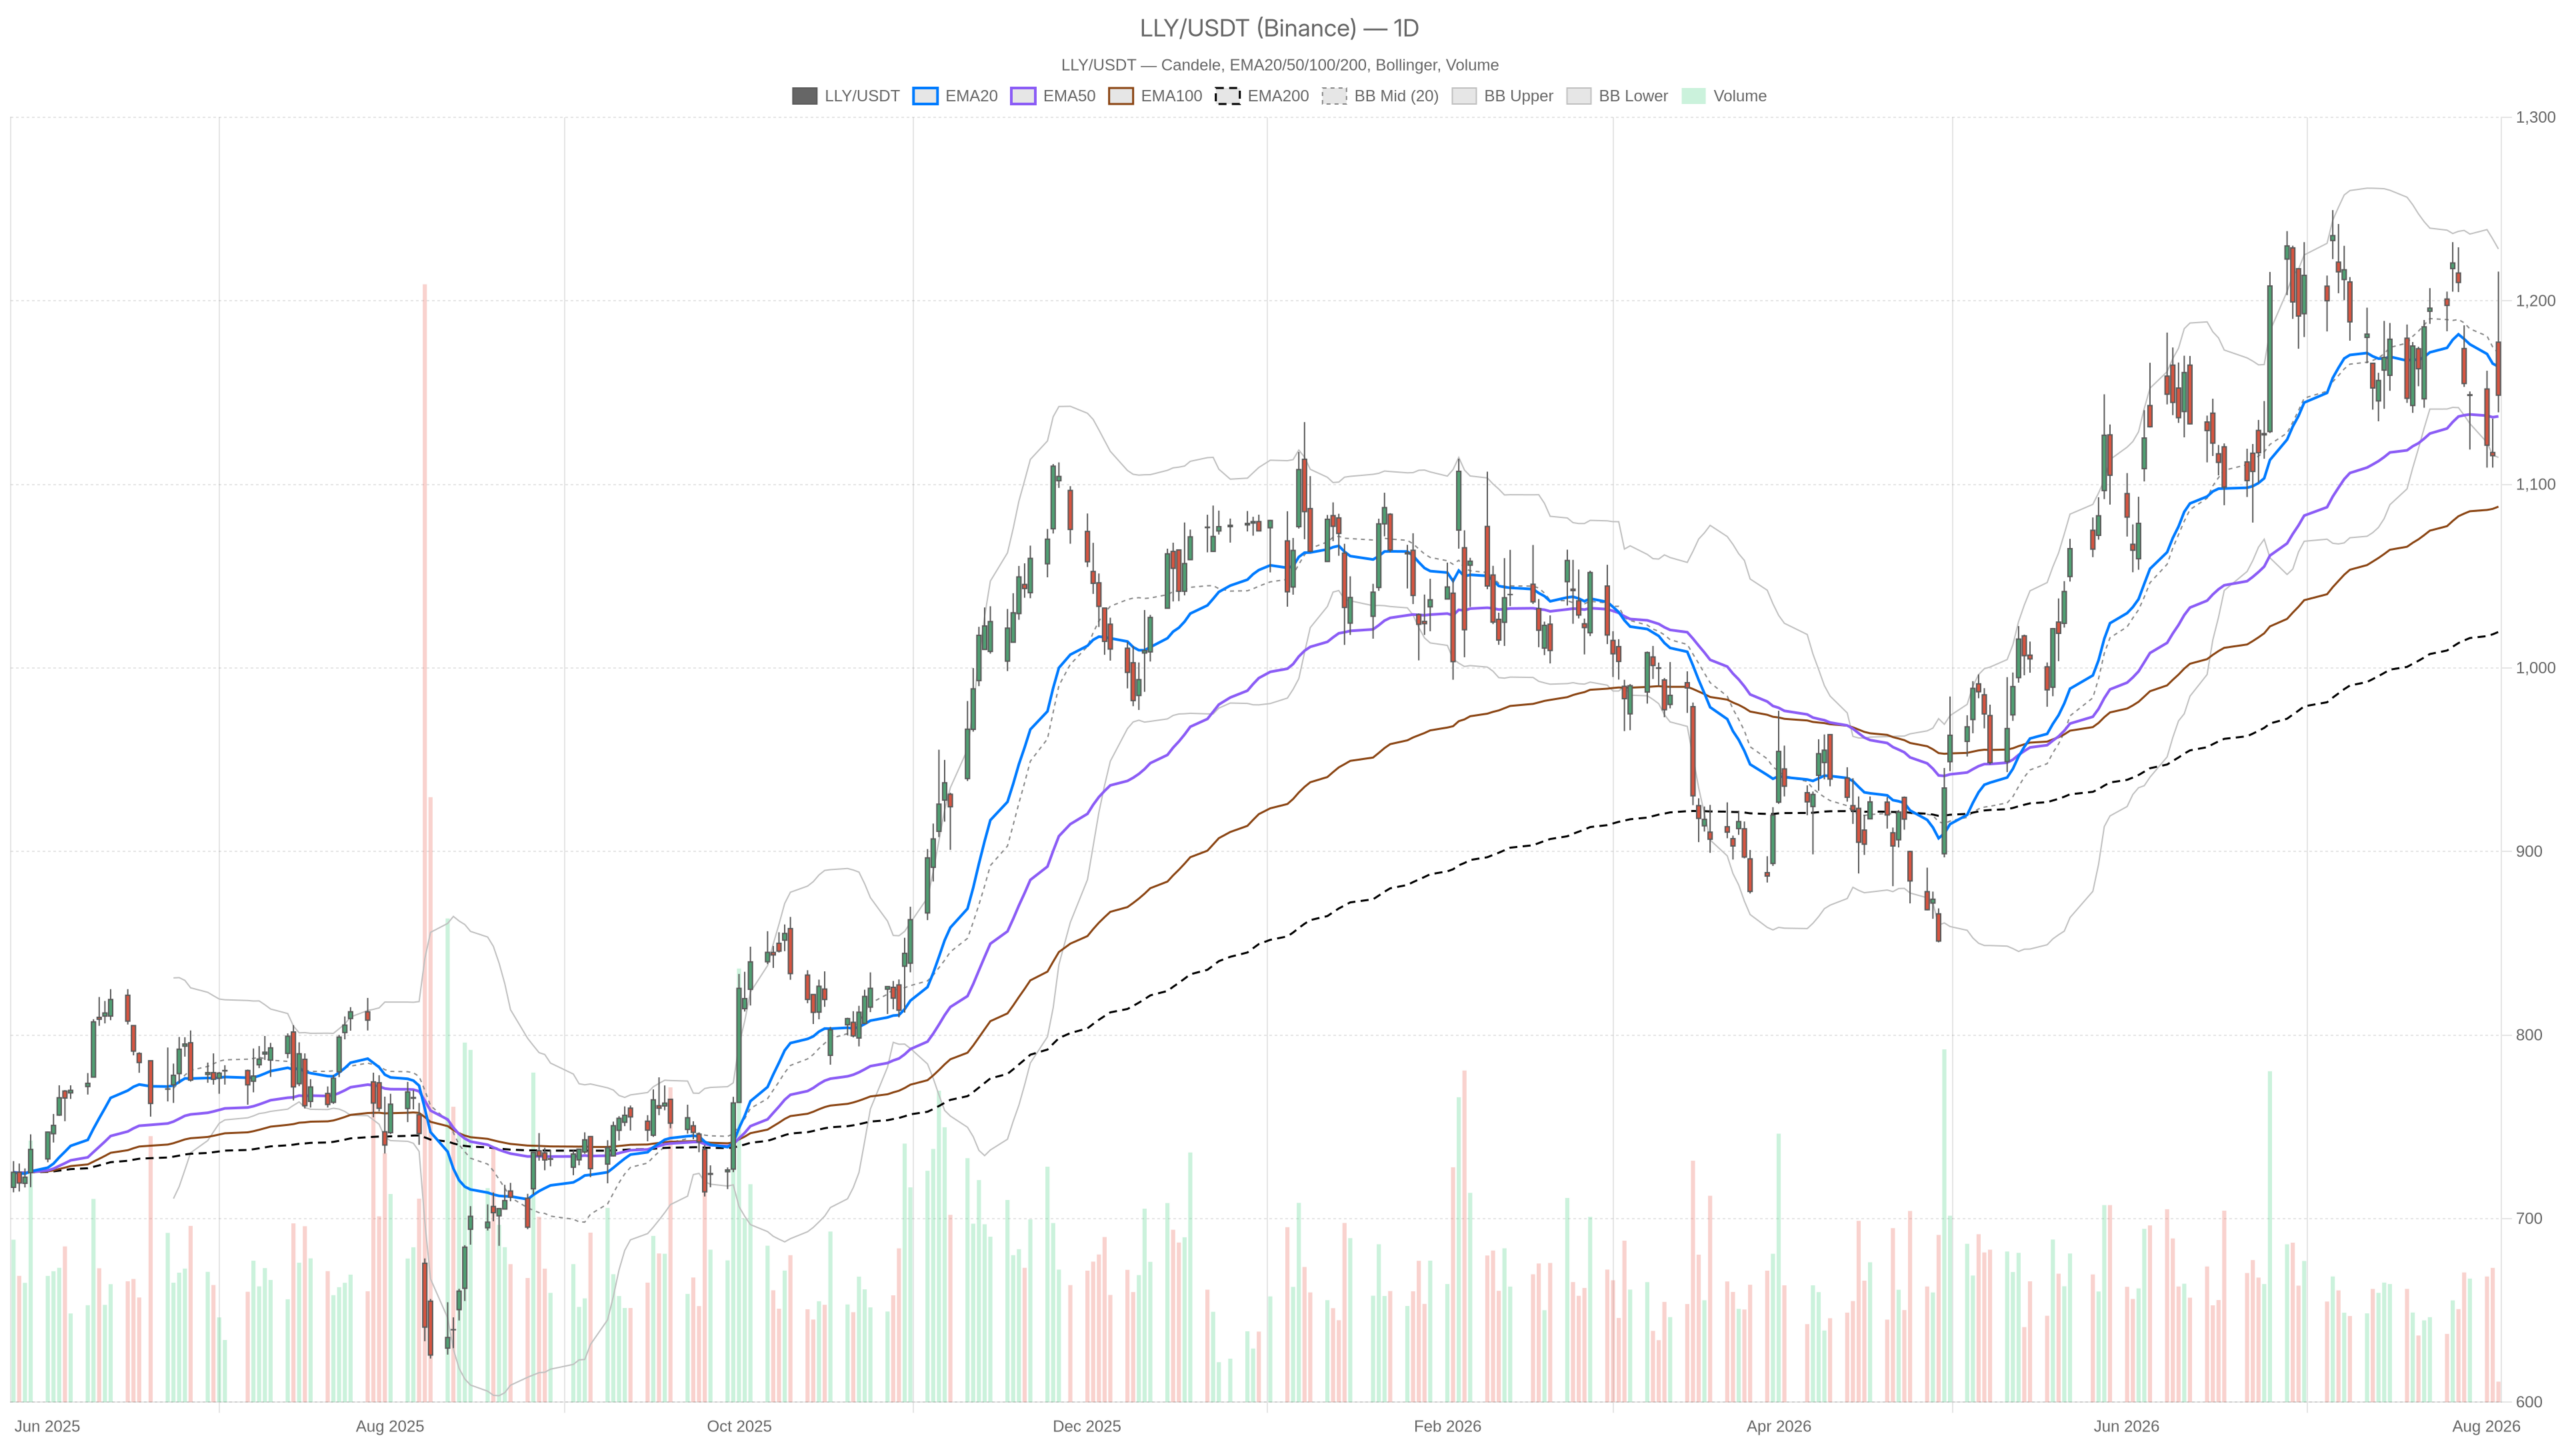
- LLY opened at 1177.50, spiked to 1215.94, then reversed to close at 1148.61, forming a classic rejection candle on the daily chart.
- The daily MACD shows a bearish crossover at -2.07 against a signal of 7.37, while RSI14 sits at a neutral 47.47.
- Price must reclaim the daily pivot at 1167.95 and EMA20 at 1164.18 to revive the bullish case.
Eli Lilly and Company Stock: Daily Structure Shows a Rejection, Not a Breakout
The daily chart shows a classic rejection, not a breakout. LLY opened at 1177.50, spiked to an intraday high of 1215.94, then reversed sharply to close at 1148.61, near the session low of 1139.29.
The fundamental backdrop, however, is unambiguously positive. Eli Lilly reported better-than-expected Q2 2026 results, driven by injectable GLP-1 products and its oral weight-loss pill, Foundayo. Management raised full-year sales guidance. CFO Lucas Montarce noted the company now treats nearly 10% of the US obesity population with GLP-1 therapies. That expansion narrative explains the initial pop in Eli Lilly and Company stock.
Nevertheless, price action after the open tells a different story. Sellers stepped in above 1200, and buyers were unable to defend the highs. This is a warning sign even in the context of good news. The stock erased its earnings-driven gap by the close.
EMA and Momentum Structure
The daily EMA structure reflects that hesitation. Price trades below the EMA20 at 1164.18 but still above the EMA50 at 1137.09. Meanwhile, it remains well above the EMA200 at 1019.63. The short-term trend has cooled. The medium-term structure is still intact. The long-term uptrend remains firmly in place.
At the same time, RSI14 at 47.47 sits almost exactly at the neutral midpoint, offering no directional conviction either way. MACD confirms the loss of short-term momentum. The MACD line sits at -2.07 against a signal line of 7.37, producing a negative histogram. That is a bearish crossover, lining up with the failed breakout attempt on the daily candle.
Volatility and Pivot Framework
Bollinger Bands show price at 1148.61 against a mid-band of 1171.49, an upper band of 1228.28, and a lower band of 1114.69. Price sits below the mid-band but is not stretched toward either extreme. This leaves room to move in both directions. Volatility, measured by ATR14 at 40.15, is elevated, typical for a post-earnings session with this kind of intraday range.
On the pivot framework, price trades below the daily pivot of 1167.95, with resistance at R1 1196.61 and support at S1 1119.95. Trading below pivot after such a wide range day suggests sellers controlled the balance of the session. The broader trend, however, has not been broken. The system’s regime reading for the daily timeframe remains neutral, fitting a stock digesting a big move rather than confirming a new direction.
1H and 15m: Signs of Stabilization, But Resistance Is Close
The shorter timeframes show buyers attempting to stabilize price, but resistance sits directly overhead. The 1H chart places Eli Lilly and Company stock at 1148.61, right at the H1 pivot of 1147.71, sandwiched between S1 at 1143.77 and R1 at 1152.55.
Hourly Recovery Meets Resistance
That is a tight, undecided range. Notably, the H1 EMA20 sits below price at 1134.74, suggesting short-term intraday buyers have stepped back in after the daily reversal. However, the H1 EMA50 at 1152.16 and EMA200 at 1165.01 sit just above current price, stacking resistance directly overhead.
RSI14 at 54.64 shows modest bullish momentum building. The MACD histogram has turned positive at 5.90, even though the MACD line itself remains negative at -6.18 versus a signal of -12.08. That combination points to an early-stage recovery attempt rather than a confirmed reversal. The Bollinger picture reinforces this.
Price sits near the upper band of 1156.06, against a mid-band of 1127.28. This suggests the bounce is already testing short-term resistance. Therefore, the conflict between timeframes is clear. The daily chart shows momentum fading after a rejection from the highs. The 1H chart shows buyers attempting to stabilize price right into a wall of overhead resistance.
15-Minute Execution Context
On the 15-minute chart, used here strictly for execution context, price is essentially glued to its pivot at 1148.17, closing at 1148.61. The EMA20 at 1142.49 and EMA50 at 1135.65 sit below price, keeping the short-term structure tilted upward. The EMA200 at 1154.12, however, sits just above as immediate resistance.
Here, RSI14 at 55.05 is neutral-to-firm. The MACD histogram has flattened to -0.19 after being positive, signaling stalling momentum right at current levels. In short, the 15m tape shows indecision. It is consistent with a market waiting for the next directional trigger rather than committing.
Bullish and Bearish Scenarios for Eli Lilly and Company Stock
LLY’s next direction depends on whether buyers can reclaim the daily pivot at 1167.95 or sellers break below the EMA50 at 1137.09. These two levels define the near-term battleground for Eli Lilly and Company stock.
Bullish Scenario
The bullish case rests on reclaiming the daily pivot at 1167.95 and the EMA20 at 1164.18. A move back above those levels would signal that buyers have absorbed the post-earnings selling pressure and regained control. In that scenario, the daily R1 at 1196.61 becomes the next logical target, with the intraday high of 1215.94 as a stretch objective.
This scenario would be reinforced by the underlying fundamental story: continued GLP-1 demand, raised 2026 guidance, and traction in the oral pill Foundayo. Management’s comments on the scale of the US obesity opportunity still being addressed add further weight to the bullish argument.
Bearish Scenario
In contrast, the bearish scenario would be confirmed by a break below the daily EMA50 at 1137.09 and the S1 level at 1119.95, approaching the lower Bollinger Band at 1114.69. Such a move would validate the bearish MACD crossover already visible on the daily chart. It would suggest that the earnings-day reversal was more than just short-term profit-taking.
Even in that case, the long-term trend defined by the EMA200 at 1019.63 would remain technically intact. The near-term setup, however, would clearly favor further downside before any renewed attempt higher.
Current Positioning Outlook
Overall, LLY sits at an interesting crossroads. The fundamental backdrop, built on a genuine Q2 beat and raised guidance, argues for optimism. In contrast, the technical picture, dominated by a sharp daily rejection candle and a bearish MACD crossover, argues for caution until price reclaims key levels.
Given the elevated ATR readings across both the daily and hourly timeframes, volatility around Eli Lilly and Company stock is likely to stay high. Positioning here should account for that uncertainty. Until price decisively clears either the daily pivot to the upside or the S1 level to the downside, LLY is best viewed as being in a transitional phase. The next directional move will likely set the tone for the sessions ahead.
FAQ
Why did Eli Lilly and Company stock reverse after beating earnings?
Despite strong Q2 2026 results and raised sales guidance, sellers stepped in aggressively above the 1200 level. The stock opened at 1177.50, spiked to 1215.94, then reversed to close at 1148.61. This suggests the market had already priced in much of the positive news, and profit-taking dominated once the initial pop faded.
What are the key levels to watch for Eli Lilly and Company stock?
On the upside, LLY must reclaim the daily pivot at 1167.95 and the EMA20 at 1164.18 to revive the bullish case, with R1 at 1196.61 as the next target. On the downside, a break below the EMA50 at 1137.09 and S1 at 1119.95 would confirm the bearish scenario, with the lower Bollinger Band at 1114.69 as the next support.
Is the long-term uptrend in Eli Lilly and Company stock still intact?
Yes. Despite the sharp daily reversal, LLY remains well above the EMA200 at 1019.63. The long-term uptrend is not threatened by the current pullback. However, the near-term technical picture has weakened, with a bearish MACD crossover and price trading below the daily EMA20.
What role did the GLP-1 franchise play in Eli Lilly’s earnings?
The GLP-1 franchise was central to the Q2 2026 beat. Injectable GLP-1 products and the oral pill Foundayo drove the better-than-expected results. CFO Lucas Montarce highlighted that the company now treats nearly 10% of the US obesity population with GLP-1 therapies, underlining the expansion narrative.
Disclaimer: This article is for informational purposes only and does not constitute financial advice, an investment recommendation, or a solicitation to buy or sell any financial instrument or cryptocurrency. The analysis provided is not indicative of future results. Investing in crypto assets and financial markets carries a high risk of capital loss. Always do your own research (DYOR) and consult a qualified financial advisor before making any decision.
Article produced with the assistance of artificial intelligence and reviewed by the editorial team.
