




Alphabet Inc. stock faces one of its most turbulent sessions after an earnings-driven shock and a DeepMind leadership shake-up injected uncertainty. The daily structure still leans bullish, but the latest candle tells a more complicated story.
Summary
Key takeaways
- Alphabet Inc. stock dropped double digits after reporting negative free cash flow in the second quarter.
- The daily EMA structure remains intact, with price above the EMA20, EMA50, and EMA200.
- Hourly MACD has turned bearish, signaling short-term momentum has rolled over.
- Price sits below the daily pivot point at 368.04, hinting at near-term distribution.
- ATR14 jumped to 14.19, confirming volatility has expanded sharply alongside the news flow.
Daily Chart: Alphabet Inc. Stock Structure Still Bullish, But Cracks Are Showing
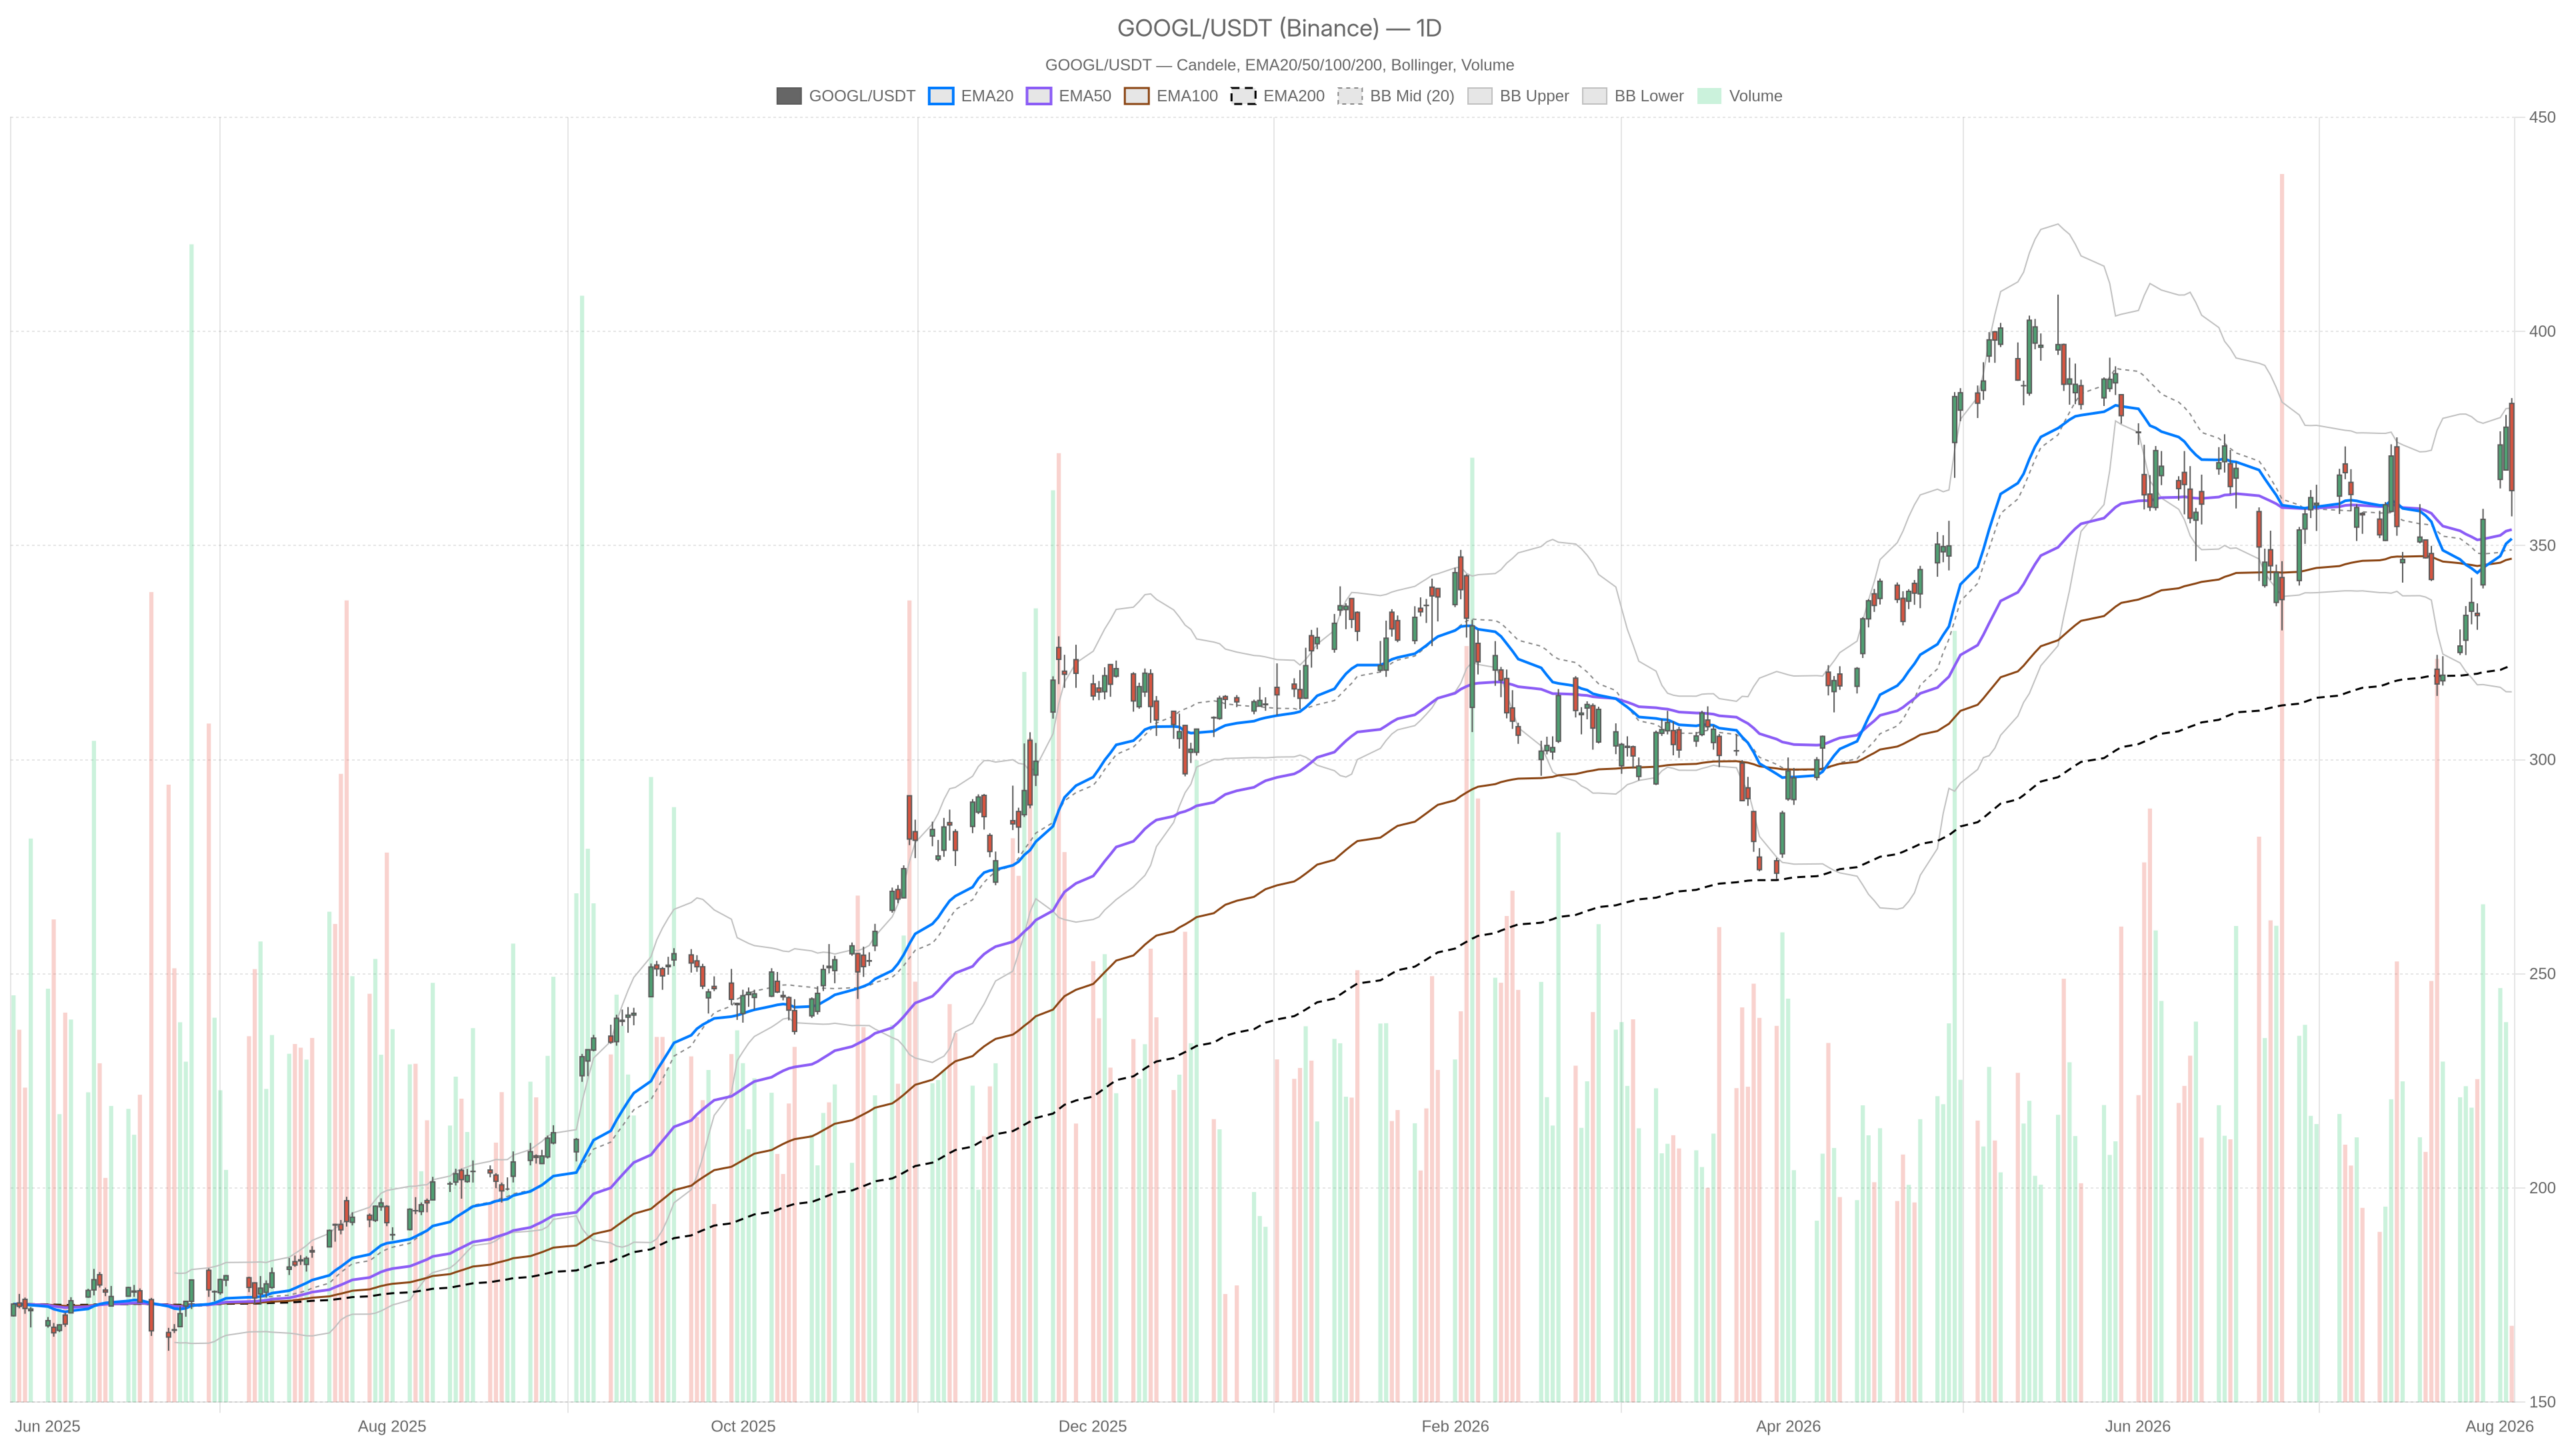
The daily uptrend for Alphabet Inc. stock remains technically intact, but the size and shape of the latest candle suggest the bullish structure is under genuine stress.
The daily candle itself is the headline. Price opened at 383.19, spiked to a high of 384.44, then collapsed to a low of 356.83 before closing at 362.84. That is a wide, bearish-shaped range, and the close sitting well off the highs is not a constructive signal on its own.
Even so, the broader moving average structure has not broken down. Price remains above the EMA20 at 351.61, the EMA50 at 353.75, and the EMA200 at 321.95. That alignment still describes a longer-term uptrend that has not yet been technically invalidated, despite the shock of the session.
Momentum and Volatility: Mixed Signals Emerge
RSI14 sits at 54.77, which is neutral territory rather than overbought or oversold. At the same time, MACD shows a line of 0.62 against a signal of -3.72, with a positive histogram of 4.34. That histogram suggests underlying momentum has not fully turned negative. Still, it likely reflects strength built before the recent drop rather than fresh buying pressure.
Meanwhile, Bollinger Bands show the mid-line at 348.98, with the upper band at 382.11 and the lower band at 315.86. Price is trading in the upper half of that range, which keeps the broader picture from looking outright bearish. However, ATR14 has jumped to 14.19, confirming that volatility has expanded sharply alongside the news flow.
Notably, the daily pivot level adds another layer of nuance. With the pivot point at 368.04, Alphabet is trading below its own pivot. Price sits between that level and support at 351.63. In contrast to the still-bullish EMA structure, this pivot positioning points to near-term weakness that the moving averages alone do not capture.
H1 Timeframe: Momentum Weakens the Bullish Case
The hourly chart weakens the bullish case for Alphabet Inc. stock, with momentum indicators confirming a clear bearish turn.
Price at 362.84 is now below the EMA20 at 368.57, though it remains above the EMA50 at 357.66 and the EMA200 at 352.11. That mixed EMA alignment reflects a market caught between short-term selling and a still-intact medium-term trend.
RSI14 on the 1H has slipped to 46.26, just under the neutral 50 mark. At the same time, MACD has turned bearish, with the line at 4.87 crossing below the signal at 7.87, producing a negative histogram of -3. This is a clear sign that hourly momentum has rolled over.
Similarly, Bollinger Bands on the 1H show price near the lower band. The mid-line sits at 373.11, the upper band at 386.18, and the lower band at 360.04. Price closing just above that lower band reinforces the idea of active downside pressure at the intraday level. The hourly pivot point sits at 362.88, essentially right where price is trading, with resistance at 364.93 and support at 360.80—a genuinely indecisive setup.
15-Minute Chart: Execution Context
The 15-minute chart shows sellers remain firmly in control, with Alphabet Inc. stock compressed below key short-term EMAs.
On the 15-minute timeframe, the bearish tilt is more pronounced. Price at 362.84 sits below both the EMA20 at 368.67 and the EMA50 at 371.04, though it remains above the EMA200 at 356.67. RSI14 has dropped to 35.08, approaching oversold territory and signaling that short-term sellers remain in control for now.
MACD confirms the same message, with the line at -4.16 below the signal at -3.23 and a negative histogram of -0.93. The 15-minute pivot point at 363.15, alongside resistance at 363.71 and support at 362.28, shows price compressed in a tight range just under the pivot. This is a market pausing rather than reversing, at least for the moment.
Bullish Scenario: What Would Revive Alphabet Inc. Stock
For Alphabet Inc. stock to regain bullish traction, price must reclaim the daily pivot at 368.04 and hold above it.
A recovery back above the H1 EMA20 at 368.57, paired with RSI moving back above 50 on both the daily and hourly charts, would help confirm that the selloff was a shock rather than a trend change. Notably, fundamental narratives remain supportive. Motley Fool coverage points to Alphabet targeting the $300 billion AI chip market currently dominated by Nvidia. Separately, it frames Alphabet, alongside Amazon, as a way to gain exposure to the Anthropic ecosystem ahead of its IPO. Should sentiment stabilize around these themes, buyers could look to defend the EMA20/EMA50 daily zone near 351–354 as a base for a renewed push higher.
Bearish Scenario: What Would Confirm a Trend Breakdown
A break below daily support at 351.63 would invalidate the longer-term bullish structure for Alphabet Inc. stock.
On the other hand, a decisive move under the EMA20 and EMA50 on the daily chart, combined with a break below support at 351.63, would align the daily picture with the already-bearish tone on the 1H and 15m charts. Continued downside through the H1 lower Bollinger Band at 360.04 and the 15m lower band at 354.07 would extend the current move rather than mark a pause. This scenario would likely be reinforced by lingering concerns tied to the negative free cash flow reported in Q2. Uncertainty stemming from the DeepMind leadership transition, involving Demis Hassabis and Jeff Dean’s departure, would add further pressure.
Closing Take
Alphabet Inc. stock is caught in a genuine conflict between timeframes, with the daily uptrend intact but short-term momentum firmly bearish.
Overall, the daily chart still reflects a technically intact uptrend, yet the shape of the latest candle and the pivot positioning hint at near-term distribution. Meanwhile, both the 1H and 15m charts confirm that short-term momentum has clearly turned bearish following the earnings shock and leadership news. Volatility, as measured by ATR14 on the daily, has expanded meaningfully, and that alone argues for caution around position sizing. Therefore, until price reclaims the daily pivot and hourly momentum stabilizes, the path of least resistance appears tilted to the downside. The broader trend structure, however, has not yet been fully broken.
FAQ
Why did Alphabet Inc. stock drop sharply?
Alphabet Inc. stock dropped double digits after the company reported negative free cash flow in its second quarter, according to reporting from fool.com. At the same time, Google DeepMind underwent a leadership transition, with CEO Demis Hassabis moving into a chair role and chief scientist Jeff Dean exiting, which added to the uncertainty.
Is the daily uptrend in Alphabet Inc. stock still valid?
Yes, the daily uptrend remains technically intact. Price is still above the EMA20 at 351.61, the EMA50 at 353.75, and the EMA200 at 321.95. However, the bearish shape of the latest daily candle and the fact that price closed below the daily pivot at 368.04 suggest the structure is under stress.
What are the key levels to watch for Alphabet Inc. stock?
On the upside, the daily pivot at 368.04 and the H1 EMA20 at 368.57 are the immediate resistance levels to reclaim. On the downside, daily support sits at 351.63, which aligns closely with the EMA20 at 351.61 and the EMA50 at 353.75. The H1 lower Bollinger Band at 360.04 and the 15m lower band at 354.07 serve as nearer-term support references.
What would confirm a bearish reversal in Alphabet Inc. stock?
A decisive break below daily support at 351.63, combined with a move under both the EMA20 and EMA50 on the daily chart, would invalidate the longer-term bullish structure. This would align the daily timeframe with the already-bearish momentum visible on the 1H and 15-minute charts.
Disclaimer: This article is for informational purposes only and does not constitute financial advice, an investment recommendation, or a solicitation to buy or sell any financial instrument or cryptocurrency. The analysis provided is not indicative of future results. Investing in crypto assets and financial markets carries a high risk of capital loss. Always do your own research (DYOR) and consult a qualified financial advisor before making any decision.
Article produced with the assistance of artificial intelligence and reviewed by the editorial team.
