




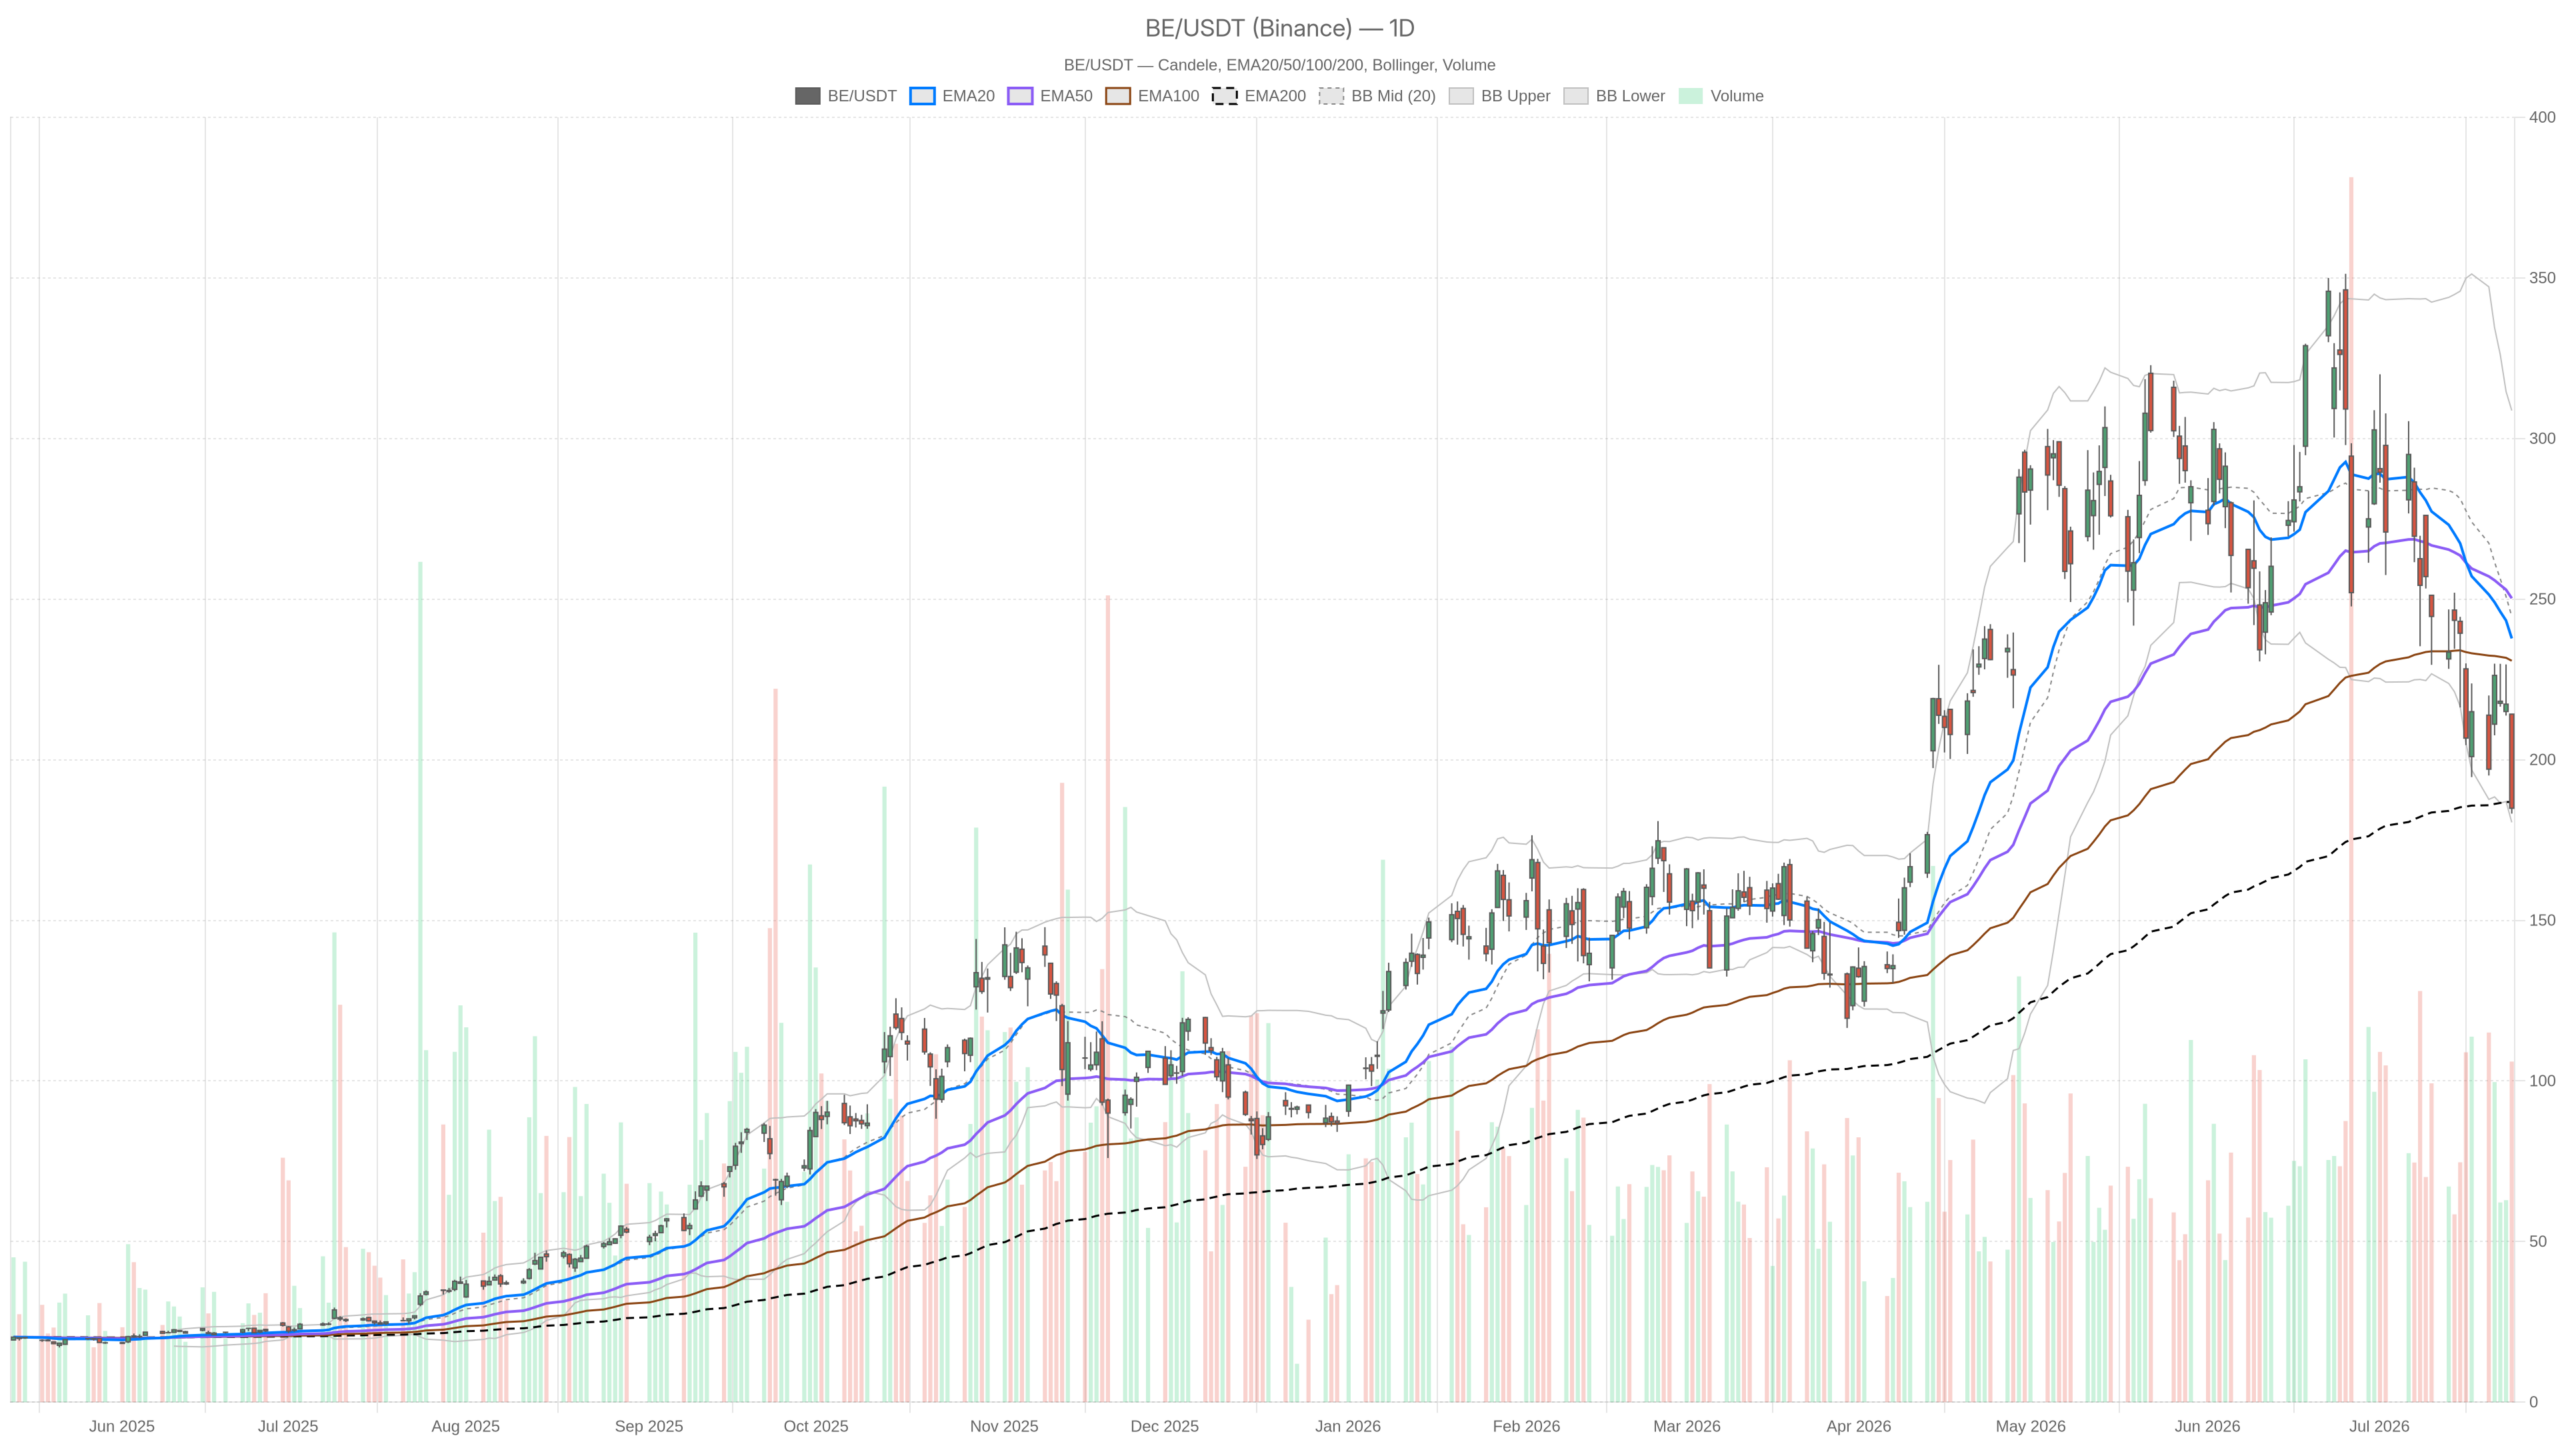
Bloom Energy stock sits at a critical inflection point. After shedding roughly 43% in a single month, BE closed at $184.89 on July 24. That places it just above the daily Bollinger lower bound. With Q2 earnings due July 28, genuine two-way risk dominates the setup.
Summary
Key takeaways
- BE has dropped roughly 43% in one month, closing at $184.89 on July 24.
- The daily EMA200 at $186.84 is the last structural support buffer on the daily chart.
- Daily RSI at 36.11 approaches oversold territory; 1H RSI at 27.53 signals deeply oversold conditions.
- Q2 earnings on July 28 create a binary catalyst, with a daily ATR of $26.32 signaling elevated volatility.
- A daily close below $186.84 would remove the last support floor, exposing S1 at $174.01.
Daily Timeframe — The Trend Is Still Down
The daily bias on Bloom Energy stock is unambiguously weak. Price trades below the EMA20 at $237.78 and the EMA50 at $250.27. Both moving averages now act as distant overhead resistance. The only meaningful dynamic support comes from the EMA200 at $186.84. That level sits barely above Friday’s close. A daily close below it would remove the last structural buffer on this timeframe.
Momentum Confirms Accelerating Weakness
The MACD reinforces the bearish trend across the daily chart. Its line sits at -20.24, well below the signal line at -14.93. The histogram reads -5.30. Momentum is not just negative — it is accelerating. No divergence or exhaustion signal has appeared at this stage.
However, the RSI at 36.11 does suggest the stock is approaching oversold territory. It has not yet triggered a formal reversal signal. Meanwhile, the daily ATR of $26.32 underscores the extreme volatility in this name. Single-day swings of that magnitude are routine. Risk sizing becomes exceptionally important in this environment.
The daily Bollinger Bands further contextualize the damage. The midline sits at $244.62 and the lower band at $180.51. BE closed near the floor of its statistical range. Closes at or through the lower band typically signal exhaustion. Yet such closes can persist during prolonged breakdowns. Notably, the pivot point sits at $194.10 with R1 at $204.98. The next identifiable floor below the EMA200 is S1 at $174.01.
Hourly Confirmation — Bearish Regime Intact
The 1H chart reinforces the bearish regime on Bloom Energy stock. At $185.08, price sits far beneath three key moving averages. The EMA20 stands at $207.69, the EMA50 at $217.35, and the EMA200 at $250.84. All three are stacked in declining order above price — a textbook bear alignment.
Oversold Without a Reversal Signal
The 1H RSI is particularly striking at 27.53. That is a deeply oversold reading. On a shorter timeframe, such levels often precede at least a technical bounce. However, the 1H MACD remains firmly negative. Its line at -8.08 against a signal at -4.16 confirms that selling pressure has not released. The histogram at -3.92 is still widening. This cautions against reading the low RSI as an immediate reversal trigger.
Meanwhile, on the 1H Bollinger Bands, price is pinned against the lower band at $184.95. The hourly pivot structure is tight. PP sits at $185.36, R1 at $187.49, and S1 at $182.94. Any intraday recovery attempt will likely face supply quickly at $187.49. A failure to reclaim even this narrow resistance would signal continued weakness.
15-Minute Context — Extreme Compression
The 15-minute RSI on Bloom Energy stock registered an extraordinary 18.85. This near-extreme oversold reading typically signals imminent technical relief or the tail-end of selling capitulation. The MACD histogram at -0.61 has compressed sharply from earlier levels. Immediate selloff momentum may be fading at the micro level.
In contrast, the 15m moving averages remain fully bearish. The EMA20 at $194.62, EMA50 at $204.58, and EMA200 at $218.17 all sit well above price. The ATR at $2.68 reflects the tight intraday range. This is consistent with a stock holding pattern ahead of a binary event.
The Bullish Case for Bloom Energy Stock
On the fundamental side, a credible counter-narrative exists to the technical damage. Q1 revenue reportedly grew 130% year-over-year. The company carries a reported $20 billion backlog. AI-driven energy demand and a major Oracle fuel-cell deal have been cited as structural tailwinds. Contracted backlog and cash position have reportedly continued climbing even as the stock collapsed.
What a Positive Earnings Surprise Could Trigger
Therefore, if Q2 earnings on July 28 meet or exceed Wall Street estimates, the stock could stage a sharp technical recovery. Revenue growth, margin expansion, and backlog confirmation would be the key metrics to watch. Daily RSI sits near oversold and price is compressed against the Bollinger lower band. Any positive surprise would enter an environment primed for a short-covering rally.
The daily EMA200 at $186.84 and the hourly R1 at $187.49 would be the first levels to reclaim. Above those, the pivot point at $194.10 becomes the next meaningful target.
The Bearish Scenario — When Support Fails
If Q2 earnings disappoint, the technical floor under Bloom Energy stock could break quickly. A daily close below the EMA200 at $186.84 would mark significant deterioration. From there, daily S1 at $174.01 becomes the next logical reference. The bearish MACD structure on the daily chart would re-accelerate. Oversold RSI would simply reflect a stock in freefall rather than one coiling for recovery.
Overall, the 43% one-month decline is not noise. It reflects serious selling conviction from investors who were long at much higher prices. That overhead supply does not disappear overnight. Even in an optimistic earnings scenario, any recovery would likely face significant distribution pressure. Trapped holders will look to reduce exposure at the first opportunity.
Positioning Into a High-Volatility Event
Bloom Energy stock presents a genuine tactical dilemma. The technical trend is bearish across all timeframes. Yet the depth of the selloff and extreme oversold readings create conditions where risk is truly binary. The earnings catalyst on July 28 only amplifies this tension. The daily ATR of $26.32 signals that post-earnings moves of significant magnitude are entirely within the normal range for this stock.
Positioning here requires accepting that uncertainty is the dominant variable. Daily charts say stay cautious. RSI compression suggests a snap-back is possible. The earnings date indicates the market will resolve this tension within days. Waiting for confirmation after the July 28 report is the disciplined approach. In a setup this asymmetric, patience outweighs anticipation.
FAQ
What is the key support level for Bloom Energy stock?
The daily EMA200 at $186.84 is the last structural support on the daily timeframe. A close below this level would expose the next floor at S1 $174.01.
When are Bloom Energy’s Q2 earnings?
Bloom Energy reports Q2 earnings on July 28.
Is Bloom Energy stock oversold right now?
Daily RSI at 36.11 is approaching oversold territory. The 1H RSI at 27.53 and 15m RSI at 18.85 signal deeply oversold conditions. However, no formal reversal signal has triggered on the daily MACD.
What could drive a recovery in Bloom Energy stock?
Strong Q2 earnings — particularly revenue growth, margin expansion, and backlog confirmation — could trigger a sharp recovery. With RSI near oversold and price at the Bollinger lower band, a positive surprise would enter an environment primed for a short-covering rally.
Disclaimer: This article is for informational purposes only and does not constitute financial advice, an investment recommendation, or a solicitation to buy or sell any financial instrument or cryptocurrency. The analysis provided is not indicative of future results. Investing in crypto assets and financial markets carries a high risk of capital loss. Always do your own research (DYOR) and consult a qualified financial advisor before making any decision.
Article produced with the assistance of artificial intelligence and reviewed by the editorial team.
