




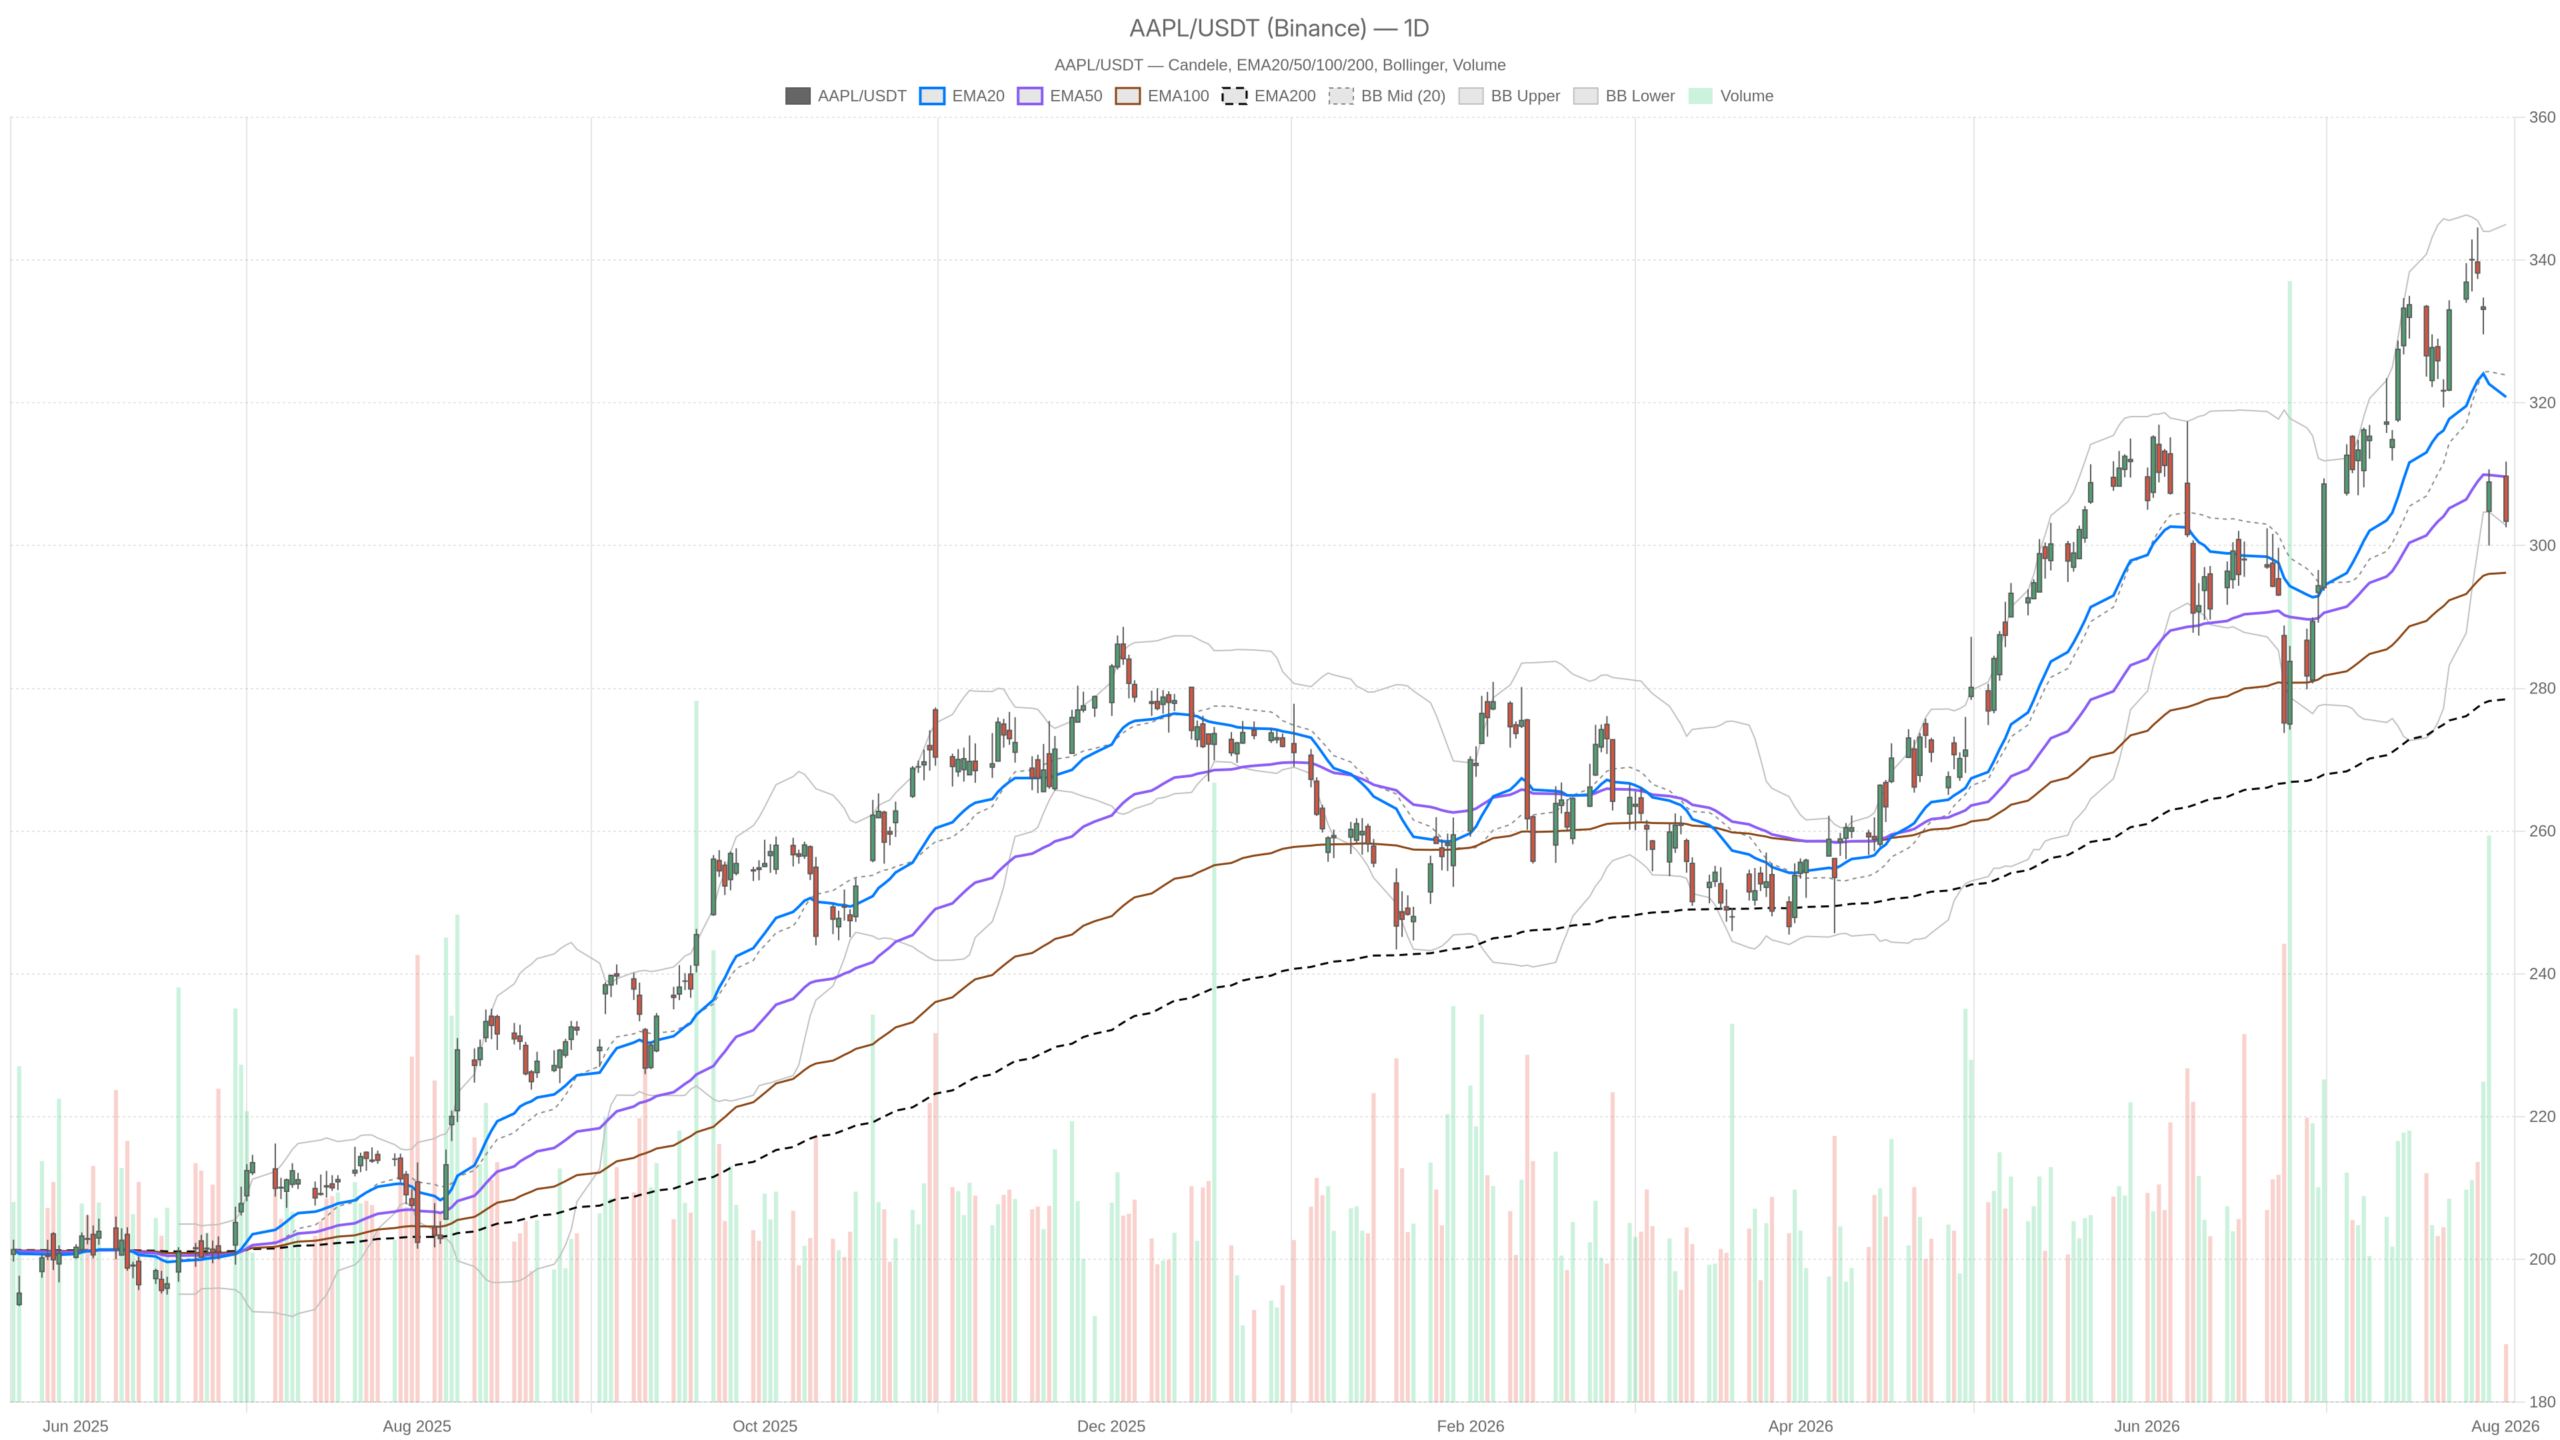
Apple shares closed at $303.41 on August 3, slipping from an open of $309.72. The pullback arrives just as CXMT‘s blockbuster IPO reshapes the memory-chip supply conversation. The daily chart shows a stock that has lost its short-term uptrend—is this a healthy pause or something deeper?
Summary
Key takeaways
- AAPL closed at $303.41, below both its 20-day EMA ($320.81) and 50-day EMA ($309.64).
- Daily RSI reads 40.33, reflecting selling pressure without reaching oversold extremes.
- CXMT‘s IPO surged 466% on its first day, raising $8.6 billion and reshaping the memory-chip supply landscape.
- A break below $300.06 support would confirm sellers’ control; reclaiming $309.64 would suggest recovery.
- Analyst opinion remains split, with Seeking Alpha reporting both Hold and Buy ratings on AAPL.
Apple’s Daily Bias Turns Cautious as Price Breaks Below Its Moving Averages
AAPL’s daily bias has turned cautious. Price now trades below both its 20-day and 50-day EMAs, signaling intermediate deterioration within an otherwise intact long-term trend.
EMA Alignment Signals a Corrective Phase
AAPL is trading below its 20-day EMA of $320.81 and its 50-day EMA of $309.64. However, price still sits comfortably above the 200-day EMA at $278.48. The broader long-term trend remains technically intact. The current structure looks more like a corrective phase inside a longer uptrend than a full trend reversal.
Momentum Indicators Confirm Downside Pressure Building
The daily RSI reads 40.33, reflecting genuine selling pressure without reaching oversold extremes. Momentum has clearly cooled, yet sellers have not exhausted themselves. Meanwhile, the MACD paints a similar picture. The MACD line at 4.53 sits below its signal line at 7.51. A negative histogram of -2.98 confirms downside momentum is building, not reversing.
Bollinger Bands add another layer. Price is pressing against the lower band at $302.81. The mid-band sits far above at $323.90 and the upper band at $345.00. This positioning signals a stretched downside move. It can either trigger a short-term bounce or confirm that sellers are firmly in control. At the same time, the daily ATR of 10.17 shows volatility has expanded. Average daily ranges now approach $10. Whichever direction wins out, the moves are likely to be sizable.
Pivot levels reinforce the cautious tone. The daily pivot sits at $305.91, with resistance at $309.27 and support at $300.06. Price is trading below the pivot and edging closer to that support. This puts sellers in control heading into the next session. Notably, the system still tags the daily regime as neutral. This highlights a real tension: the label suggests balance, yet the EMA alignment, candle structure, and MACD histogram all lean bearish. That conflict itself is a signal worth respecting.
The Hourly Chart Confirms Weakness, But Momentum Shows Early Signs of Fatigue
The hourly chart confirms the daily bearish bias. Price sits below all three key EMAs, signaling persistent selling pressure across multiple sessions.
Price at $303.41 trades below the 20-hour EMA at $312.30 and the 50-hour EMA at $320.94. The 200-hour EMA reads $318.04. This full bearish alignment confirms the daily weakness. It suggests sellers have controlled price action across multiple sessions, not just one bad day.
The hourly RSI at 30.36 is approaching oversold territory. Intraday selling has become stretched. At the same time, the MACD tells a slightly different story. The line sits at -7.31 against a signal line of -7.36. A histogram reading of just +0.05 hints that selling momentum may be pausing. It is far too early to call a reversal. Still, this is where the hourly picture complicates rather than simply confirms the daily bearish thesis.
Bollinger Bands on the hourly chart show price sitting between the mid-band at $312.77 and the lower band at $286.51. The move is not yet at a technical extreme on this timeframe. The hourly pivot reads $303.72, with resistance at $304.76 and support at $302.37. Price is essentially glued to the pivot line. In practice, the market is in a tight holding pattern, waiting for a catalyst.
15-Minute Chart: Execution Context Near Support
The 15-minute chart flags a bearish regime. Price is squeezed against the lower Bollinger Band, a setup that often precedes a short-term volatility spike.
Zooming into the 15-minute chart, the system explicitly flags a bearish regime. The data backs that up. Price trades below its 20-period EMA at $305.38 and its 50-period EMA at $308.60. It also sits below the 200-period EMA at $321.88. The RSI at 37.07 and a slightly negative MACD histogram of -0.08 both point toward continued short-term downside pressure.
However, price now sits right at the lower Bollinger Band. The band reads $303.04 against a mid-band of $305.39 and upper band of $307.73. This tight squeeze often precedes a short-term bounce, even within a larger downtrend. The 15-minute pivot at $303.63, with support at $302.45, gives traders a precise level to watch. A clean break below that zone would confirm sellers are pressing their advantage. A hold above it could set up a relief move back toward the pivot and resistance at $304.59.
CXMT’s Chip Boom Adds a New Layer to Apple’s Supply Chain Story
CXMT‘s dramatic IPO debut is reshaping the memory-chip landscape Apple relies on. The Chinese DRAM maker’s 466% first-day surge has introduced new supply-chain dynamics that matter directly for AAPL.
Beyond the charts, Apple’s fundamental backdrop has become more complicated. CXMT is central to that story. According to Yahoo Finance, CXMT closed its first day of trading at 49 yuan on July 27. That marked a 466% pop above its 8.66-yuan offer price. The Chinese DRAM maker raised roughly $8.6 billion in Asia’s largest IPO this year. It ended the session valued at approximately $488 billion. Only 6.73% of shares were freely tradable. The report frames the surge as giving Apple leverage in the memory-chip supply chain. That matters directly for a company as dependent on component sourcing as Apple.
Meanwhile, Bloomberg notes that CXMT has become one of the most polarizing stocks in Asia. Analyst price targets diverge by as much as $1 trillion. That dispersion underscores how volatile the memory-chip trade has become. This volatility filters directly into Apple’s supply chain calculus. On a related note, Seeking Alpha’s coverage of Apple’s supply-chain pipeline describes a genuine conversion test ahead. It warns that slower September-quarter growth could result from advanced-node chip supply constraints. These would affect iPhone, Mac, and iPad production. That report currently rates AAPL a Hold.
Bullish Scenario: What Would Support a Recovery
A bullish recovery would require AAPL to reclaim the $305.91 pivot and then the 50-day EMA at $309.64. Early signs of hourly momentum fatigue offer a tentative foundation to watch.
For bulls, the case rests on both technical and fundamental legs. On the fundamental side, another Seeking Alpha piece argues Apple is uniquely positioned. It describes Apple as both an AI winner and a defensive hedge. The argument cites a capex-light strategy and rates the stock a Buy. That view contrasts sharply with the AI-monetization concerns raised elsewhere. It captures the deep split in how analysts currently see the story.
Technically, a bullish reclaim needs to start with price recovering above the daily pivot at $305.91. It would then need to reclaim the 50-day EMA at $309.64. A move through those levels, paired with the RSI climbing back above 40, would suggest the correction is losing steam. The MACD histogram would also need to turn positive. On the hourly chart, that tiny positive MACD histogram of +0.05 already hints at fatigue in the selling. A confirmed bounce here could be the first domino.
Bearish Scenario: What Would Invalidate the Bullish Case
The bearish case is currently better supported by the data. A daily close below $300.06 would confirm sellers remain in control and open the door to a deeper pullback.
On the other hand, the bearish case is currently better supported by the data. A daily close below the $300.06 support level would confirm sellers remain in control. It would likely open the door to a deeper pullback. The 200-day EMA sits at $278.48. There is still meaningful room below current price before the long-term trend comes into question. However, a breakdown through $300 would be an important warning sign well before that level.
Fundamentally, the bearish case is reinforced by several concerns. Apple’s AI strategy lacks clear monetization while costs rise. Advanced-node chip supply constraints could slow iPhone, Mac, and iPad production growth into the September quarter. Meanwhile, CXMT-related volatility adds another layer of uncertainty to the memory-chip supply outlook. Therefore, a break of daily support combined with continued negative supply-chain headlines would be the clearest signal. The correction would have further to run.
Closing Take: Positioning Amid Volatility and Uncertainty
AAPL sits at a genuine crossroads. The daily trend has turned corrective, yet early signs of hourly momentum fatigue suggest patience around key levels is warranted.
Overall, AAPL sits at a genuine crossroads. The daily trend has turned corrective. The hourly chart confirms that weakness through full bearish EMA alignment. Yet a tiny positive MACD histogram on the hourly chart hints the selling pressure may be pausing. Meanwhile, the 15-minute chart shows price squeezed against its lower Bollinger Band. This setup often precedes short-term volatility in either direction.
With daily ATR near $10 and analyst opinion split between Hold and Buy ratings, uncertainty around Apple’s near-term path remains elevated. The volatility spilling over from CXMT’s dramatic IPO debut adds another dimension. The wide dispersion in analyst price targets on that name underscores how unsettled the chip supply-chain backdrop remains. In this environment, patience around key levels looks more sensible than chasing either extreme. Watch $300.06 on the downside and the $305.91 to $309.64 zone on the upside.
FAQ
What is CXMT and why does it matter for Apple?
CXMT is a Chinese DRAM maker that launched Asia’s largest IPO this year, raising approximately $8.6 billion and surging 466% on its first day of trading. It matters for Apple because it reshapes the memory-chip supply chain that Apple depends on for iPhone, Mac, and iPad production.
What are the key support and resistance levels for AAPL right now?
Key support sits at $300.06, with a secondary floor at the 200-day EMA of $278.48. Resistance stands at the daily pivot of $305.91 and the 50-day EMA of $309.64. A break below $300 would signal sellers remain in control. A reclaim of $309.64 would suggest a recovery is underway.
Is AAPL’s long-term uptrend still intact?
Yes, the long-term uptrend remains technically intact. AAPL trades above its 200-day EMA of $278.48. The current pullback appears to be a corrective phase within a broader uptrend rather than a full trend reversal, though the $300 level remains critical.
Disclaimer: This article is for informational purposes only and does not constitute financial advice, an investment recommendation, or a solicitation to buy or sell any financial instrument or cryptocurrency. The analysis provided is not indicative of future results. Investing in crypto assets and financial markets carries a high risk of capital loss. Always do your own research (DYOR) and consult a qualified financial advisor before making any decision.
Article produced with the assistance of artificial intelligence and reviewed by the editorial team.
