



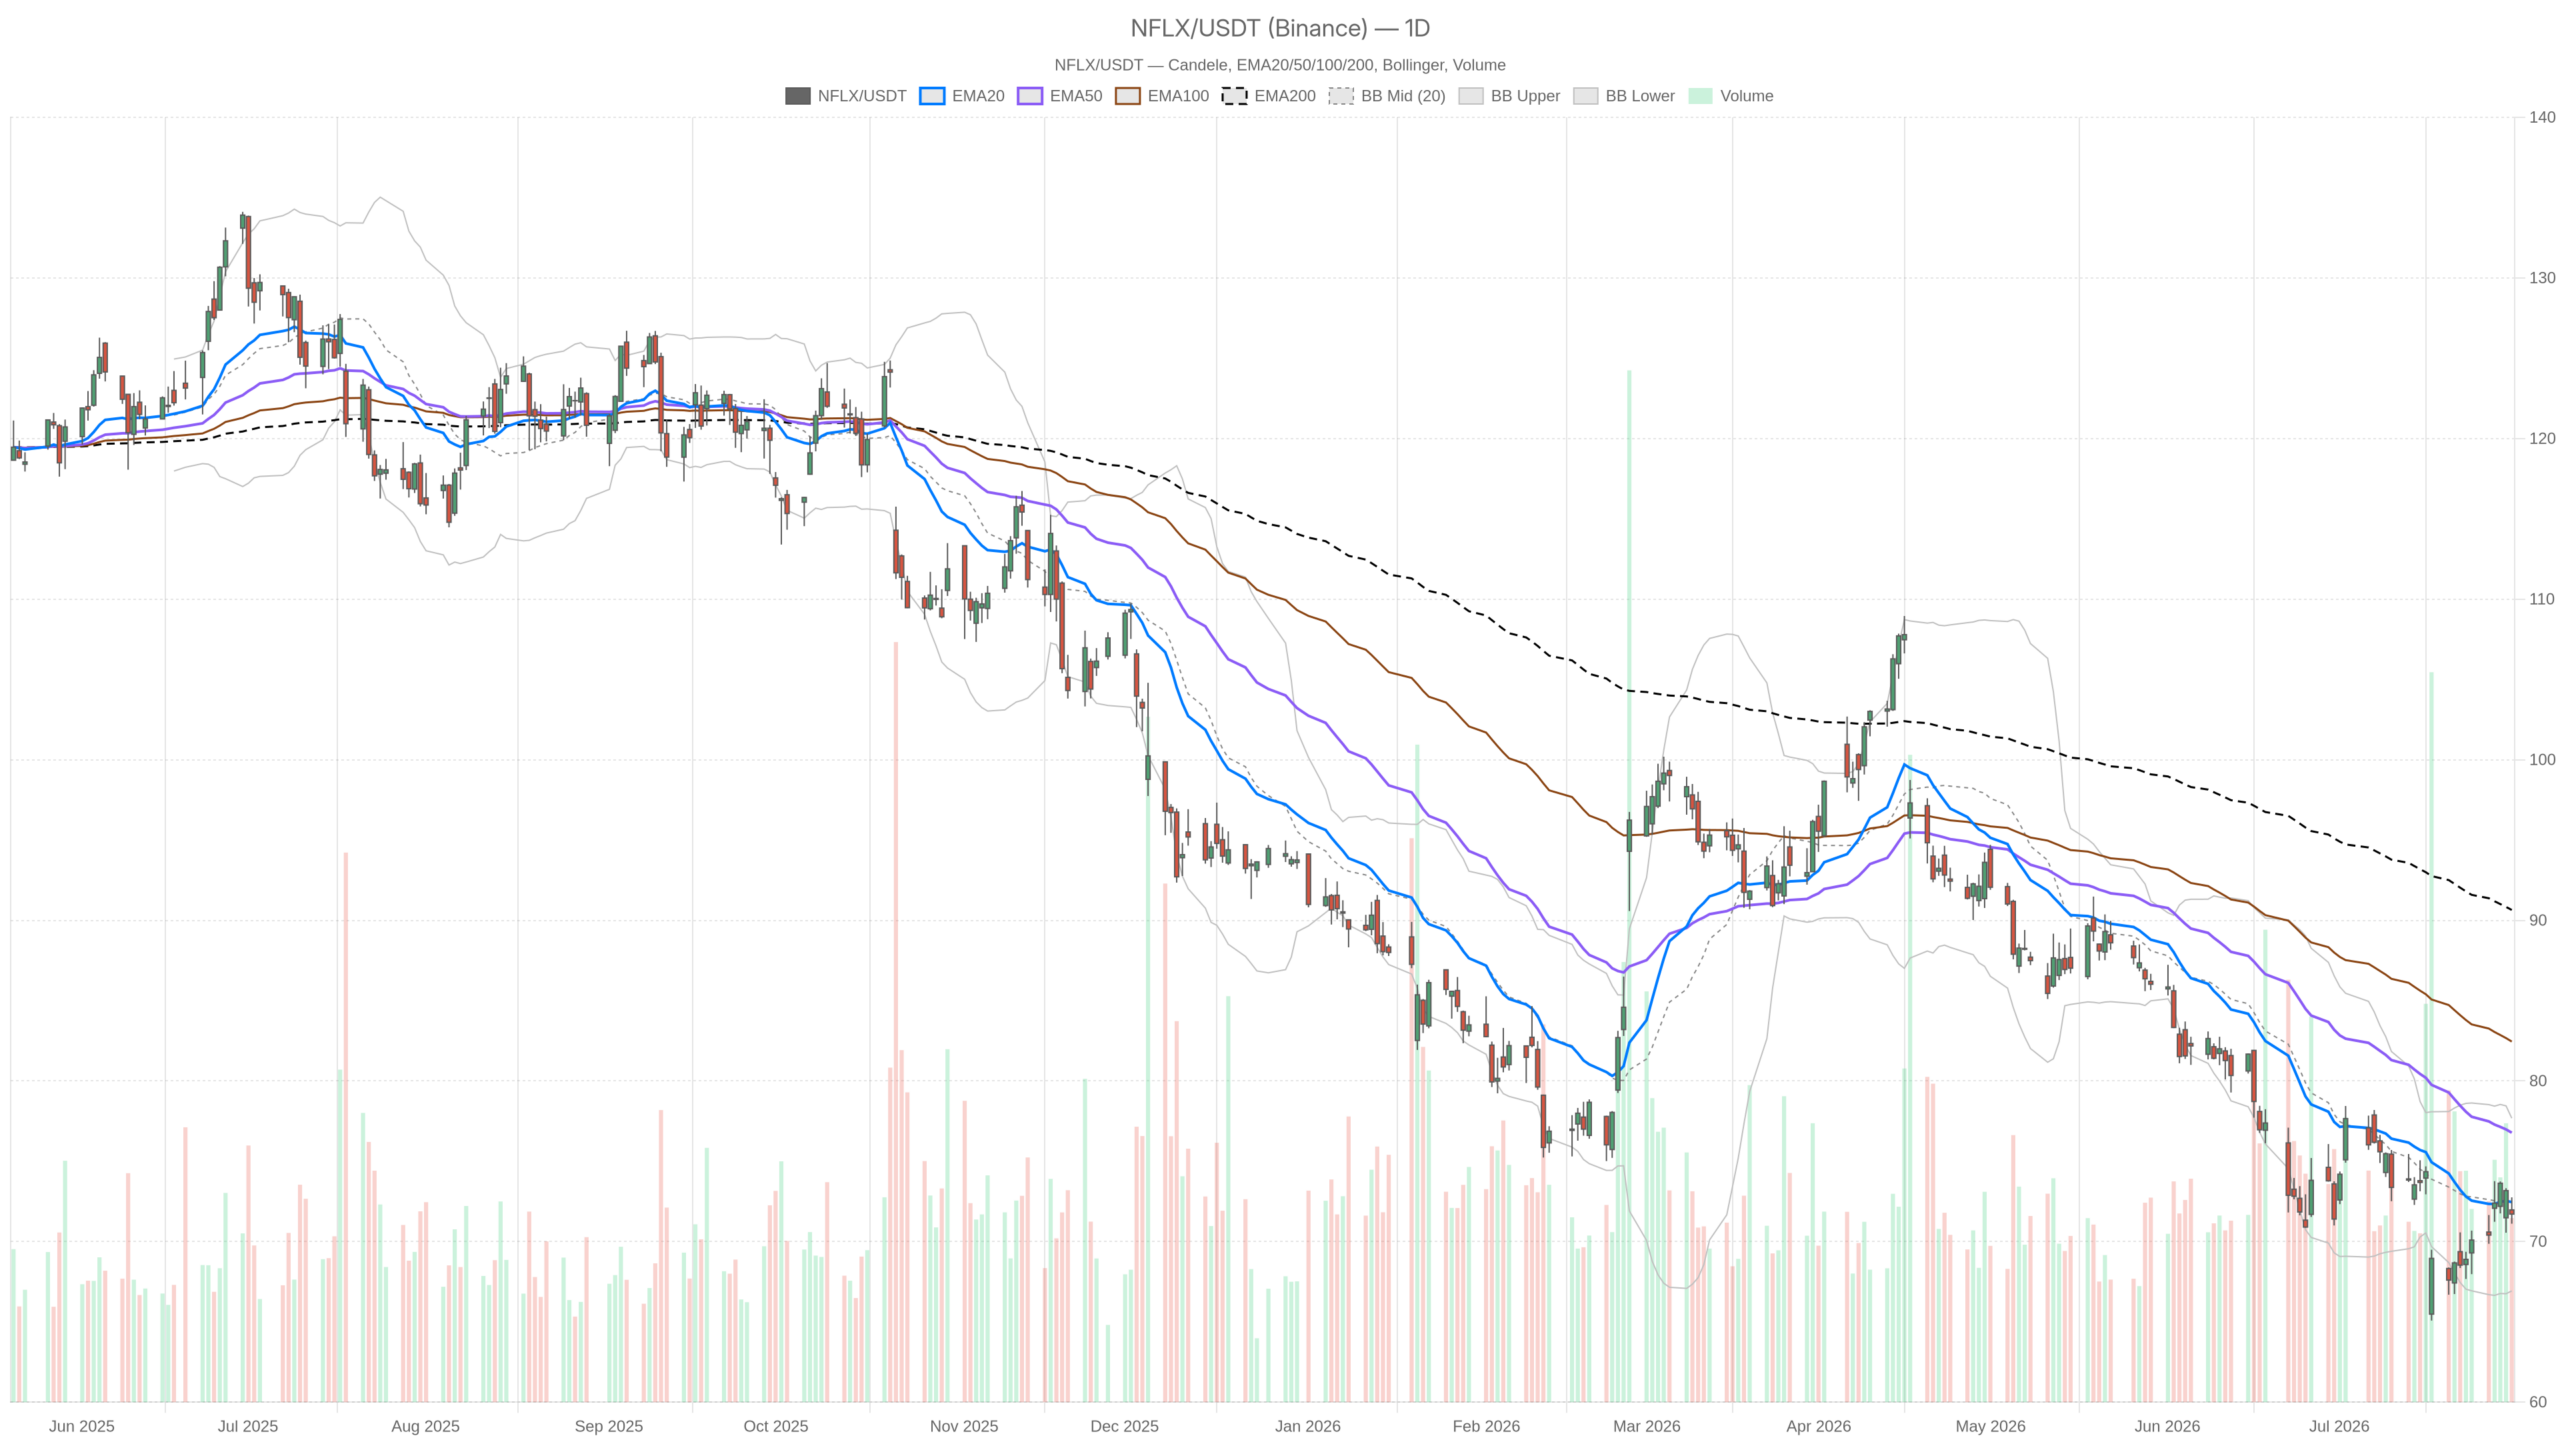
Netflix Stock closed at $71.71 on July 31, trapped below every major daily moving average. The EMA20 sits at $72.46, the EMA50 at $76.77, and the EMA200 at $90.64. This stacked bearish alignment confirms selling pressure remains firmly in control.
Summary
Key takeaways
- Netflix Stock closed at $71.71 on July 31, below all major daily moving averages — EMA20 at $72.46, EMA50 at $76.77, and EMA200 at $90.64.
- Daily RSI14 sits at 44.6 with MACD still negative, though a positive histogram at 0.6 signals decelerating downside momentum.
- The stock hit a 52-week low after Q2 earnings despite beating estimates, as guidance slowed and free cash flow declined.
- Hourly and 15-minute charts show neutral consolidation, with price compressed in a tight range and momentum flattening.
- Key levels to watch: $72.60 resistance and $70.96 support; a break of either likely sets the next directional move.
Notably, the fundamental backdrop reinforces the bearish technical picture. Netflix hit a 52-week low after Q2 earnings, according to Seeking Alpha. The company beat on estimates, but guidance slowed and free cash flow fell, keeping sellers in control despite the headline beat. Meanwhile, Yahoo Finance and The Motley Fool note the stock is down as much as 46%. It trades 43% below its 52-week high — a significant repricing that aligns with the daily technical structure.
Daily Bias: Bearish Regime, But Momentum Is Losing Speed
The daily bias for Netflix Stock remains firmly bearish. However, momentum indicators show the pace of selling is starting to ease. RSI14 sits at 44.6, below the neutral 50 line but not deeply oversold. That reading suggests sellers still have the upper hand, though momentum is not accelerating lower. MACD tells a similar story. The line is at -1.49 and the signal at -2.09, both firmly negative. However, the histogram has turned positive at 0.6, meaning the gap between the two lines is narrowing. That often signals decelerating downside momentum, even if the broader trend has not reversed.
Meanwhile, Bollinger Bands on the daily chart show price hovering near the mid-band at 72.3. The upper band sits at 77.68 and the lower at 66.93. Sitting near the midpoint after a steep decline suggests consolidation rather than sharp trending. ATR14 at 2.7 confirms volatility remains elevated, consistent with a stock still absorbing a post-earnings shock. The daily pivot at 71.86 frames a tight battleground, with resistance at 72.6 and support at 70.96.
1H Timeframe: A Neutral Pause Inside a Bearish Trend
The 1-hour chart shows Netflix Stock in neutral consolidation rather than confirming the daily bearish trend. Price at 71.7 is trapped between EMA20 at 72.02 and EMA50 at 71.64. Meanwhile, EMA200 sits higher at 73.43, capping any upside. RSI14 at 47.83 is essentially flat, offering no strong directional signal. MACD on the 1H is barely negative. The line sits at -0.01 and the signal at 0.18, producing a small negative histogram of -0.19. In short, hourly momentum has gone quiet.
Therefore, the conflict between timeframes becomes clear. On the daily chart, the trend is down. On the hourly chart, the stock is pausing rather than extending losses. Neither reading is wrong. This pattern is common after a large post-earnings drop. The higher timeframe carries the scars of the selloff, while the lower timeframe reflects a market seeking equilibrium. On the 1H chart, Bollinger Bands confirm the calmer tone. The mid-band sits at 72.35, with bands at 74.08 and 70.63. ATR14 has dropped to 0.83, considerably lower than the daily volatility reading.
15-Minute Execution Context
The 15-minute chart shows Netflix Stock in a tight compression pattern, with all key indicators signaling equilibrium. EMA20 at 71.73, EMA50 at 71.97, and EMA200 at 71.58 are all clustered closely together. Price at 71.7 sits right in the middle of this narrow band. RSI14 at 46.71 and a nearly flat MACD histogram of 0.04 both point to a market without directional conviction. At this granular level, equilibrium dominates.
Notably, Bollinger Bands are tightly compressed on the 15-minute chart. The upper band sits at just 71.81 and the lower band at 71.45. ATR14 has dropped to 0.2, confirming the compression. For short-term positioning, this narrow range around the 15m pivot of 71.7 is the level to watch. A break above 71.81 or below 71.59 could set the tone for the next few hours.
Bullish Scenario for Netflix Stock
A bullish reversal for Netflix Stock would require reclaiming the daily EMA20 near $72.46 and breaking through resistance at $72.60. If that coincides with continued expansion of the positive MACD histogram, downside momentum would appear to be genuinely fading. RSI pushing back above 50 would add further confirmation.
On the fundamental side, The Motley Fool notes Netflix now trades at 20 times forward earnings. That valuation no longer resembles a pure growth stock. It has drawn interest from investors who see the recent decline as overdone. A new multi-year licensing deal for The Walking Dead Universe also gives the content pipeline an incremental boost. Covering international streaming through AMC Global Media, the deal offers bulls a tangible catalyst to point to.
Bearish Scenario for Netflix Stock
The bearish case remains intact as long as Netflix Stock stays capped below the daily EMA20 and EMA50. A rejection near the daily pivot at 71.86 would open the door lower. A subsequent break of support at $70.96 would target the lower Bollinger band at $66.93. That move would confirm the daily bearish regime is still very much active.
At the same time, the fundamental backdrop supports caution. Slowed guidance and falling free cash flow from Q2 pushed the stock to a 52-week low — despite an earnings beat. Additionally, Yahoo Finance notes there is little on the immediate horizon to reverse the stock’s losses. Longer-term ideas like video podcasting and gaming remain speculative. Any further disappointment on execution would likely reinforce the downtrend rather than end it.
Closing Take
Overall, Netflix Stock sits at a genuine inflection point between timeframes. The daily trend remains bearish, with price trapped under a declining EMA structure and volatility still elevated. At the same time, shorter-term charts show a market that has stopped falling. Netflix Stock is consolidating in a tight range while digesting a brutal post-earnings repricing.
Positioning here requires patience. The next directional break will likely set the tone for the coming sessions. Watch daily resistance near 72.6 and support near 70.96. Until that happens, choppy price action remains the most realistic expectation.
FAQ
What is the current trend for Netflix Stock?
Netflix Stock remains in a daily downtrend, with price trading below all major moving averages. The EMA20 at $72.46, EMA50 at $76.77, and EMA200 at $90.64 are all sloping downward. RSI14 at 44.6 and negative MACD confirm bearish control, though the positive histogram at 0.6 suggests momentum is decelerating.
What are the key support and resistance levels for NFLX?
Key resistance sits at $72.60 and the daily EMA20 at $72.46. A break above these levels would be the first signal of a potential shift. Key support lies at $70.96, with the lower Bollinger band at $66.93 as the next major downside target if selling resumes.
Is Netflix Stock showing any signs of a reversal?
Not yet on the daily timeframe. However, the MACD histogram has turned positive at 0.6, signaling downside momentum is decelerating. The hourly and 15-minute charts show neutral consolidation, which could precede either a recovery or another leg lower. Confirmation requires a break above $72.60.
Why did Netflix Stock drop to a 52-week low?
Netflix beat Q2 earnings estimates but disappointed on forward guidance and reported declining free cash flow. The stock is down as much as 46% and trades 43% below its 52-week high, according to Yahoo Finance and The Motley Fool.
Disclaimer: This article is for informational purposes only and does not constitute financial advice, an investment recommendation, or a solicitation to buy or sell any financial instrument or cryptocurrency. The analysis provided is not indicative of future results. Investing in crypto assets and financial markets carries a high risk of capital loss. Always do your own research (DYOR) and consult a qualified financial advisor before making any decision.
Article produced with the assistance of artificial intelligence and reviewed by the editorial team.
